


How do you measure pipeline coverage for inbound SDR on Pipedrive without another point solution in 2027?
Quality
Certified

Pipeline coverage for inbound SDRs is measurable inside Pipedrive alone: stamp every deal with source and SDR owner, weight open deal value by stage probability, then divide that weighted sum by the SDR's quota for the period. Insights reports and workflow automations handle the math and alerting, so no extra point solution is needed.
What coverage actually means for an inbound SDR motion
Coverage is a ratio, and ratios only mean something when both halves are defined precisely. The denominator is the revenue target the SDR is accountable for in a period — usually sourced pipeline dollars or meetings-converted-to-opportunity value, not closed revenue, because an SDR rarely controls the close. The numerator is open, qualified pipeline attributable to that SDR inside the window where it can still convert. Get either half wrong and the number becomes theater.
For inbound specifically, the shape of the problem differs from outbound in ways that change how you configure Pipedrive. Inbound lead flow is lumpy and largely outside the rep's control: a webinar, a review-site placement, or a product launch can double form fills in a week. That means an inbound SDR's coverage can spike or crater for reasons that have nothing to do with their effort. If you build coverage reporting that treats inbound and outbound identically, you will coach the wrong people. The fix is to split the ratio into two views — coverage against quota (the accountability number) and coverage against available lead volume (the efficiency number). The first tells you whether the quarter is safe. The second tells you whether the SDR is working the demand they were handed.
There is also a definitional trap around what counts as "pipeline." Some teams count every inbound form fill sitting in a Pipedrive lead inbox. That inflates the ratio to meaningless levels, because raw MQLs convert at rates that make them nearly worthless as coverage. The defensible line is: pipeline counts only after a qualification event you can point to in the record — a completed discovery call, an agreed next step, a stage change past the SDR's handoff point. Anything earlier belongs in a separate volume metric. In Pipedrive terms, this usually means coverage counts deals, not leads, and the deal only exists once qualification has happened.

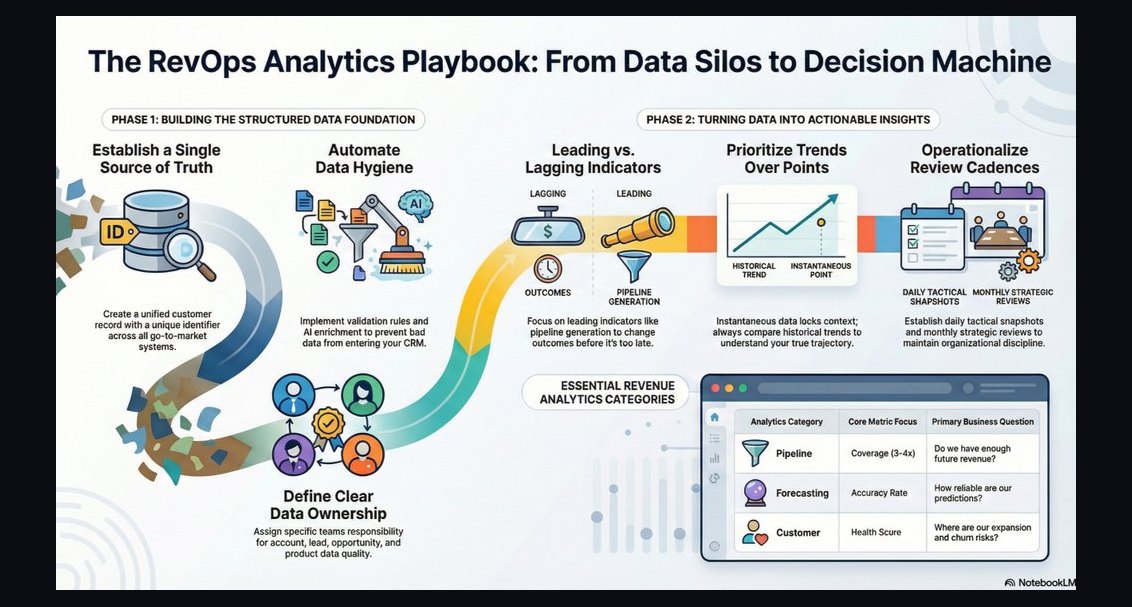
Why does any of this matter enough to build for? Because coverage is the earliest reliable leading indicator you have. Closed-won is a lagging number that tells you about work done sixty to a hundred and twenty days ago. Activity counts are so early they are noise. Coverage sits in the middle: it tells you today whether the quarter two quarters out is fundable. A RevOps team that reports coverage weekly can intervene while intervention is still possible. A team that reports only bookings intervenes after the miss. That is the entire argument for building this, and it is why the temptation to buy a point solution shows up — teams assume the reporting is hard. In Pipedrive, the reporting is the easy part. The data hygiene is the hard part, and no point solution fixes that for you.
One more framing point that saves arguments later: coverage is a portfolio metric, not an individual one, until your sample size supports individual reads. An SDR with eight open opportunities has a coverage number dominated by variance — one $200K deal entering or leaving swings it by fifty points. Below roughly fifteen to twenty open opportunities per rep, read coverage at the team level and use per-rep numbers only as a conversation starter, never as a performance verdict. This is the single most common analytical error in SDR coverage programs, and it is free to avoid.
Building the measurement inside Pipedrive, step by step
The build has a fixed order, and skipping ahead is what causes rebuilds. Start with fields, then stage probabilities, then reports, then automation. Fields first, because every downstream object references them.

Step one — establish attribution fields. On the deal object, you need at minimum: an SDR owner field (a Person or User-type custom field, distinct from the deal owner, which will become the AE), a lead source field with a controlled picklist, and a source-detail field for campaign or content granularity. Do not use free text for source. A single-select field with ten to fifteen options — Organic Search, Paid Search, Content Download, Webinar, Review Site, Referral, Chat, Demo Request, Partner Referral, Product Signup — is worth more than a hundred open-text values. If you are importing from a marketing platform, map its values into this picklist at import time rather than accepting whatever string arrives.
Step two — set stage probabilities honestly. Pipedrive lets you assign a probability to each pipeline stage, and it will compute weighted value for you. The default probabilities that ship with a new pipeline are placeholders. Replace them with your own historical conversion rates: take the last four to eight quarters of closed deals, count how many that ever entered stage N eventually reached closed-won, and use that percentage. Most inbound-sourced B2B pipelines land somewhere in the range of 10–25% at first qualified stage, 25–45% at discovery complete, 40–60% at proposal, and 60–80% at negotiation — but your numbers are your numbers, and pulling them from your own history is a twenty-minute exercise with an export and a pivot table. Recalibrate quarterly.
Step three — decide the coverage window. Coverage is meaningless without a time boundary. The standard construction is: open pipeline with an expected close date inside the target period, divided by the target for that period. If you count deals expected to close in Q4 against a Q3 quota, you will overstate coverage badly. Pipedrive's expected close date field is the lever here, and it is only useful if reps maintain it — which means it has to be a required field on stage advancement, enforced through a workflow that flags blank or past-dated close dates.

Step four — build the Insights report. In Insights, create a deals report, filter to open deals with SDR owner set and expected close date within the period, group by SDR owner, and display the sum of weighted value. Add a second column for deal count and a third for average deal value — you need all three to interpret the ratio. Save this as a dashboard and give every SDR and manager view access. The target line comes from a person-level or user-level custom field holding the quota, which you update at the start of each period.
Step five — automate the exception, not the report. Do not build automation that recalculates coverage; Insights already does that on read. Build automation that catches the data problems which corrupt the number: deals with no source, deals with no SDR owner, deals with close dates in the past, deals sitting in a stage past its expected duration. Each of those is a Pipedrive workflow that fires a task or notification to the record owner. Clean inputs make the report trustworthy; a trustworthy report is what makes the whole exercise worth doing.
What this costs, how long it takes, and where the numbers usually land
The honest cost picture: the build is labor, not license. If your team is already on a Pipedrive tier that includes Insights and workflow automation, the marginal software spend for this is zero. Feature availability varies by tier and changes over time, so check your current plan's feature list before you design — the practical constraint is whether you have reporting depth and automation on your plan, and whether formula-style fields are available to you. If they are not, the arithmetic moves to the report layer or to a weekly export, which still works.
Time to build, for someone competent in Pipedrive administration: a working first version in two to four hours of focused configuration. Field creation is fifteen minutes. Stage probability calibration is the slowest part if you do it properly with historical data — budget an hour for the export and analysis. Report building is another hour. Workflow automation for data hygiene is an hour. What takes longer is backfill: existing open deals with missing source or SDR attribution have to be cleaned before the first report means anything, and that can be a day of work or a week depending on how many open records you carry and how bad the hygiene has been.

Adoption is the real timeline. Expect four to six weeks before the number is trusted. Week one, reps discover their deals are missing fields. Week two, the coverage number looks wrong to managers because the backfill is incomplete. Weeks three and four, hygiene workflows have cleaned the tail and the number starts holding steady week over week. By week six you can make decisions on it. Anyone who promises a same-week trustworthy coverage metric is describing the report build, not the data reality.
On the ratio targets themselves: the widely used rule of thumb is 3x to 4x pipeline coverage against quota, and it is a rule of thumb, not a law. The correct multiple is mathematically derivable from your own win rate — if you close 25% of qualified pipeline, you need 4x; if you close 33%, you need 3x; if you close 15%, you need closer to 6.5x. Divide one by your win rate and you have your floor. Then add a buffer for slip, because some deals that were going to close in the period will move out of it. A 10–20% buffer on top of the mathematical floor is typical. Teams that adopt 3x because they read it somewhere, while closing at 12%, will miss every quarter and never understand why.
For inbound SDR coverage specifically, the multiple often runs lower than for outbound-sourced pipeline, because inbound deals typically convert better — the prospect raised their hand. That is not universal, and some inbound sources (ungated content downloads, for instance) convert far worse than others (demo requests). This is exactly why the source field matters: coverage by source lets you set different multiples per source rather than pretending all inbound is one thing. A team with a 40% close rate on demo requests and 6% on content downloads should be tracking those as separate coverage pools, because blending them produces a number that describes neither.
Budget also for maintenance, which is where most homegrown metrics die. Quarterly recalibration of stage probabilities is thirty minutes. Quota field updates at period start are fifteen minutes. Reviewing the hygiene workflow exceptions is a standing weekly item of ten to fifteen minutes for a manager. Under an hour a month, total. If nobody owns that hour, the number decays within two quarters and someone will propose buying a tool to fix it — which will decay the same way, because tools do not create ownership.
Where teams get this wrong

Counting unqualified volume as pipeline. The most common failure. Inbound generates a lot of records, and it is tempting to let all of them count. A coverage number that includes raw form fills will read 15x and mean nothing. Draw the qualification line, write it down, and enforce it with stage definitions.
Letting expected close dates rot. Coverage is period-bounded, so a stale close-date field silently corrupts the ratio in both directions. Deals whose dates have passed but which are still open either inflate the current period or vanish from it depending on how your filter is written. Run a weekly exception list of open deals with past close dates and require a decision on each: push with a new date, or lose it.
Weighting twice. A subtle one. If you apply stage probability weighting and then also apply a haircut for "sandbagging" or "manager confidence," you are double-discounting. Pick one weighting mechanism. Stage probability is the defensible one because it comes from history rather than opinion.
Building the report before fixing attribution. Teams get excited about the dashboard and ship it against dirty data. The first executive review surfaces obvious errors, credibility is lost, and the metric is abandoned. Backfill first, publish second. If the backfill will take two weeks, say so and publish in two weeks.
Confusing SDR ownership with deal ownership. In Pipedrive the deal owner field is typically the AE who will work it. If you report coverage by deal owner, you are reporting AE coverage, not SDR coverage. This is why the separate SDR attribution field exists, and why it must be write-protected after handoff — otherwise the SDR's credit disappears the moment the AE takes the record.

Judging individuals on small samples. Covered above, but it bears repeating because the damage is real. A rep with a dozen open deals has a coverage number driven by whether one large deal happens to be open this week. Read the team number; use the individual number to start a conversation, never to end one.
Assuming a point solution would have solved it. Every failure mode listed here is a data-definition or data-hygiene failure. A purchased coverage tool reads the same Pipedrive fields you would read. If the source field is empty, the tool shows an empty source field with better typography. Buying is the right call when you need cross-system attribution — pipeline that spans a CRM, a marketing platform, and a product-usage database — not when you need arithmetic on one system's records.
Ignoring the upstream side. Inbound SDR coverage is downstream of marketing's lead volume and upstream of AE capacity. If coverage drops, the cause is often not the SDR: lead volume fell, or routing broke, or a form stopped posting. Before coaching a rep on a coverage dip, check whether the inbound volume that fed them dipped first. Reporting lead volume next to coverage on the same dashboard makes that a two-second check instead of a two-day investigation.
Choosing your approach: native, spreadsheet, or a real tool
There is a legitimate decision to make here, and the answer is not always "build it in Pipedrive." Three viable paths exist, and the choice turns on how many systems hold the truth.
Native Pipedrive is correct when the CRM is the system of record for pipeline, your quota structure is straightforward, and you need weekly rather than real-time reads. This covers the large majority of inbound SDR teams. Cost is administrative time. The advantage beyond cost is that the metric lives where the work lives — reps see it in the same tool they update, which materially improves hygiene compared to a metric that lives in a separate dashboard nobody opens.

Pipedrive plus a scheduled export is correct when you need arithmetic your plan tier does not support, when you want to blend CRM data with a small amount of outside data (marketing spend, for instance, to compute cost per pipeline dollar), or when you need historical snapshots. Pipedrive shows you current state; it does not natively give you "what did coverage look like eight weeks ago." A weekly export to a sheet or a warehouse table, appended rather than overwritten, builds that history for effectively nothing. This is the single highest-value addition to a native build, and it is fifteen minutes a week or a scheduled job.
A dedicated revenue-intelligence platform earns its cost when attribution genuinely spans systems, when you need forecast-grade snapshotting and change-tracking across thousands of deals, or when you have enough headcount that the manual maintenance hour becomes ten. Below roughly fifteen to twenty SDRs on a single-CRM stack, the math usually favors building. Above that, and especially with multiple pipelines, regions, or product lines, the tooling starts to pay for itself in analyst time saved.
The decision rarely stays fixed. Most teams should build native first regardless of eventual destination, because the act of building forces the definitional work — what counts as pipeline, who owns attribution, what the window is — that any tool would require you to configure anyway. Teams that buy first often discover they have purchased a very expensive way to display undefined metrics.
Adjacent motions this same build unlocks
Once the fields and weighting exist, several neighboring measurements come nearly free, which changes the return on the two-to-four-hour build.
Source-level conversion economics. With source stamped on every deal and stage probability calibrated, you can report win rate and average deal size by inbound source. That is the input marketing needs to reallocate spend, and it typically produces a bigger financial swing than the coverage metric itself. A source converting at 4% with a long cycle is costing you SDR capacity even if it produces impressive lead counts.

Handoff quality between SDR and AE. The same SDR attribution field lets you measure what happens after handoff: what percentage of SDR-sourced deals survive the first AE meeting, how long they sit before first AE touch, and whether certain SDRs consistently pass deals that die immediately. This is a coaching goldmine and it requires no additional configuration — just a different grouping on the same data.
Capacity planning for AEs. Coverage by SDR aggregates upward into total sourced pipeline, which against AE capacity tells you whether you are about to overload or starve the closing team. Inbound teams frequently discover they are generating pipeline faster than AEs can work it, which is a hiring signal, not a marketing signal.
Speed-to-lead as a coverage driver. Inbound response time correlates strongly with qualification rates, and Pipedrive timestamps give you the raw material — time between lead creation and first logged activity. Reporting that next to coverage shows whether a coverage dip is a demand problem or a responsiveness problem. It is the same dashboard with one more column.
Comparable builds on other CRMs. The pattern here is not Pipedrive-specific. The same five steps — attribution fields, calibrated stage probabilities, a bounded window, a grouped report, hygiene automation — port directly to any mainstream CRM. What varies is the reporting layer's flexibility and whether calculated fields are available natively. A RevOps practitioner who builds this once in Pipedrive can rebuild it elsewhere in an afternoon, which is worth knowing if a CRM migration is anywhere on the horizon.
Forecast-adjacent uses, with care. Coverage is not a forecast, and treating it as one is a known failure. But coverage trending down for three consecutive weeks is an early warning that belongs in the forecast conversation. Bring it as a leading indicator with the caveat attached; do not let it get converted into a commit number.
Related questions
Should coverage count deals or leads in Pipedrive?
Deals, not leads. Leads in the Pipedrive inbox represent unqualified volume and convert at rates too low to be meaningful coverage. Track lead volume as a separate metric on the same dashboard so you can tell a demand problem from a working problem.
What stage probability should I assign for a first qualified stage?

Derive it from history rather than guessing: count how many deals that ever entered that stage eventually closed won over the last four to eight quarters. Recalibrate quarterly. Defaults that ship with a new pipeline are placeholders and will skew every weighted number downstream.
How do I keep the SDR credited after an AE takes the deal?
Use a dedicated SDR attribution field separate from the deal owner field, and lock it after the handoff stage so later edits cannot overwrite it. Reporting on deal owner alone reports AE coverage, not SDR coverage.
What coverage multiple should an inbound team target?
Divide one by your qualified-pipeline win rate to get the mathematical floor, then add ten to twenty percent for slip. A 25% win rate implies roughly 4x plus buffer. Set separate multiples per inbound source when conversion rates differ materially.
Does Pipedrive store historical coverage snapshots?
It shows current state rather than point-in-time history for this purpose. If you need to see what coverage looked like weeks ago, append a weekly export to a sheet or warehouse table. That append-only history is the cheapest and highest-value addition to a native build.
FAQ
Do I need a point solution to measure pipeline coverage on Pipedrive?
For a single-CRM inbound SDR motion, no. Custom fields for source and SDR attribution, calibrated stage probabilities, an Insights report grouped by SDR owner, and a few hygiene workflows cover the requirement. A dedicated tool earns its cost when attribution spans multiple systems, when you need forecast-grade snapshotting across thousands of records, or when analyst maintenance time exceeds what the license costs.
How long does the build take end to end?

Two to four focused hours of configuration for a working first version, plus backfill time for existing open deals with missing attribution — anywhere from a day to a week depending on record volume and hygiene history. Trust in the number typically takes four to six weeks, because early weeks surface data problems the report exposes for the first time.
What is the biggest single mistake teams make here?
Counting unqualified inbound volume as pipeline. It produces a coverage ratio in the double digits that means nothing and cannot be acted on. The fix is a written qualification definition tied to a specific stage or logged event, enforced so the record itself proves qualification happened.
How should I read coverage for a rep with very few open deals?
Carefully, and mostly at the team level. Below roughly fifteen to twenty open opportunities per rep, one deal entering or leaving swings the ratio enough to overwhelm any signal about rep behavior. Use the individual number to start a conversation about specific deals, not to render a performance judgment.
Should inbound and outbound share one coverage target?
Usually not. Inbound-sourced deals often convert at different rates than outbound, and different inbound sources frequently differ from each other by a wide margin. Because the correct multiple is derived from win rate, materially different win rates imply materially different targets. Stamping source on every deal is what makes that split possible.
What ongoing maintenance does this require?
Under an hour a month: quarterly stage-probability recalibration, quota field updates at period start, and a weekly ten-to-fifteen-minute review of hygiene exceptions like blank source fields and past-dated close dates. The failure mode is not complexity — it is that nobody is assigned that hour, at which point the metric decays regardless of whether you built it or bought it.
Sources
- https://support.pipedrive.com/ — Pipedrive's official knowledge base covering custom fields, pipeline stage probabilities, Insights reporting, and workflow automation.
- https://www.pipedrive.com/en/features/insights — Product documentation for Pipedrive's native reporting and dashboard capabilities.
- https://developers.pipedrive.com/ — Pipedrive developer documentation for the API, useful for scheduled exports and snapshotting.
- https://hbr.org/ — Harvard Business Review publishes research on sales forecasting accuracy and pipeline management practices.
- https://www.gartner.com/en/sales — Gartner's sales research practice covers pipeline health, forecasting, and revenue operations frameworks.
- https://www.forrester.com/ — Forrester publishes B2B revenue process and demand-management research relevant to inbound funnel design.
- https://www.salesforce.com/resources/ — Salesforce's resource library documents comparable pipeline coverage and forecasting concepts across CRMs.
- https://blog.hubspot.com/sales — HubSpot's sales blog covers SDR metrics, lead qualification definitions, and funnel conversion benchmarking.
Related on PULSE
- How do you measure pipeline coverage for land-and-expand on Pipedrive without another point solution ?
- How do you measure pipeline coverage for PLG-to-sales handoff on Pipedrive without another point solution ?
- How do you measure pipeline coverage for usage-based pricing on Pipedrive without another point solution ?
- How do you measure pipeline coverage for full-cycle AE on Pipedrive without another point solution ?
- How do you measure pipeline coverage for partner-sourced pipeline on Pipedrive without another point solution ?
- How do you measure pipeline coverage for channel co-sell on Pipedrive without another point solution ?
This page will be disappearing soon. Save it to your device for $1 — or read it free while it is here.
@Kory-White- · if Venmo asks, the last 4 of my number are 2012
This page is gone.
This one is off the shelf now. $1 keeps it on your phone for good — the whole page, pictures and diagrams included.
 revopsHow do you measure pipeline coverage for full-cycle AE on Pipedrive without another point solution in 2027?
 revopsHow do you measure pipeline coverage for partner-sourced pipeline on Pipedrive without another point solution in 2027?
 revopsHow do you measure pipeline coverage for PLG-to-sales handoff on Pipedrive without another point solution in 2027?
 revopsHow do you measure pipeline coverage for channel co-sell on Pipedrive without another point solution in 2027?
 revopsHow do you measure pipeline coverage for land-and-expand on Pipedrive without another point solution in 2027?
 revopsHow do you measure pipeline coverage for usage-based pricing on Pipedrive without another point solution in 2027?
 revopsWhat is the RevOps playbook for forecast sandbagging during AE-led on Salesforce when parent-company rollup reporting in 2027?
 revopsHow do you report forecast accuracy for outbound SDR on Pipedrive without another point solution in 2027?
 revopsWhat is the RevOps playbook for partner deal registration conflicts during channel co-sell on Salesforce when sales on Outreach in 2027?
 revopsWhat is the RevOps playbook for partner deal registration conflicts during full-cycle AE on Salesforce when parent-company rollup reporting in 2027?