


How do you prove Palantir Foundry improved win rate without creating a new shadow data mart for multi-year ramp contracts teams on Dynamics 365 when marketing ops on Marketo in 2027?
Quality
Certified

Prove Foundry's win-rate impact by building a single Ontology-based report inside Foundry itself — join Dynamics 365 opportunity history, Marketo campaign engagement, and ramp-contract start dates into one object, then compare win rate before and after activation for one pilot segment. No new mart: reuse existing syncs, run a two-week baseline, and only automate once the pilot's fill rate and lift are proven.
A concrete scenario that frames the problem
Picture a 40-rep enterprise segment selling three-year ramp contracts — year one at 60% of target ACV, scaling to 100% by year three. Marketing ops runs lead nurture and expansion campaigns through Marketo; sales runs the deal cycle in Dynamics 365. Leadership just enabled Palantir Foundry to unify pipeline visibility, and the CRO wants proof it moved win rate — not a vendor promise, an actual number. The RevOps team's first instinct is often to spin up a dedicated reporting warehouse: pull Dynamics 365 exports, Marketo activity logs, and Foundry outputs into a new BI schema so analysts can slice everything freely. That instinct is exactly the trap. A shadow data mart duplicates fields that already sync into Foundry, creates a second source of truth that drifts from CRM reality within a quarter, and adds an ETL pipeline someone has to babysit forever. The better path treats Foundry's own Ontology as the single canonical join layer: opportunity, quote, contract, and campaign-membership objects already land there through existing connectors. The job isn't to build new infrastructure — it's to wire a report on top of infrastructure that already exists, scoped to one pilot pod, so the before/after comparison is clean and auditable without inventing a parallel data store that outlives its usefulness.
How the mechanism actually works
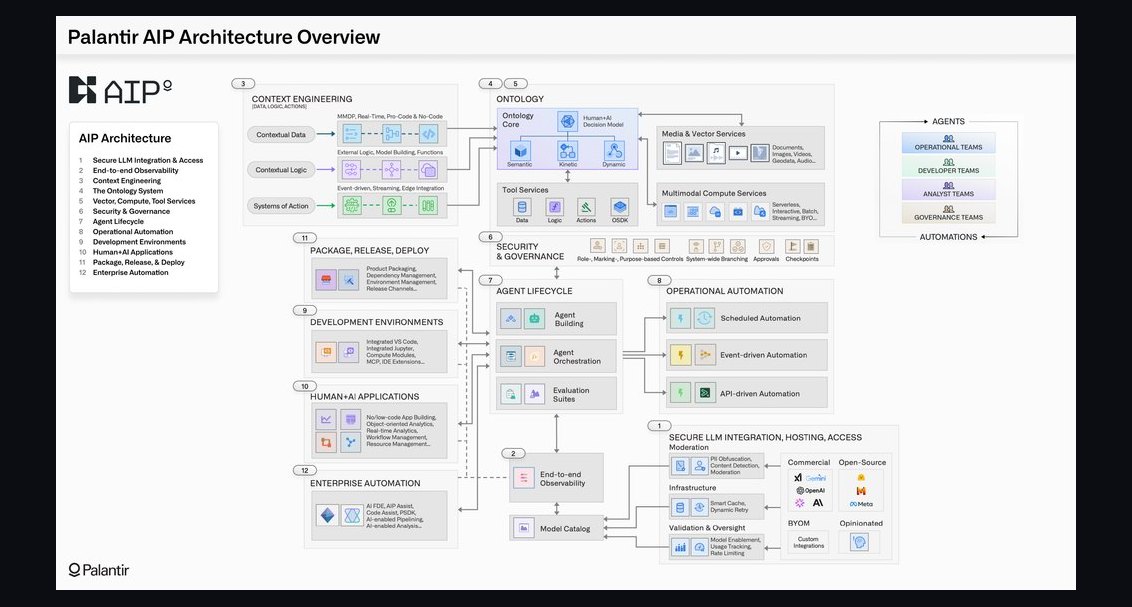
Foundry's Ontology layer lets you define a single object type that references Dynamics 365 opportunity records, their associated Marketo campaign membership, and contract metadata (ramp length, start date, ACV schedule) without copying any of that data into a new physical table — it's a semantic join over existing synced sources. Once that object type exists, you build a Workshop application or report on top of it that filters by contract ramp length and plots win rate over time, with a marker at the date Foundry access was turned on for the pilot pod. The mechanism that makes this trustworthy is that every field traces back to its system of record: opportunity stage and close date come from Dynamics 365, engagement scoring and campaign touches come from Marketo, and neither gets rewritten or duplicated — Foundry just references them. This matters for auditability: when a stakeholder asks "where did this number come from," the answer is a lineage graph back to the CRM record, not a stale export sitting in a spreadsheet. The rollout sequence is: (1) identify the ontology objects for opportunity, quote, contract, and campaign membership, (2) confirm they're already synced from Dynamics 365 and Marketo — most teams find they are, since Foundry connectors typically run nightly or near-real-time, (3) build the join as a single Ontology object type, (4) layer a Workshop report on top scoped to the pilot segment, (5) run it for two weeks against a hand-documented baseline before turning on any automation like routing or alerting.

Real numbers, ranges, and benchmarks
Set concrete thresholds before you start, or the pilot becomes a subjective argument later. A two-week manual baseline is the minimum window to avoid noise from a handful of deals swinging the percentage — for a 40-rep pod closing roughly 15-25 opportunities a month, two weeks typically yields enough sample size to read a directional signal, though a full 90-day window is what most teams use for the statistically defensible number they present to the board. On the Marketo side, if you run a controlled split — half the ramp-contract leads on your standard nurture sequence, half on a Foundry-informed sequence using its lead scoring — expect a measurable lift in the 5-15% range for comparable B2B teams over a 90-day comparison; treat anything below 3% as noise unless your sample is large enough to be confident. On the Workshop report itself, organizations that build a single before/after view segmented by ramp length commonly see a 3-8% win-rate improvement within six months of Foundry activation for teams that actually adopt the workflow suggestions the tool surfaces — the gap between "licensed Foundry" and "adopted Foundry's suggestions" is usually where the real variance lives. Required-field fill rate is your leading indicator, not win rate itself: don't automate anything until fill rate on the fields feeding your report clears 80% for two consecutive weeks in the pilot segment. If fill rate is below that, your win-rate number is measuring data quality, not Foundry's impact. Track duplicate or routing-error queue depth week over week as a secondary signal — a shadow mart problem often shows up first as duplicate records because two systems are writing conflicting versions of the same opportunity.
Trade-offs and alternatives
The core trade-off is speed versus governance. A shadow data mart is faster to stand up in the short term — an analyst with warehouse access can join tables in an afternoon — but it creates a second source of truth that RevOps then has to reconcile against Dynamics 365 and Marketo forever, and it typically isn't covered by the same data-governance and security review that the sanctioned Foundry Ontology already passed. The Ontology-first approach is slower to configure initially — you're working within existing connectors and object permissions rather than free-form SQL — but it inherits governance, lineage, and access control for free, and it doesn't need IT to bless a new pipeline. A second trade-off sits inside the Marketo A/B test alternative: running a controlled experiment gives you causal evidence, which is the strongest kind of proof, but it requires holding out a control group from the "better" sequence for 90 days, which some sales leaders resist because it feels like deliberately underserving half the pipeline. The Workshop report alternative avoids that objection — nobody's pipeline is held back — but it only gives you correlational evidence: win rate moved after Foundry activation, but you can't fully rule out that a market shift or a comp-plan change moved it too. The pragmatic answer most RevOps teams land on is to run both in sequence: the Workshop before/after report as the fast, low-friction first pass, and the Marketo split test as the rigorous follow-up if leadership pushes back on causality. Either way, the alternative to avoid is building bespoke infrastructure before you've proven the fix works with tools you already pay for — that's the same mistake as automating a broken manual process and being surprised the underlying gap persists.
Common pitfalls and how to avoid them
The most common pitfall is skipping the baseline and jumping straight to "Foundry improved win rate by X%" without a documented before-period — without that, any number you present is an assertion, not proof, and the first skeptical VP in the room will ask what it's compared against. Fix this by exporting or screenshotting the pilot segment's win rate for the two weeks immediately before Foundry activation, on the exact same report definition you'll use afterward. A second pitfall is scoping the report to the whole org instead of one pod; a company-wide rollout mixes teams with different ramp-contract structures, different Marketo touch cadences, and different rep tenure, so any lift or dip gets diluted or confounded. Pilot on one segment for two to four weeks first. A third pitfall is letting the Marketo and Dynamics 365 field definitions drift — if marketing ops changes what counts as a "qualified" campaign touch halfway through your measurement window, your before/after comparison breaks silently. Lock field definitions for the duration of the pilot and document them alongside the report. A fourth pitfall, and the one that most directly recreates the shadow-mart problem you're trying to avoid, is letting an eager analyst "just export it to Excel for flexibility" — once contract and campaign data live in a spreadsheet, that spreadsheet becomes the thing people trust, and it stops updating the moment the analyst moves to another project. Keep the report living inside Foundry's Workshop, share the URL, and resist ad hoc exports. Finally, teams often try to prove causality with a correlational report alone; if leadership specifically asks "how do you know it wasn't something else," be ready to point to the controlled Marketo split test as the fallback evidence rather than overselling the Workshop report's before/after view as definitive.

Related questions
Can Foundry's Ontology replace our BI warehouse entirely?
Not usually — Foundry's Ontology is strongest as the semantic join layer over operational systems like Dynamics 365 and Marketo. Most teams still keep a warehouse for finance and long-horizon historical analytics; the point is avoiding a *redundant* mart for this specific win-rate question, not replacing every downstream system.
How do we handle ramp contracts that renew mid-measurement window?
Anchor the measurement to the original contract start date, not the renewal date, so a renewal doesn't reset your ramp-length bucket. Flag renewals as a separate cohort in the Workshop report if volume justifies it.
What if Dynamics 365 and Marketo disagree on which campaign touched a deal?
Trust Marketo's campaign-membership object as the source for touch attribution and Dynamics 365 as the source for stage and close data — don't let either system overwrite the other's field; the Ontology join should reference each field from its own system of record.
Does this approach work if marketing ops is on a different platform than Marketo?
Yes — the mechanism generalizes to any marketing automation platform with a Foundry connector; swap the Marketo campaign-membership object for the equivalent object in your platform and the Ontology join logic stays the same.
FAQ
Do we need a data engineer to set up the Ontology object? Not necessarily for the pilot. Most Foundry deployments come with the Dynamics 365 and Marketo connectors already configured by whoever onboarded the platform; RevOps or an analyst with Ontology edit access can typically build the join and Workshop report without new engineering work, though IT should review before automation goes live.
How is this different from just running a report inside Dynamics 365 directly? A native Dynamics 365 report can't easily incorporate Marketo engagement data or Foundry's lead scoring in the same view. The Ontology join is what lets you see win rate segmented by both CRM stage data and marketing engagement without manually reconciling two exports.
What counts as "activation date" if we rolled out Foundry gradually? Use the date the pilot pod specifically got access and started using it in their workflow, not the org-wide contract signature date. The before/after comparison only holds if the marker matches when behavior actually changed for that segment.
Should finance be involved in this measurement? Yes, once you have a result. Finance should confirm the win-rate formula and booking rules didn't change during your measurement window — a comp-plan or booking-definition change during the pilot would confound your before/after comparison.
What if win rate doesn't move at all? That's a legitimate outcome and useful information — it tells you Foundry access alone isn't the lever, and you should look at adoption of its workflow suggestions specifically, or investigate other variables like lead quality or rep coaching, rather than concluding the tool has no value.
Can we reuse this same Ontology object for other ramp-contract segments later? Yes — that's the point of building it inside Foundry instead of a one-off mart. Once the object type exists, extending the Workshop report to a second or third pod is a filter change, not a new data pipeline.
Sources
- https://www.gartner.com/en/marketing/glossary/data-mart
- https://www.palantir.com/docs/foundry
- https://learn.microsoft.com/en-us/dynamics365/
- https://experienceleague.adobe.com/en/docs/marketo
- https://www.forrester.com/research/
- https://hbr.org/topic/analytics
- https://www.salesforce.com/resources/articles/win-rate/
- https://www.mckinsey.com/capabilities/growth-marketing-and-sales
Related on PULSE
- How do you prove Palantir-driven forecast simulations improved win rate without creating a new shadow data mart for partner-sourced pipeline teams on Dynamics 365 when marketing ops on Marketo?
- How do you prove Palantir pipeline digital twins improved win rate without creating a new shadow data mart for multi-year ramp contracts teams on Zoho CRM when post-merger CRM merge?
- How do you prove Palantir Signals for GTM alerts improved win rate without creating a new shadow data mart for consumption ramp deals teams on Salesforce when no dedicated RevOps hire yet?
- How do you prove Palantir AIP improved win rate without creating a new shadow data mart for consumption ramp deals teams on Pipedrive when legacy CPQ still in place?
- How do you prove Palantir Foundry improved win rate without creating a new shadow data mart for enterprise outbound teams on Dynamics 365 when consumption pricing with minimum commits?
- How do you use Palantir AIP to measure stage inflation without buyer evidence in Dynamics 365 during channel co-sell when marketing ops on Marketo?
This page will be disappearing soon. Save it to your device for $1 — or read it free while it is here.
@Kory-White- · if Venmo asks, the last 4 of my number are 2012
This page is gone.
This one is off the shelf now. $1 keeps it on your phone for good — the whole page, pictures and diagrams included.
 revopsHow do you prove Palantir Foundry improved win rate without creating a new shadow data mart for enterprise outbound teams on Dynamics 365 when consumption pricing with minimum commits in 2027?
 revopsHow do you prove Palantir Foundry improved win rate without creating a new shadow data mart for usage-based pricing teams on Pipedrive when data warehouse in Snowflake in 2027?
 revopsHow do you prove Palantir Foundry improved win rate without creating a new shadow data mart for inbound SDR teams on Salesforce when SDRs on Outreach in 2027?
 revopsHow do you prove Palantir Foundry improved win rate without creating a new shadow data mart for BDR-to-AE split teams on HubSpot when AEs refuse new required fields in 2027?
 revopsHow do you prove Palantir Foundry improved win rate without creating a new shadow data mart for services-led sales teams on Zoho CRM when post-merger CRM merge in 2027?
 revopsHow do you use Palantir Ontology to automate ramp quotas on new hires in Dynamics 365 during usage-based pricing when consumption pricing with minimum commits in 2027?
 revopsHow do you prove Palantir AIP improved win rate without creating a new shadow data mart for AE-led pods teams on Dynamics 365 when founder still owns largest accounts in 2027?
 revopsHow do you use Palantir AIP to measure stage inflation without buyer evidence in Dynamics 365 during channel co-sell when marketing ops on Marketo in 2027?
 revopsHow do you use Palantir pipeline digital twins to alert on stage inflation without buyer evidence in Dynamics 365 during consumption ramp deals when founder still owns largest accounts in 2027?
 revopsHow do you use Palantir-driven forecast simulations to dedupe ramp quotas on new hires in Dynamics 365 during BDR-to-AE split when consumption pricing with minimum commits in 2027?