


ARR vs MRR vs bookings vs revenue — what's the actual difference?
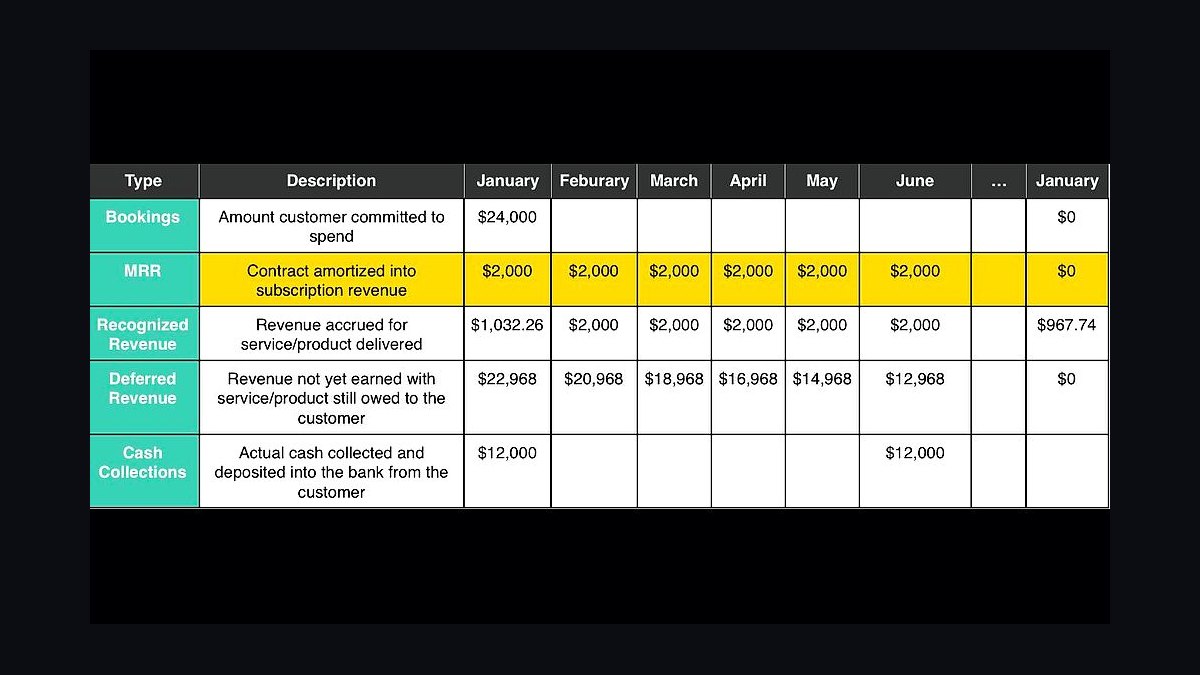
Bookings, billings, revenue, and ARR/MRR measure four different moments in the same contract. Bookings count total contract value the day you sign. Billings count what you've invoiced. Revenue, under ASC 606, counts what you've actually earned by delivering service. ARR and MRR are run-rate snapshots of recurring contract value right now, annualized. They diverge whenever contract length, payment terms, and service delivery don't line up — which on B2B SaaS deals is almost always.
TL;DR
- Bookings = signed TCV in the period. Forward-looking, sales currency.
- Billings = invoiced amount in the period. Cash-flow currency.
- Revenue = ASC 606 GAAP-earned amount, recognized ratably as service is delivered.
- ARR / MRR = current annualized recurring run-rate, not GAAP, not period-bound.
- A $5M three-year deal can show as $5M bookings, $1.67M billings, $1.67M revenue, and +$1.67M ARR in the same quarter — five different "right" numbers.
The 5 Definitions (with one worked $5M multi-year example)
A $50M-ARR SaaS company closes a $5M three-year contract in Q2, paid annually in advance at $1.67M/year. Here is what each metric does on the books.

Bookings. Day of countersignature, $5M lands in Q2 bookings. Bookings = TCV signed in the period, often split into new, renewal, and expansion. Forward-looking, not GAAP. They mirror sales activity because they capture full customer commitment regardless of billing or recognition timing.

Billings. When the first $1.67M invoice goes out, Q2 billings = $1.67M. The remaining $3.33M bills in Years 2 and 3. Billings drive cash and working capital. Investors often compute "calculated billings" as revenue plus change in deferred revenue — a proxy for forward demand when bookings aren't published.
Revenue. Under ASC 606, the performance obligation (SaaS access) is satisfied ratably over 36 months. So $5M / 36 ≈ $139K per month of GAAP revenue. Year 1 revenue = $1.67M. CFO and auditors care above all because it lives in the audited financials.

ARR. Annualized contractual run-rate of recurring revenue rises by $1.67M — ARR annualizes the per-year recurring commitment, not TCV. Company ARR moves from $50M to $51.67M even though sales just booked $5M. Biggest source of confusion at SaaS boards: bookings $5M, ARR delta $1.67M, "where's the other $3.33M?" It sits in committed-but-not-yet-active ARR for Years 2 and 3.
MRR. Same thing monthly. MRR rises $139K. ARR is MRR × 12 in most operating models, though pure annual-subscription businesses sometimes report ARR straight from annual contracts.

Deferred revenue. Balance-sheet liability = billings received minus revenue recognized. After Q2, deferred revenue sits at $1.67M billed minus $417K recognized = $1.25M owed back as future service. Burns down $139K monthly until the next annual invoice refills it.
When Each Number Lies + Who Uses Which
No single metric tells the whole truth. Each is optimized for a different audience and breaks under specific conditions:

| Audience | Primary metric | Why they trust it | Where it lies |
|---|---|---|---|
| CFO | GAAP Revenue | Audited, defensible, comparable | Lags reality by the contract term; ignores forward demand |
| Board | ARR + Net New ARR | Best growth signal for recurring businesses | Excludes one-time, PS, and usage revenue |
| Sales | Bookings | Closest to compensable activity | Inflated by multi-year deals that may churn |
| Investors | ARR run-rate | Predicts next 12 months of revenue | Misleading on usage-based or ramp deals |
| Auditors | Revenue + Deferred Revenue | ASC 606 compliance, balance sheet integrity | Doesn't capture pipeline or velocity |
The standard board page puts all five together: ARR (growth), Net New ARR (sales productivity), Bookings (forward demand), GAAP Revenue (audit story), Deferred Revenue (cash runway). When any two diverge meaningfully, CRO and CFO walk through why — usually multi-year renewals, prepaid annual swings, or a chunky non-recurring services deal.
The 3 Traps That Trip Up Founders

Trap 1: Confusing bookings with revenue. A founder closes a $1M three-year deal, tells investors "we did $1M in revenue this month," then gets corrected at the board meeting when revenue shows as $28K. Bookings is sales currency, revenue is finance currency. Wrong one in the wrong room destroys credibility.

Trap 2: Treating ARR like GAAP revenue. ARR ignores professional services, implementation fees, one-time setup, and usage overages. A company with $10M ARR and $4M services is not a $10M revenue company — it's $14M total with $10M recurring. Confusing the two breaks forecasts and unit economics.
Trap 3: Ignoring deferred revenue as a leading indicator. Deferred revenue is "good debt" — already-collected cash owed as future service. A growing balance means billings outpace recognition, a sign of strong upfront annual contracts. A shrinking balance in a growth period is a yellow flag: billing shifted monthly, or sales slowed and prior cohorts burn faster than new bookings refill them.
Related on PULSE
- What is the difference between ARR and MRR for a SaaS business?
- What's the relationship between CAC, MRR, and sales cycle length, and how do you optimize the trade-off?
- RevOps vs Sales Ops: what's the actual difference?
- MQL vs SQL — what's the actual difference, and how should you define them?
- What's the right way to measure an enablement function's actual impact on revenue versus just course-completion rates?
- What's the founder's role in setting the actual discount-policy numbers vs delegating to the CRO — and what happens when the CRO and founder disagree on risk tolerance?
Why Startups Misreport These Metrics (and How It Hurts Fundraising)
Founders often conflate bookings with revenue when pitching investors, creating a dangerous credibility gap. A $500K annual contract signed in December might show as $500K in bookings, but under ASC 606, you can only recognize revenue as you deliver service — typically $41.7K per month. If you report that $500K as "revenue" in a board deck, an experienced investor will immediately spot the mismatch. This misalignment is especially common during end-of-quarter pushes when sales teams close large deals that won't start delivering until next quarter. The gap between bookings and recognized revenue can stretch 6-12 months for implementation-heavy SaaS products.
The practical impact: overstating revenue inflates your gross margin calculations, making your unit economics look healthier than they actually are. A startup showing 85% gross margins based on booked revenue might actually operate at 60% when you factor in implementation costs spread across the contract term. Investors who dig deeper will adjust your metrics downward, potentially reducing your valuation by 1-2x ARR multiples. Conversely, underreporting by treating all bookings as deferred revenue when some should be recognized upfront (like setup fees) leaves money on the table and makes growth look slower than reality.
The fix is straightforward: maintain separate tracking systems for bookings, billings, and revenue. Use bookings for sales compensation and pipeline reporting, billings for cash flow forecasting, and revenue for P&L statements. When fundraising, clearly label each metric in your data room — investors appreciate transparency more than inflated numbers.
How Contract Length and Payment Terms Create ARR/MRR Distortions
ARR and MRR calculations assume perfect monthly recurring revenue, but real-world contracts rarely cooperate. Consider a customer who signs a 2-year contract at $24K total but pays annually upfront. Your MRR calculation might show $1K ($24K/24 months), yet your bank account received $24K on day one. This creates a cash-rich but ARR-poor situation that masks true recurring revenue health. Conversely, a monthly $2K subscription with no annual commitment shows $2K MRR and $24K ARR, but carries zero retention guarantee — one cancellation and that revenue vanishes.
The distortion deepens with multi-year contracts that include annual escalators. A 3-year deal starting at $10K/month with 5% annual increases shows $10K MRR in year one, but actual monthly revenue in year three will be $11,025. Standard ARR calculations ignore this growth, understating the contract's true lifetime value by 10-15%. Similarly, contracts with usage-based components (like API calls or storage) create fluctuating MRR that can swing 20-40% month-over-month, making ARR a moving target that requires trailing averages to stabilize.
For accurate reporting, segment your ARR by contract type: committed ARR (multi-year with penalties), annual ARR (12-month contracts), and monthly ARR (30-day terms). Track average contract length and payment frequency separately — a company with 70% annual contracts and 30% monthly will have very different cash flow dynamics than one with the opposite mix. Use weighted average contract term (WACT) to normalize comparisons, calculated as (sum of contract values × contract months) / total contract value. This gives you a single number that accounts for both value and duration, making your ARR/MRR comparisons more meaningful across customer cohorts.
The Hidden Impact of Churn and Expansion on These Metrics
Bookings and revenue tell opposite stories about churn. A $100K booking from a new customer is immediately visible in your bookings report, but that same customer might churn after 6 months, leaving only $50K in recognized revenue. Meanwhile, a $10K expansion from an existing customer (upsell or cross-sell) adds to bookings but might take 12 months to fully recognize. The net effect: your bookings report can show 30% growth while revenue only grows 15%, creating a phantom growth gap that fools founders into thinking they're scaling faster than they actually are.
This gap becomes critical during fundraising. Investors calculate net dollar retention (NDR) by comparing revenue from existing customers year-over-year, including expansions minus churn. If your bookings are growing but NDR is below 100%, you're essentially running on a treadmill — new customers replace churned ones without building a compounding base. A startup with $5M ARR and 90% NDR needs to acquire $500K in new ARR just to stay flat, while one with 120% NDR can grow without any new sales. This makes NDR a more reliable health indicator than raw bookings or revenue growth.
The practical solution: track cohort-based retention curves alongside your aggregate metrics. Create monthly cohorts of new bookings and measure how much of that value converts to revenue over 12 months. For example, a cohort with $100K in bookings might show $85K in recognized revenue after year one due to churn, cancellations, or implementation delays. Plot these curves for the past 24 months to see if your revenue conversion rate is improving or declining. If you see a downward trend, investigate whether sales is over-promising features that lead to early churn, or if your onboarding process is failing to convert booked deals into active users. This cohort view bridges the gap between the optimism of bookings and the reality of revenue, giving you actionable data to improve both your sales process and customer success efforts.
FAQ
What’s the simplest way to tell ARR from MRR? ARR is just MRR multiplied by 12, but they’re used differently. MRR shows your monthly recurring revenue trend, while ARR annualizes that for longer-term planning. Both exclude one-time fees.
Why would bookings be higher than revenue in a given quarter? Because bookings capture the full contract value at signing, while revenue only recognizes what’s been delivered. A multi-year deal signed in Q1 might show $120K in bookings but only $10K in revenue that quarter if service is delivered monthly.
Do billings ever equal revenue? Only if you invoice exactly as you deliver service with no prepayment or arrears. In practice, annual prepayments make billings spike upfront, while revenue spreads across the year. They rarely match month-to-month.
Can MRR go down while bookings go up? Yes, if you’re signing large annual contracts but losing monthly subscribers. Bookings might rise from the new deals, but MRR could drop if churn exceeds the monthly value of those new contracts.
Is there a standard rule for when to use ARR vs revenue for investors? Investors typically look at ARR for growth rate comparisons and revenue for GAAP compliance. ARR smooths out timing differences, while revenue shows actual recognized earnings. Both matter, but for different audiences.
What’s the biggest mistake founders make with these metrics? Treating bookings as cash in the bank. A $100K booking doesn’t mean $100K is available — it’s a contract that may be paid over time. Founders often overspend based on bookings, then face cash crunches when revenue recognition lags.
Sources
- FASB ASC 606 — *Revenue from Contracts with Customers* (official standard text)
- KPMG — *Revenue for software and SaaS: ASC 606 Handbook* (2024 edition)
- PwC — *Revenue from contracts with customers: Software and SaaS industry supplement*
- Bessemer Venture Partners — *State of the Cloud 2025* (ARR definitions and benchmarks)
- ICONIQ Growth — *Topline Operating Metrics for B2B SaaS* (bookings, ARR, billings disclosure norms)
- OpenView Partners — *SaaS Benchmarks Report* (ARR vs revenue comparability)
- Meritech Capital — *Public SaaS Comp Sheet methodology* (calculated billings and implied ARR)
- a16z — *16 Startup Metrics* (Andreessen, Jordan — definitions of bookings vs revenue vs ARR)
This page will be disappearing soon. Save it to your device for $1 — or read it free while it is here.
@Kory-White- · if Venmo asks, the last 4 of my number are 2012
This page is gone.
This one is off the shelf now. $1 keeps it on your phone for good — the whole page, pictures and diagrams included.
 revopsWhat is lemlist and why is it a hot RevOps multichannel outreach platform for 2027?
 revopsWhat are Tennessee Volunteers men's basketball's 2027 NIL needs and strategy?
 revopsHow do you build a buyer persona that sales actually uses in 2027?
 revopsWhat are Kansas Jayhawks men's basketball's 2027 NIL needs and strategy?
 revopsWhat capacity-planning models do SaaS sales teams use in 2027?
 revopsWhat is the product-led-sales (PLS) playbook in 2027?
 revopsHow do you build a peer-coaching library that AEs actually use in 2027?
 revopsHow should a 2027 RevOps team build an ICP scoring rubric?
 revopsHow should a 2027 CRO and CEO align before a board meeting?
 revopsWhen should a 2027 acquirer unify GTM motions vs keep them separate?