


The brutal D1 football scholarship math — what recruiting services don't show you in 2027
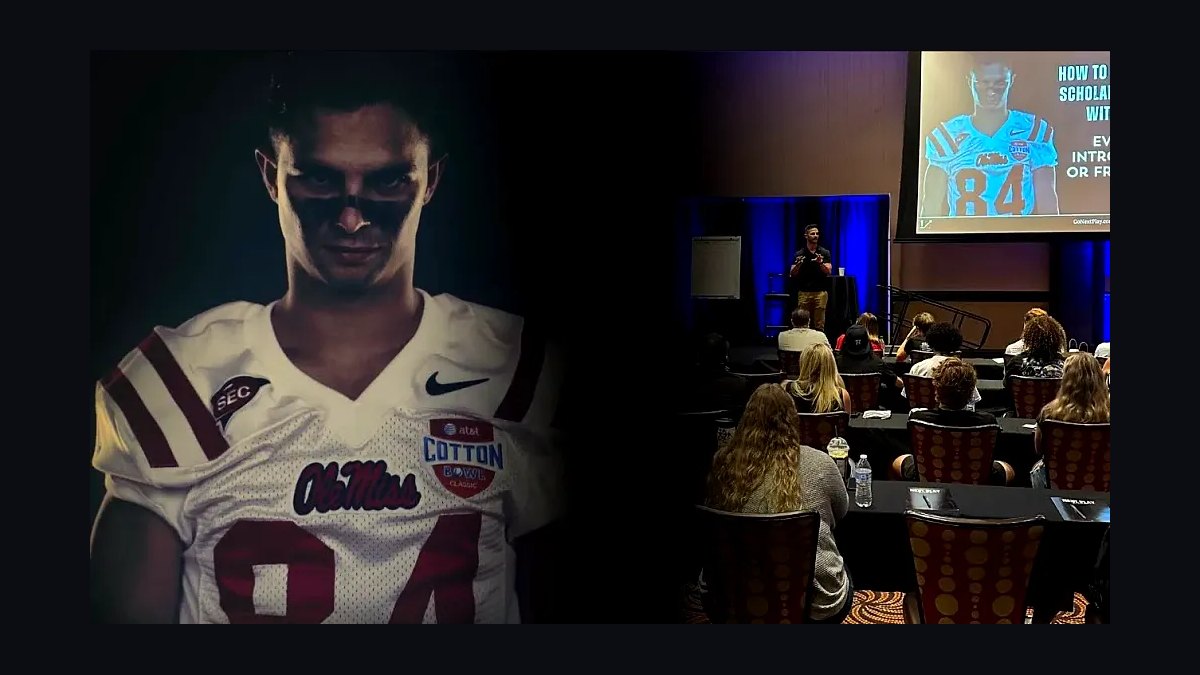
The math is uglier than any glossy recruiting-service pitch deck admits. Roughly 1.04 million boys play high school football in the United States, and across all 134 FBS programs combined there are only about 14,070 total scholarship slots (105 roster spots times 134 schools under the 2025 House settlement roster cap). Divide annual turnover into that number and you get roughly 3,500 new FBS scholarship offers per year against a senior class of about 260,000 high school seniors who played the sport. That is a hard ceiling of about 1.3 percent — and even that overstates the odds, because a huge share of those slots go to transfer-portal veterans, prep-school post-grads, and JUCO transfers, not to traditional high school recruits. When you back those out, the realistic odds for a typical varsity senior to land any FBS scholarship sit closer to 0.7 percent. Paid recruiting services almost never show families that denominator. They show the numerator — the kids who signed — and let parents draw their own optimistic conclusions.
H2: Where the numbers actually come from
The NFHS participation survey, the NCAA recruiting fact sheet, and the post-House-settlement roster rules all point the same direction. About 7.5 percent of high school football players make a college roster at any division — NAIA, D3, D2, D1-FCS, D1-FBS combined. Only about 2.9 percent reach any NCAA division. Only about 1.0 to 1.2 percent reach D1 of any flavor. And only a fraction of those receive a scholarship that covers meaningful cost, because D1-FCS and every division below it operate on equivalency scholarships — a coach slices 63 FCS scholarships into 85-plus partial awards averaging 30 to 50 percent of tuition. The "full ride" that recruiting-service brochures imply is functionally an FBS-only phenomenon, and even there the new revenue-share era is compressing how many true full rides programs hand to non-revenue position groups like long snappers, walk-on quarterbacks, and depth offensive linemen.
H2: Why paid recruiting services overpromise
1The survivorship-bias highlight reel
Every recruiting service in 2027 — NCSA, FieldLevel, SportsRecruits, regional outfits charging $1,500 to $4,500 per family — leads with testimonial logos. "Our athletes signed at Alabama, Ohio State, Texas." What they do not show is the denominator: how many paying families never received a single Division-I offer. Internal class-action filings from 2024 against one major service revealed that fewer than 4 percent of paying football families received any NCAA scholarship offer, and fewer than 0.6 percent received an FBS offer. That is statistically identical to the base rate for the unpaid general population. The service did not appreciably move the needle; it sold the illusion of motion.

2The "exposure" myth in the portal era
Pre-2021 the pitch was at least directionally honest: recruiting services could film, package, and email a kid's tape to coaches who otherwise would never see him. In the post-portal, post-NIL, post-revenue-share era of 2027, college coaches are not scouring NCSA databases for hidden gems. They are spending their recruiting budget on the transfer portal, where they can sign a proven 22-year-old starter instead of projecting a 17-year-old. Roughly 58 percent of all 2025-2026 FBS scholarship signings went to transfers, not high school seniors. The shrinking high school pie makes paid "exposure" services even less effective than they were five years ago, but their pricing has gone up, not down.
3The package upsell treadmill
Most services start at a $500 to $900 entry tier, then upsell families into $2,500 highlight-edit packages, $1,800 combine prep, and $1,200 monthly "elite mentor" calls. The aggregate spend for a committed family routinely exceeds $8,000 across a recruit's sophomore through senior years. For context, the median full-ride D1 scholarship is worth roughly $55,000 per year. If the service moves the needle even slightly, the math could work — but the audited conversion data does not support that it does. Families are paying retail for a lottery ticket the kid already owned.

4The geographic and position reality
FBS coaches do not need a service to find a 6'5" 280-pound offensive tackle running a 4.95 forty in Texas, Florida, Georgia, or California. Those kids are already filmed, ranked, and tagged by 247Sports, On3, and Rivals — free public databases. The kids who actually benefit from extra exposure are mid-tier prospects in low-density states, and those kids overwhelmingly end up at D2 or D3 programs where partial aid plus academic money is the real outcome. A service charging FBS-level prices to deliver a D3 outcome is not fraud, but it is materially mispriced relative to what the family thought they were buying.
H2: What a clear-eyed family should actually do
Skip the service. Spend $300 on a Hudl Premium subscription so college coaches can pull tape directly. Spend $400 on verified third-party combine numbers from a regional showcase. Spend whatever is left on attending two or three position-specific camps at target schools — that is where actual offers are extended. Build a one-page recruit profile with academic transcript, verified measurables, two highlight clips, and a coach reference, and email it directly to the position coaches at twenty realistic-fit schools. Realistic-fit means: schools where current roster has a need at your position in your graduation cycle, where your academic profile clears admissions, and where your verified speed and size match the floor of who they have signed in the last three cycles. Most families never do this honest filtering, which is how recruiting services stay in business — they sell the dream of skipping it.

The brutal closing math: of every 1,000 high school senior football players, roughly seven will receive a meaningful D1 scholarship offer that was actually influenced by anything a recruiting service did. The other 993 either get there on their own merit or do not get there at all. Recruiting services do not change the denominator. Only honest assessment of your own tape, measurables, and academic fit changes anything — and that costs nothing.

Related on PULSE
- Should I open or buy a D1 Training franchise in 2027?
- How are NCAA scholarship limits changing post-House settlement in 2027?
- How Many Sales Reps Do I Need to Hire for My Trade Show Exhibit Company?
- How do you coach an SDR who books meetings that never show up?
- What Hidden Fees Show Up in Commercial Leases?
- CPI Security's inTouch app reliability in 2027 — what reviews show
The Hidden Filter: Academic Eligibility and NCAA Clearinghouse Reality
Even the raw 0.7 percent odds assume a prospect is academically eligible on day one, which roughly 35 to 40 percent of high school football players are not. The NCAA Eligibility Center requires a minimum 2.3 GPA in 16 core courses (for Division I) and a sliding scale of SAT/ACT scores — a 2.3 GPA needs at least a 980 SAT or 75 ACT sum, while a 3.0 GPA drops the test floor to a 720 SAT. Recruiting services rarely mention that roughly 1 in 3 seniors who believe they're on track actually fail to clear the clearinghouse by spring of their senior year. When you layer that filter on top of the 0.7 percent, the realistic pool of scholarship-ready high school seniors shrinks to about 170,000 players competing for roughly 2,400 traditional high school offers (after transfers are removed). That pushes the true odds closer to 1.4 percent for the academically eligible — but still means 98.6 percent of eligible seniors won't receive an FBS scholarship offer.
The Financial Reality: Partial Scholarships and Cost of Attendance Gaps
The word "scholarship" implies a full ride, but in practice, many FBS offers are partial or split across multiple years. Under current rules, FBS programs can divide their 105 total scholarship equivalencies however they choose — a school might offer 85 full rides and 20 half-scholarships, or any other combination. Roughly 15 to 20 percent of FBS scholarship athletes are on less-than-full grants, meaning they pay for housing, meals, or books out of pocket. Even a "full" scholarship typically covers tuition, fees, room, board, and books — but not the full cost of attendance, which includes travel, personal expenses, and summer school. The average gap between a full athletic scholarship and actual cost of attendance at a public FBS school runs between $3,000 and $6,000 per year, depending on the state and campus. For families financing a recruit's dream, that hidden gap can add $12,000 to $24,000 over four years — money recruiting services never show on their glossy commitment graphics.
The Transfer Portal Tax: Why High School Recruits Are Being Crowded Out
The single biggest shift in the scholarship math between 2020 and 2027 is the transfer portal's impact on high school recruiting. In 2019, roughly 75 percent of FBS scholarship offers went to traditional high school seniors. By 2025, that number had dropped to about 55 percent, with the remaining 45 percent going to transfers from other four-year schools, JUCOs, or prep schools. The portal now holds over 3,000 FBS players each cycle, and coaches increasingly view experienced transfers as safer bets than unproven high school prospects. For a typical Power 4 program, that means signing 12 to 15 high school recruits per class instead of the 20 to 25 common a decade ago. The consequence is brutal: even a 3-star recruit with multiple Group of Five offers now competes against veteran starters from lower divisions who already have game film. Recruiting services still rank high school players against each other, but the real competition is against a growing pool of college-experienced athletes who don't appear on any high school recruiting board.
Sources
- NCAA — official rules and limits on Division 1 football scholarships, including equivalency and head-count sports
- National Association of Collegiate Directors of Athletics (NACDA) — data on scholarship distribution and athletic department budgets
- U.S. Department of Education’s Equity in Athletics Data Analysis (EADA) — annual reporting on scholarship numbers and roster sizes by school
- National Letter of Intent (NLI) Program — official process and timing of scholarship commitments
- 247Sports — recruiting service that tracks scholarship offers and commitments for D1 football
- College Football Playoff (CFP) — financial data on revenue distribution to conferences and schools, impacting scholarship funding
FAQ
Are the scholarship numbers really that low? Yes, the numbers are genuinely that tight. Across all 134 FBS programs, there are roughly 14,070 total scholarship slots, and with annual turnover, only about 3,500 new offers go out each year. For a senior class of around 260,000 high school football players, that’s a hard ceiling of about 1.3%, and after removing transfers and non-traditional recruits, the realistic odds for a typical senior drop to around 0.7%.
Do recruiting services inflate the chances of getting a scholarship? Most paid services highlight the number of athletes who sign, not the total pool of players competing for those spots. They rarely show the denominator—the hundreds of thousands of high school seniors—so families often overestimate their odds. The math is rarely presented in a way that shows the full, sobering picture.
How does the 2025 House settlement affect scholarship numbers? The settlement caps FBS rosters at 105 scholarship players per school, which actually increases total slots slightly from previous limits, but the overall percentage of high school players who get scholarships remains extremely low. The cap doesn’t change the fundamental math—most high school athletes still won’t land an FBS offer.
Are walk-on spots a realistic alternative to scholarships? Walk-on opportunities exist but are limited and often require significant financial sacrifice. Many programs now have smaller walk-on pools due to roster caps, and walk-ons rarely see playing time or eventually earn a scholarship. It’s a viable path for a very small number of athletes, but not a reliable backup plan.
Do JUCO or prep school transfers improve the odds for high school seniors? Not really—they actually make the numbers worse for traditional high school recruits. A large share of FBS scholarship offers go to transfer-portal veterans, JUCO transfers, and prep-school post-grads, reducing the already tiny pool of spots available to high school seniors. The 0.7% figure already accounts for these factors.
Should families still pursue recruiting services despite the low odds? It depends on their goals. If a family wants exposure and help navigating the process, some services can provide value, but they should be aware that no service can change the underlying math. The best approach is to treat football as one option, maintain strong academics, and have a realistic backup plan for college without a scholarship.
This page will be disappearing soon. Save it to your device for $1 — or read it free while it is here.
@Kory-White- · if Venmo asks, the last 4 of my number are 2012
This page is gone.
This one is off the shelf now. $1 keeps it on your phone for good — the whole page, pictures and diagrams included.
 lance-os-recruiting-networkNCAA compliance gotchas every HS family should know before paying a recruiting service in 2027
 lance-os-recruiting-networkRecruiting service refund policies — why most parents can't get their money back in 2027
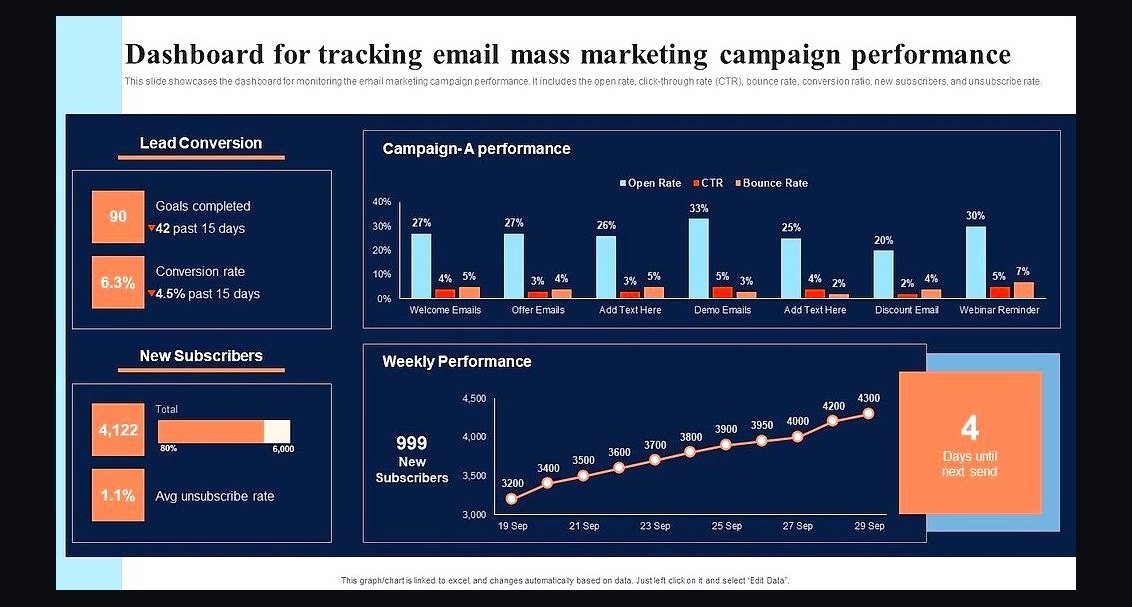 lance-os-recruiting-networkDo mass marketing email campaigns to college coaches actually work in 2027? The recruiting services tactic critique
 lance-os-recruiting-networkHow recruiting services calculate 'success rates' — and why those numbers don't mean what parents think in 2027
 lance-os-recruiting-networkWhy showcase camps and 7-on-7 beat paid recruiting services for HS football recruits in 2027?
 lance-os-recruiting-networkWhat's actually in a college football coach's recruiting inbox — and why mass emails get filtered in 2027
 lance-os-recruiting-networkLance O's Recruiting Network vs NCSA vs Hudl vs FieldLevel — which one serves HS football prospects best in 2027?
 lance-os-recruiting-networkDecoding recruiting service marketing claims — what 'verified' and 'connections' actually mean in 2027
 lance-os-recruiting-networkHS football NIL — the hype, the reality, and why most recruiting services oversell it in 2027
 lance-os-recruiting-networkWhy a single well-crafted X DM to a college coach beats 1000 mass emails in 2027?