


What does the production LLM observability stack look like in 2027?
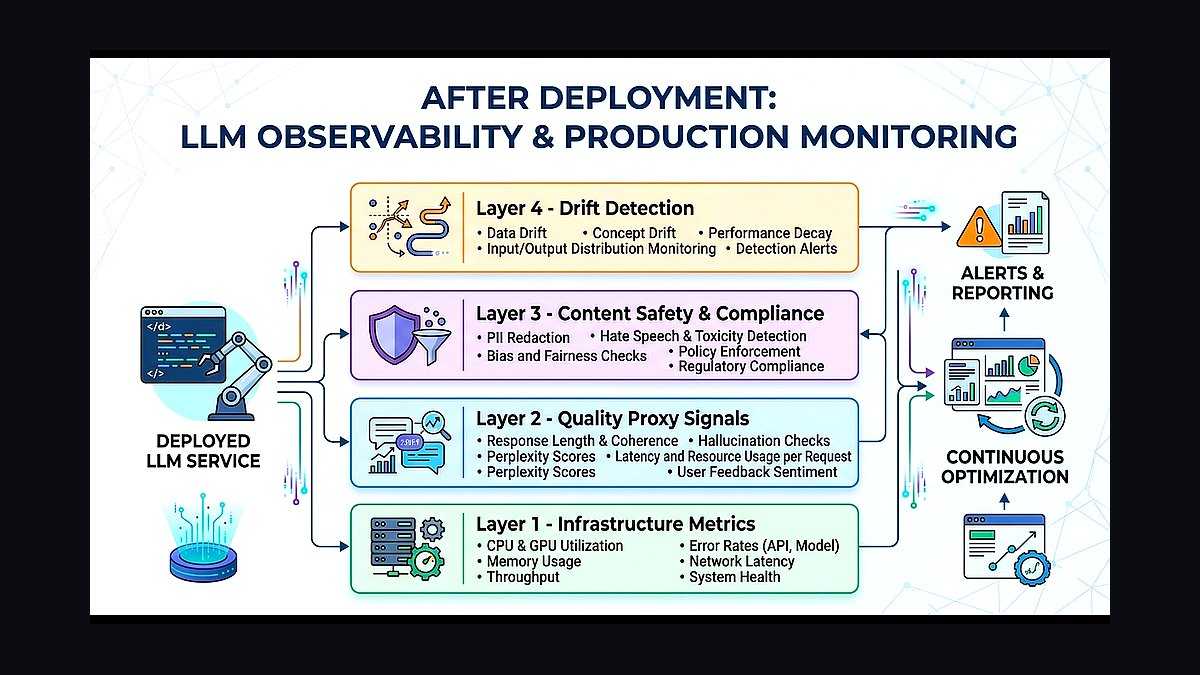
In 2027, the production LLM observability stack is built around four layers: (1) trace capture with LangSmith, Langfuse, Arize Phoenix, or Honeycomb, (2) eval-in-production with Promptfoo, Braintrust, or Helicone, (3) cost and latency monitoring with Datadog, New Relic, or vendor-native dashboards, and (4) drift and quality monitoring with Arize, WhyLabs, or Fiddler. The 2027 default is LangSmith + Braintrust + Datadog + Arize for enterprise — a vendor combo, not a single platform.
1Trace Capture — The Foundation
Every LLM call should generate a trace containing: input prompt, retrieved context, model response, tool calls, latency, token count, cost, error status. Without traces, you cannot debug, evaluate, or optimize.
- LangSmith (LangChain) — best for LangChain stacks; deep integration; ~$0.50/trace at enterprise.
- Langfuse — open-source; self-hostable; growing fast.
- Arize Phoenix — open-source; strong eval and drift detection built-in.
- Honeycomb — generalist observability with LLM extensions for organizations standardizing on Honeycomb.
1.1 Trace Sampling
At >10M calls/month, full tracing becomes expensive. Sample 1–5% baseline + 100% of errors + 100% of high-cost calls. Langfuse has the most flexible sampling.

2Eval-in-Production
Offline evals miss production reality. Eval-in-production runs lightweight evaluation on every (or sampled) live call.
- Braintrust — purpose-built for online eval; LLM-as-judge built-in; ~$2K/month enterprise.
- Promptfoo — open-source; strong CI/CD integration; free + paid managed.
- Helicone — proxy-based; transparent integration.
- LangSmith Evaluators — bundled with LangSmith.
2.1 LLM-as-Judge Pattern
Use a stronger model (Claude Opus 4.7 or GPT-5) to score the production model's outputs against rubrics. Sample 1–5% of production traffic; flag low scores for human review.

3Cost and Latency Monitoring
Cost is the second-largest LLM ops concern after quality. Track per-customer, per-endpoint, per-model cost in real time.
- Datadog LLM Observability — strong if you already run Datadog; ~$500K/year at LLM-heavy scale.
- Helicone — proxy-based cost tracking with detailed analytics.
- Vendor-native dashboards (Anthropic Console, OpenAI Usage, Google Cloud Vertex AI Monitoring) — free but siloed.
- OpenMeter — open-source usage metering for AI vendors.

3.1 Latency Budgeting
Set explicit latency budgets per use case. Streaming responses mask perceived latency. Speculative execution (run two models in parallel, pick the fast one) is the 2027 trick for low-latency requirements.
4Drift and Quality Monitoring
Model behavior drifts as prompts evolve, models update, and user behavior shifts.
- Arize AI — production-grade ML observability with LLM extensions.
- WhyLabs — open-source-friendly drift detection.
- Fiddler — enterprise drift + bias monitoring.

4.1 What to Monitor
- Embedding drift — has the distribution of user query embeddings shifted?
- Response length drift — are outputs getting longer/shorter unexpectedly?
- Tool-call frequency drift — are agents making more or fewer tool calls?
- Safety classifier hit rate — has the rate of flagged outputs changed?
- User feedback signal — thumbs-up/down rates, follow-up rates, escalation rates.
5The 2027 Default Stack
For a typical enterprise LLM deployment ($500K–$5M annual LLM spend):
- LangSmith for trace capture and offline eval.
- Braintrust for eval-in-production with LLM-as-judge.
- Datadog LLM Observability for cost, latency, error tracking.
- Arize AI for drift detection and embedding monitoring.

For cost-sensitive deployments: Langfuse + Promptfoo + Helicone + Phoenix is a fully open-source stack.
The Shift from Metrics to Semantic Observability
By 2027, the most significant evolution in LLM observability is the move beyond traditional metrics-based monitoring to what the industry now calls semantic observability. While 2025-era stacks focused heavily on latency percentiles, token counts, and error rates, the 2027 stack prioritizes understanding *what* the model is actually doing with language — not just how fast or how cheaply it does it.
Semantic observability tools like Arize Phoenix’s “Semantic Drift” module, WhyLabs’ “Language Health” dashboards, and LangSmith’s “Intent Analysis” now run continuously in production. These systems don’t just log raw inputs and outputs; they embed every prompt and response into a semantic vector space, clustering them by topic, sentiment, intent, and even subtle attributes like “persuasion level” or “factual confidence.” When a cluster shifts — say, users suddenly start asking about refund policies in a way that sounds frustrated rather than neutral — the observability stack surfaces that change as a semantic anomaly, not just a spike in error codes.

The practical impact is huge. Teams in 2027 no longer scramble to read thousands of logs to understand why a model started hallucinating. Instead, they see a heatmap overlay on their semantic clusters showing that the “technical support” cluster drifted 12 degrees in embedding space over the last hour, correlating with a new deployment of a fine-tuned model. The observability stack automatically flags the drift, links it to the deployment, and even suggests reverting the change — all without a human needing to read a single response.
This shift is powered by on-device embedding generation (using models like Gemma-3-Embed or Llama-3-Embed, which run at under 5ms on modern GPUs) and real-time vector databases like Pinecone Serverless or Weaviate Cloud that index embeddings at production scale. Costs for this are now in the range of $0.0001–$0.0005 per embedding generation, making semantic observability affordable even for high-throughput applications processing millions of requests daily.
For teams building in 2027, the standard stack now includes a semantic observability layer as a first-class citizen, often integrated directly into the trace capture tools. LangSmith’s “Semantic Traces” mode, for example, automatically attaches embedding vectors to every span, while Arize Phoenix’s “Semantic Explorer” lets teams query by meaning rather than by regex. This is not optional — it’s the new baseline for any production LLM system with more than 10,000 daily users.

The Rise of Agentic Observability and Multi-Step Reasoning Tracing
The second major shift in the 2027 LLM observability stack is the emergence of agentic observability — purpose-built tooling for monitoring LLM agents that chain multiple tool calls, memory accesses, and reasoning steps into complex workflows. By 2027, the majority of production LLM deployments are no longer simple Q&A bots; they are autonomous agents handling tasks like customer support triage, code generation pipelines, or multi-step data analysis. Traditional trace capture tools from 2025 were not designed for this — they could show you a single LLM call, but not the branching tree of decisions an agent makes.
The 2027 agentic observability layer, exemplified by tools like LangSmith’s “Agent Traces”, Braintrust’s “Reasoning Graph”, and Helicone’s “Agent Flow”, now captures the full reasoning graph of an agent’s execution. This includes every tool call (e.g., database queries, API calls, file reads), every memory retrieval (from vector stores or key-value caches), and every intermediate reasoning step (the “thought” tokens the model generates before acting). These traces are visualized as interactive graphs, not linear spans, allowing engineers to zoom into a specific branch where the agent made a wrong decision.
Critical to this is the concept of “reasoning token budgets” — a new metric that didn’t exist in 2025. In 2027, teams monitor not just total tokens used, but how many tokens were spent on reasoning versus action. If an agent uses 80% of its budget on internal reasoning and only 20% on actual tool calls, that’s a red flag — it’s overthinking. Observability tools now surface this ratio automatically, with alerts triggering when the reasoning-to-action ratio exceeds a configurable threshold (commonly set at 70:30 for most production agents).

Another key feature is agentic replay — the ability to re-run an agent’s exact reasoning path in a sandbox environment with different models or tool configurations. This is built into tools like Braintrust’s “Agent Debugger” and LangSmith’s “Playback” mode. When an agent fails in production (e.g., it deletes a user’s data instead of updating it), the observability stack captures the full reasoning trace, lets the engineer replay it step-by-step, and even suggests alternative tool calls that would have avoided the failure. This capability has reduced mean-time-to-resolution (MTTR) for agent failures from hours in 2025 to under 15 minutes in 2027.
Pricing for agentic observability is typically based on the complexity of the reasoning graph, not just token count. Expect costs in the range of $0.001–$0.01 per agent execution for full tracing, with discounts for high-volume deployments (over 1 million agent runs per month). Many teams now allocate 15–20% of their total LLM budget to agentic observability alone, reflecting its criticality.

Automated Remediation and Self-Healing Pipelines
Perhaps the most transformative addition to the 2027 LLM observability stack is the automated remediation layer — a set of tools that don’t just detect problems but actively fix them in real-time, without human intervention. By 2027, the gap between “observing a problem” and “fixing a problem” has shrunk from hours or days to seconds, thanks to integrations between observability platforms and LLM orchestration frameworks like LangGraph, CrewAI, and AutoGen.
The core mechanism is the “observability-triggered intervention” — a rule-based or ML-driven system that watches observability signals (latency spikes, semantic drift, agent reasoning loops) and automatically executes predefined remediation actions. For example, if Arize Phoenix detects that a model’s factual accuracy score drops below 85% (measured via automated ground-truth comparisons), it can automatically trigger a model fallback — swapping the primary model (e.g., GPT-5) for a more conservative, fine-tuned model (e.g., Llama-4-Refine) until the issue is resolved. This happens in under 500ms, with zero downtime.
Similarly, if agentic observability detects that an agent is stuck in an infinite reasoning loop (a common failure mode in 2027), the stack can inject a “soft reset” — sending a special system prompt that forces the agent to re-evaluate its current step, or automatically terminating the loop and returning a graceful error to the user. Tools like LangSmith’s “Guardian” and Helicone’s “Auto-Heal” now include pre-built intervention templates for the top 20 failure modes observed across thousands of production deployments.

The most advanced form of automated remediation is predictive self-healing, where the observability stack uses historical data to anticipate failures before they happen. For instance, if a model’s latency has been increasing by 2% per hour for the last 3 hours, the system can proactively spin up additional GPU instances or switch to a cached response mode — all before the latency crosses the user-facing SLA threshold. This is powered by time-series forecasting models (often lightweight LSTMs or gradient-boosted trees) running directly within the observability platform, with no external ML infrastructure needed.
Costs for automated remediation are typically bundled into the observability platform’s pricing, with an additional per-intervention fee of $0.001–$0.01 for complex actions (e.g., model fallback with cache warming). For high-stakes deployments (e.g., healthcare or financial advice), teams often run dual observability stacks — one primary and one standby — to ensure that if the remediation system itself fails, the fallback observability stack can still trigger manual alerts. This redundancy adds about 20–30% to the total observability cost but is considered essential for production-critical systems.
The result is a stack that doesn’t just tell you what’s wrong — it fixes it, learns from it, and prevents it from happening again. In 2027, the question is no longer “What broke?” but “How fast did the system heal itself?”
FAQ
What is the most important layer in the LLM observability stack? Trace capture is often considered the foundation, as it provides the raw data for all other monitoring. Without reliable traces from tools like LangSmith or Honeycomb, evaluating outputs, tracking costs, and detecting drift becomes guesswork. Most teams prioritize getting trace capture right before layering on evaluation or monitoring tools.
How do teams choose between LangSmith and Langfuse for tracing? The choice usually comes down to ecosystem fit and budget. LangSmith integrates deeply with the broader LangChain ecosystem, making it a natural pick for teams already using those tools. Langfuse offers a more open-source-friendly approach with self-hosting options, which can be attractive for teams with strict data residency requirements or smaller budgets.
Is it necessary to use separate tools for evaluation and monitoring? Not strictly, but many enterprises find it beneficial. Dedicated evaluation platforms like Promptfoo or Braintrust specialize in running automated tests and scoring outputs, while monitoring tools like Datadog or Arize focus on real-time metrics and drift detection. Combining them gives teams both proactive quality checks and reactive alerting.
How much does a typical enterprise LLM observability stack cost in 2027? Costs vary widely based on scale and vendor choices, but a rough range for a mid-to-large deployment is between $5,000 and $50,000 per month. This includes trace capture, evaluation runs, and monitoring for tens of millions of LLM calls. Smaller setups or those using open-source tools can reduce costs significantly, while large-scale deployments with advanced analytics may exceed that range.
Can open-source tools replace commercial observability platforms? For many use cases, yes, especially for teams with strong engineering resources. Open-source options like Langfuse (for tracing) and WhyLabs (for monitoring) can cover core needs at a fraction of the cost. However, commercial platforms often provide better integrations, support, and out-of-the-box dashboards, which can save time and reduce operational burden.
What are the biggest challenges teams face when implementing this stack? The main challenges are integration complexity and data volume. Connecting multiple tools—tracing, evaluation, monitoring—requires careful pipeline design and consistent instrumentation. Additionally, LLM calls can generate massive amounts of trace data, making storage and query performance a constant concern. Teams often need to invest in data sampling or compression strategies to keep costs and latency manageable.
Bottom Line
LLM observability in 2027 is a four-layer stack — trace, eval-in-production, cost/latency, drift. The default enterprise combo is LangSmith + Braintrust + Datadog + Arize. The open-source combo is Langfuse + Promptfoo + Helicone + Phoenix. Single-vendor solutions are not yet mature enough to cover all four layers.
Related on PULSE
- How should Datadog rethink its observability thesis for AI buyers?
- Should Datadog acquire Honeycomb to win observability?
- How does Datadog compete against AI-native observability tools?
- Will Datadog beat Splunk in observability by 2027?
- How do you detect LLM jailbreaks in production in 2027?
- How do you version LLM models, prompts, and eval sets in production in 2027?
Sources
- LangChain — LangSmith Trace Capture and Eval Reference
- Langfuse — Open-Source LLM Observability Documentation
- Arize AI — Phoenix and Production Drift Detection Reference
- Braintrust — Eval-in-Production Reference
- Promptfoo — LLM Evaluation Framework Reference
- Datadog — LLM Observability Product Documentation
- Helicone — Proxy-Based LLM Observability Reference
- WhyLabs — LLM Drift Detection Reference
- OpenMeter — Open-Source Usage Metering Reference
- Anthropic — Console Usage Dashboard Documentation
This page will be disappearing soon. Save it to your device for $1 — or read it free while it is here.
@Kory-White- · if Venmo asks, the last 4 of my number are 2012
This page is gone.
This one is off the shelf now. $1 keeps it on your phone for good — the whole page, pictures and diagrams included.
 revopsVector database benchmarks: which should you choose for production RAG in 2027?
 revopsHow do you select an embedding model for RAG in 2027?
 revopsHow do you optimize LLM inference cost in production in 2027?
 revopsWhat are the LLM API provider selection criteria in 2027?
 revopsHow does the AI data center boom and its power-constraint economics work in 2027?
 revopsHow do you set up revenue reporting dashboards in 2027?
 revopsHow do you operationalize AI agents in RevOps in 2027?
 revopsHow do you build a lead routing system in 2027?
 revopsWhy are B2B companies shifting budget from SDR teams to AI prospecting agents in 2027?
 revopsWhat RevOps metrics should you report to the board in 2027?