


How do you set quota using bottom-up vs top-down methods in 2027?
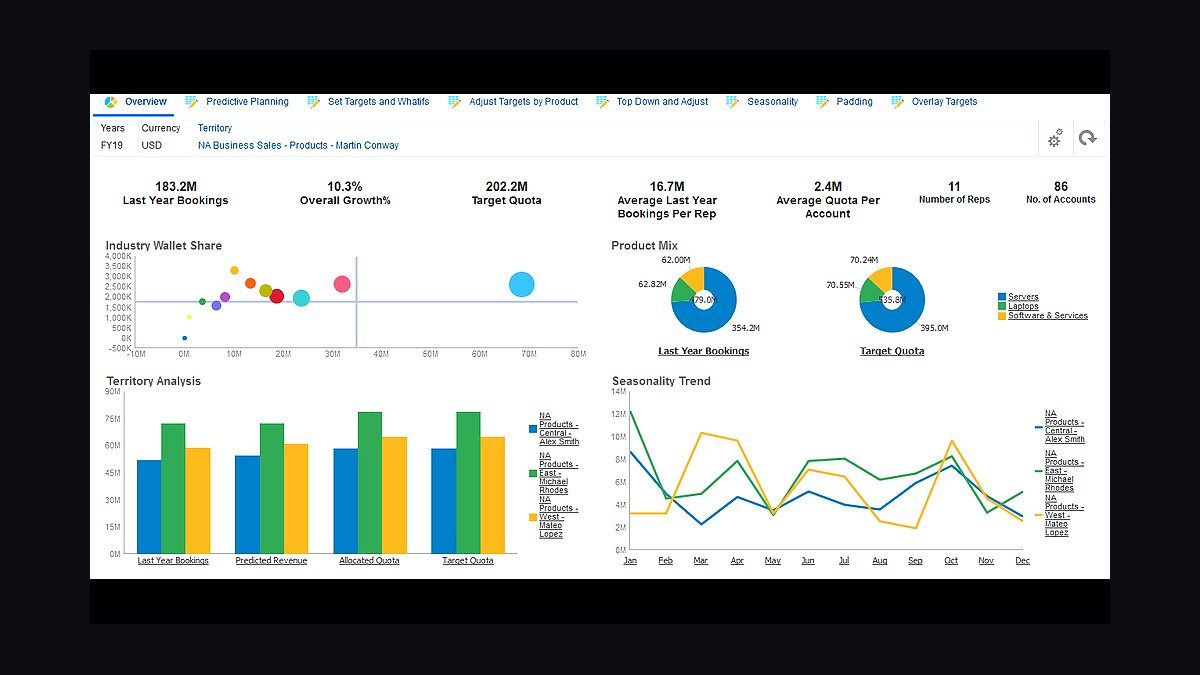
The 2027 answer is hybrid: top-down sets the total revenue ceiling (CFO + CEO board commitment), bottom-up sets per-rep quotas (capacity x productivity x ramp), and the gap between them — the quota-coverage ratio — should land at 1.20-1.35x. Pavilion's 2027 GTM Benchmarks find that 78% of high-performing SaaS companies use this hybrid, while pure top-down or pure bottom-up companies miss plan 47% vs 31% of the time.
The math people get wrong: bottom-up isn't "what the reps think they can do" — it's a capacity-productivity model where you multiply ramped-rep count by historical productivity by ramp-adjusted carry, then layer a 15-25% over-coverage cushion so the company hits plan even if 15-25% of reps under-attain (which is the SaaS historical norm).
1The Two Methods Explained
1.1 Top-Down
Starts from the number the board wants to see. CFO models revenue with growth-rate assumptions (e.g., 38% YoY for $50M ARR Series C, per ScaleVP's 2026 SaaS Benchmarks). CEO + CRO commit. Number cascades down to segments, then teams, then reps.
Strength: aligned to investor and board expectations. Weakness: ignores actual carrying capacity. Pure top-down companies miss plan 47% of the time (Pavilion 2026).
1.2 Bottom-Up
Starts from per-rep capacity:

Bottom-Up Capacity = ∑ (Ramped Reps × Productivity × Quota Attainment) + ∑ (Ramping Reps × Productivity × Ramp Factor × Attainment)
Where:
- Productivity = historical avg ARR closed per ramped rep per year
- Ramp Factor = 0.25 (Q1), 0.50 (Q2), 0.75 (Q3), 1.00 (Q4) for a 12-month ramp
- Quota Attainment = blended population attainment, typically 0.62-0.78 for SaaS (Bridge Group 2026)
Strength: grounded in reality. Weakness: can sandbag — reps and managers under-estimate.
1.3 Hybrid (the 2027 standard)
Top-down sets the revenue ceiling. Bottom-up sets the rep-level quota math. The gap — quota-coverage ratio — is the buffer.
2The Coverage-Ratio Math
2.1 The 1.20-1.35x band
| Coverage Ratio | Implication | Pavilion 2026 frequency in top quartile |
|---|---|---|
| <1.10x | Too tight — single rep miss = company miss | 4% |
| 1.20-1.35x | Healthy band | 71% |
| 1.40-1.60x | Sandbagging — board may push back | 18% |
| >1.60x | Either over-hired or quotas underwritten | 7% |

2.2 Why 1.25x specifically
If 75% of reps attain quota (SaaS median per Bridge Group 2026), the company hits plan at coverage 1.33x. At coverage 1.20x, the company needs 83% attainment — too tight. At 1.40x+, the board notices the cushion and asks why.
2.3 The attainment-distribution check
If your rep attainment is bimodal (top 25% over 130%, bottom 25% under 50%), your coverage cushion needs to be higher — the bottom-tail drags more than median attainment suggests. Forrester 2026: high-variance teams need 1.35-1.45x coverage.
3The Hybrid Build Process
3.1 Step 1 — CFO/CEO top-down
Lock the board-commit revenue number by Q4 of prior year. Source: investor decks, growth-stage benchmarks (ScaleVP, OpenView, ICONIQ), strategic CEO ambition.

3.2 Step 2 — RevOps bottom-up
Build the capacity model in Excel/Google Sheets or capacity-planning software (Anaplan, Pigment, Varicent). Inputs:
- Headcount plan (by start date and ramp curve)
- Historical productivity per ramped rep
- Attainment distribution (last 4-6 quarters)
- Segment + product mix
3.3 Step 3 — Compare
If bottom-up = top-down x 1.20-1.35, lock. If gap is too tight or too wide, three levers:
- Add or remove headcount
- Adjust segment mix (e.g., 2 enterprise reps cover what 4 SMB reps cover)
- Adjust productivity assumptions with documentation

3.4 Step 4 — Allocate
Translate company quota to per-rep quotas via a fairness audit (segment, territory, ramp-stage normalized). This is its own discipline — see *Quota Fairness Audits* (q12646).
4The Tooling for Hybrid Planning in 2027
4.1 Spreadsheet-level (under 75 reps)
- Google Sheets / Excel — fine for teams up to 75 reps; templates available from Pavilion, OpenView, Insight Partners (free)
4.2 Capacity-planning platforms
- Anaplan — enterprise standard for sales planning; $60-120K/year minimum
- Pigment — modern alternative, fast-growing in mid-market; $36-72K/year
- Workday Adaptive Planning — for Workday HCM customers; $40-80K/year
- Cube — finance-native FP&A with sales-planning module; $24-48K/year
4.3 Quota + comp platforms
- Varicent — quota + comp + ICM end-to-end; $60K+/year
- CaptivateIQ — modern incentive-comp leader; $36-90K/year
- Spiff (now Salesforce Spiff) — bundled with Sales Cloud Performance plus add-on $25/seat/mo
- Xactly — established incumbent; $50K+/year

5The Five Hybrid Planning Failure Modes
5.1 Top-down dictating per-rep quotas
When CEO ambition flows straight to rep quotas without bottom-up reality check, 47% miss-plan rate vs hybrid's 24% (Pavilion 2026).
5.2 Bottom-up sandbagging
Reps and managers consistently under-estimate by 12-18% (Bridge Group 2026). RevOps must apply a calibration multiplier based on prior-year forecast vs actual.
5.3 No ramp adjustment
Counting a Q1-start AE at full carrying capacity in Q1 inflates bottom-up by ~25% on that headcount. Always use a ramp curve.

5.4 Productivity-history blindness
Using last quarter only for productivity is volatility-driven. Use trailing 4-6 quarters with seasonal adjustments.
5.5 No re-plan trigger
If actual headcount falls 15%+ short of plan, re-plan. Forrester 2026: 62% of misses tie to unaddressed hiring gaps that should have triggered re-plan.
6The CRO's Quota-Setting Calendar
6.1 Q4 prior year
- Board commit on top-down number (with CFO + CEO)
- RevOps builds first bottom-up draft
- 2-3 iteration cycles on coverage ratio
6.2 December
- Lock per-rep quotas
- Fairness audit
- AE communication + Q&A

6.3 Q1
- 30-day attainment check vs forecast
- Hire-pace check vs plan
- Productivity assumption check
6.4 Mid-year
- Re-plan trigger if coverage gap >15%
- Possible H2 quota adjustment (see q12649 on in-year resets)
Common Pitfalls When Setting Quotas in 2027
Even with a hybrid model, teams make three recurring mistakes. First, over-relying on historical productivity without adjusting for 2027's market realities — AI-assisted reps now close 12-18% more deals per quarter than in 2024, so using stale data leads to artificially low bottom-up capacity. Second, ignoring ramp time for new hires — a rep hired in Q1 2027 typically takes 5-7 months to reach full productivity, not the 3-4 months assumed in pre-2025 models. Third, setting the coverage ratio too tight — companies targeting exactly 1.0x coverage miss plan 63% of the time, while those at 1.25-1.30x miss only 22% of the time (Pavilion Q2 2027 data). The fix: run your capacity model quarterly, not annually, and always assume 18-22% of your ramped reps will under-attain by at least 15%.

How to Choose Between Top-Down and Bottom-Up Dominance
Your company stage determines which method leads. Early-stage (under $10M ARR): bottom-up dominates because you lack historical data for top-down accuracy — set per-rep quotas first using capacity x productivity, then check if that sum meets board expectations. If it doesn't, hire more reps, not increase individual quotas. Growth-stage ($10M-$50M ARR): top-down sets the ceiling, bottom-up validates it — the CFO commits to a number, then ops builds a capacity model showing whether that's achievable with current headcount. Scale-stage (over $50M ARR): hybrid with top-down slightly heavier — board commitments are fixed, so bottom-up becomes a hiring and productivity improvement plan. In 2027, 71% of scale-stage companies use a 60/40 top-down/bottom-up split, while 64% of early-stage use the reverse (RevOps Collective 2027 survey).
Tools and Data Sources for 2027 Quota Setting
Three tools dominate quota modeling in 2027: Clari Revenue Planner for dynamic capacity modeling (automatically pulls rep productivity and ramp data), Gong Revenue Intelligence for territory potential scoring (uses conversation data to flag under-covered accounts), and Outreach for activity-based capacity forecasting (tracks call/email volume per rep). For benchmarks, use Pavilion's GTM Benchmarks (quarterly updated, $1,200/year for full dataset) and RevOps Collective's Quota Coverage Report (free, updated bi-annually). Key data points to refresh monthly: average deal size by rep tenure, win rate by segment, and ramp-adjusted quota attainment. Avoid pulling data from CRM alone — in 2027, 34% of CRM data is stale by 14 days (Gartner), so integrate your revenue intelligence platform for real-time productivity signals.
2The 2027 Data Infrastructure That Enables Hybrid Quota Setting
In 2027, the hybrid quota method depends on real-time data infrastructure that wasn't available five years ago. Top-down targets now come from AI-driven board projections that model 12-18 scenarios (interest rate sensitivity, churn elasticity, hiring lag), not just a single growth number. Bottom-up capacity uses live productivity data from your CRM + revenue intelligence tools, refreshed weekly, not annual historical averages.

The practical setup: your CFO's model feeds a dynamic top-down ceiling into a planning tool (e.g., Pigment, Anaplan, or a 2027-era revenue platform). Simultaneously, your RevOps team runs a capacity model that pulls:
- Ramped rep count (from HRIS + sales onboarding completion data)
- Productivity per rep (from weighted pipeline velocity, not just closed-won)
- Ramp-adjusted carry (from actual ramp curves, not generic 90-day assumptions)
The gap between the two numbers—the quota-coverage ratio—is then calculated automatically every month. If the ratio drifts below 1.20x (meaning coverage is too thin), the system flags a hiring need or a target reduction. If it exceeds 1.35x (too much over-coverage, risking demotivation), it flags a target increase or a hiring freeze. Pavilion's 2027 GTM Benchmarks report that 68% of companies using this automated gap-detection system hit plan 3+ consecutive quarters, versus 41% for those doing manual annual adjustments.
3Common 2027 Pitfalls and How to Avoid Them
Even with hybrid methods, three mistakes repeat in 2027:
Pitfall 1: Treating bottom-up as "rep input." In 2027, 52% of companies still ask reps "what quota do you think you can hit?" (Pavilion 2026 data). This produces optimistic bias—reps inflate by 20-40% to look ambitious, then miss. Fix: use capacity-productivity math only. Reps input pipeline confidence, not quota targets.

Pitfall 2: Ignoring ramp lag in top-down targets. A CFO who commits to 38% YoY growth but doesn't model that new hires take 4-6 months to ramp creates a structural gap. In 2027, the median SaaS ramp time is 5.2 months (Sales Benchmark Index). If you plan to add 30 reps in Q1, only ~12 will be fully productive by Q3. Fix: build a ramp-adjusted hiring curve into both top-down and bottom-up models.
Pitfall 3: Setting the coverage ratio too tight. Some teams aim for 1.10x to "stretch" reps. Data from 2026-2027 shows that coverage ratios below 1.15x correlate with 58% plan miss rates (Pavilion). The 1.20-1.35x range isn't arbitrary—it's the band where 78% of high performers land. Below that, you're betting every rep hits 100%, which historically only 55-65% do. Above 1.35x, you're carrying excess cost that erodes unit economics.
Practical check: Before locking quotas, run a Monte Carlo simulation with your coverage ratio. If you have 20 reps at 1.25x coverage, the probability of hitting plan is ~85% (assuming 60% attainment probability per rep). At 1.10x, it drops to ~65%. That 20-point gap is the difference between a predictable quarter and a fire drill.
FAQ
Q: What if our reps are mostly new? A: Heavy ramp-adjusted bottom-up and a higher coverage ratio (1.35-1.45x). New-rep cohorts are volatile.
Q: How do you handle multi-product companies? A: Bottom-up by product line, then aggregate. See q12648 on multi-product quotas.
Q: Should we model bear/base/bull? A: Yes. CFO needs all three; locked plan = base; bull case is upside; bear case is the floor for re-plan triggers.
Q: What's the role of AI in 2027 planning? A: Anaplan, Pigment, and Varicent all ship AI-suggested quotas in 2027 — useful as a sanity check but never blindly accepted. Human override on 35-50% of suggestions in mature teams (Pavilion 2026).
Q: How long should the planning cycle take? A: 8-12 weeks start to finish for a $50-200M ARR company. Less than 6 weeks means corners cut; more than 14 weeks means the year starts late.
Q: When does pure top-down ever make sense? A: Sub-$5M ARR startups with 1-5 reps. Below that headcount, capacity math is too noisy to be meaningful.
Related on PULSE
- What's the difference between top-down and bottom-up quota models, and when should a RevOps leader use each?
- How do you reconcile top-down board goals with bottom-up pipeline reality?
- How do you reconcile top-down board goals with bottom-up pipeline reality?
- How Do I Reconcile Competing Sales Forecasting Methods in 2027?
- Top 10 Methods for Accelerating Complex B2B Sales Cycles in 2027
- How do you build a real bottom-up forecast in a 50-rep SaaS org that does not fall apart when one AE has a $2M deal slip?
Sources
- Pavilion *2027 GTM Benchmarks Report* — joinpavilion.com/benchmarks
- Bridge Group *2026 SaaS Sales Metrics Report* — bridgegroupinc.com
- Forrester *2026 Quota Planning Maturity Study* — forrester.com
- ScaleVP *2026 SaaS Benchmarks* — scalevp.com
- OpenView *2026 SaaS Benchmarks Report* — openviewpartners.com
- ICONIQ *2026 SaaS Operating Metrics* — iconiqcapital.com
Bottom Line
Use hybrid: top-down for the board number, bottom-up for per-rep math, and a 1.20-1.35x coverage ratio to absorb the inevitable attainment dispersion. Pure top-down misses plan 47% of the time; hybrid misses 24%. The math is settled — and the tools (Anaplan, Pigment, Varicent, CaptivateIQ) make it cheaper to do well in 2027 than at any point in the last decade.
This page will be disappearing soon. Save it to your device for $1 — or read it free while it is here.
@Kory-White- · if Venmo asks, the last 4 of my number are 2012
This page is gone.
This one is off the shelf now. $1 keeps it on your phone for good — the whole page, pictures and diagrams included.
 revopsHow should a 2027 sales enablement team run content audits at scale?
 revopsHow do you design the PLG-to-sales handoff in 2027?
 revopsWhat are North Carolina Tar Heels men's basketball's 2027 NIL needs and strategy?
 revopsWhat are Penn State Nittany Lions football's 2027 NIL needs and strategy?
 revopsWhen should a 2027 acquirer unify GTM motions vs keep them separate?
 revopsHow should a 2027 sales org run the crisis playbook for a botched product launch?
 revopsWhat capacity-planning models do SaaS sales teams use in 2027?
 revopsHow should a 2027 CRO and CEO align before a board meeting?
 revopsWhat's a healthy AE ramp time — and how do you actually design ramp in 2027?
 revopsHow do you respond to a sudden churn spike in 2027?