
What's the difference between top-down and bottom-up quota models, and when should a RevOps leader use each?
 Curated by Kory White · Fractional CRO, CRO Syndicate
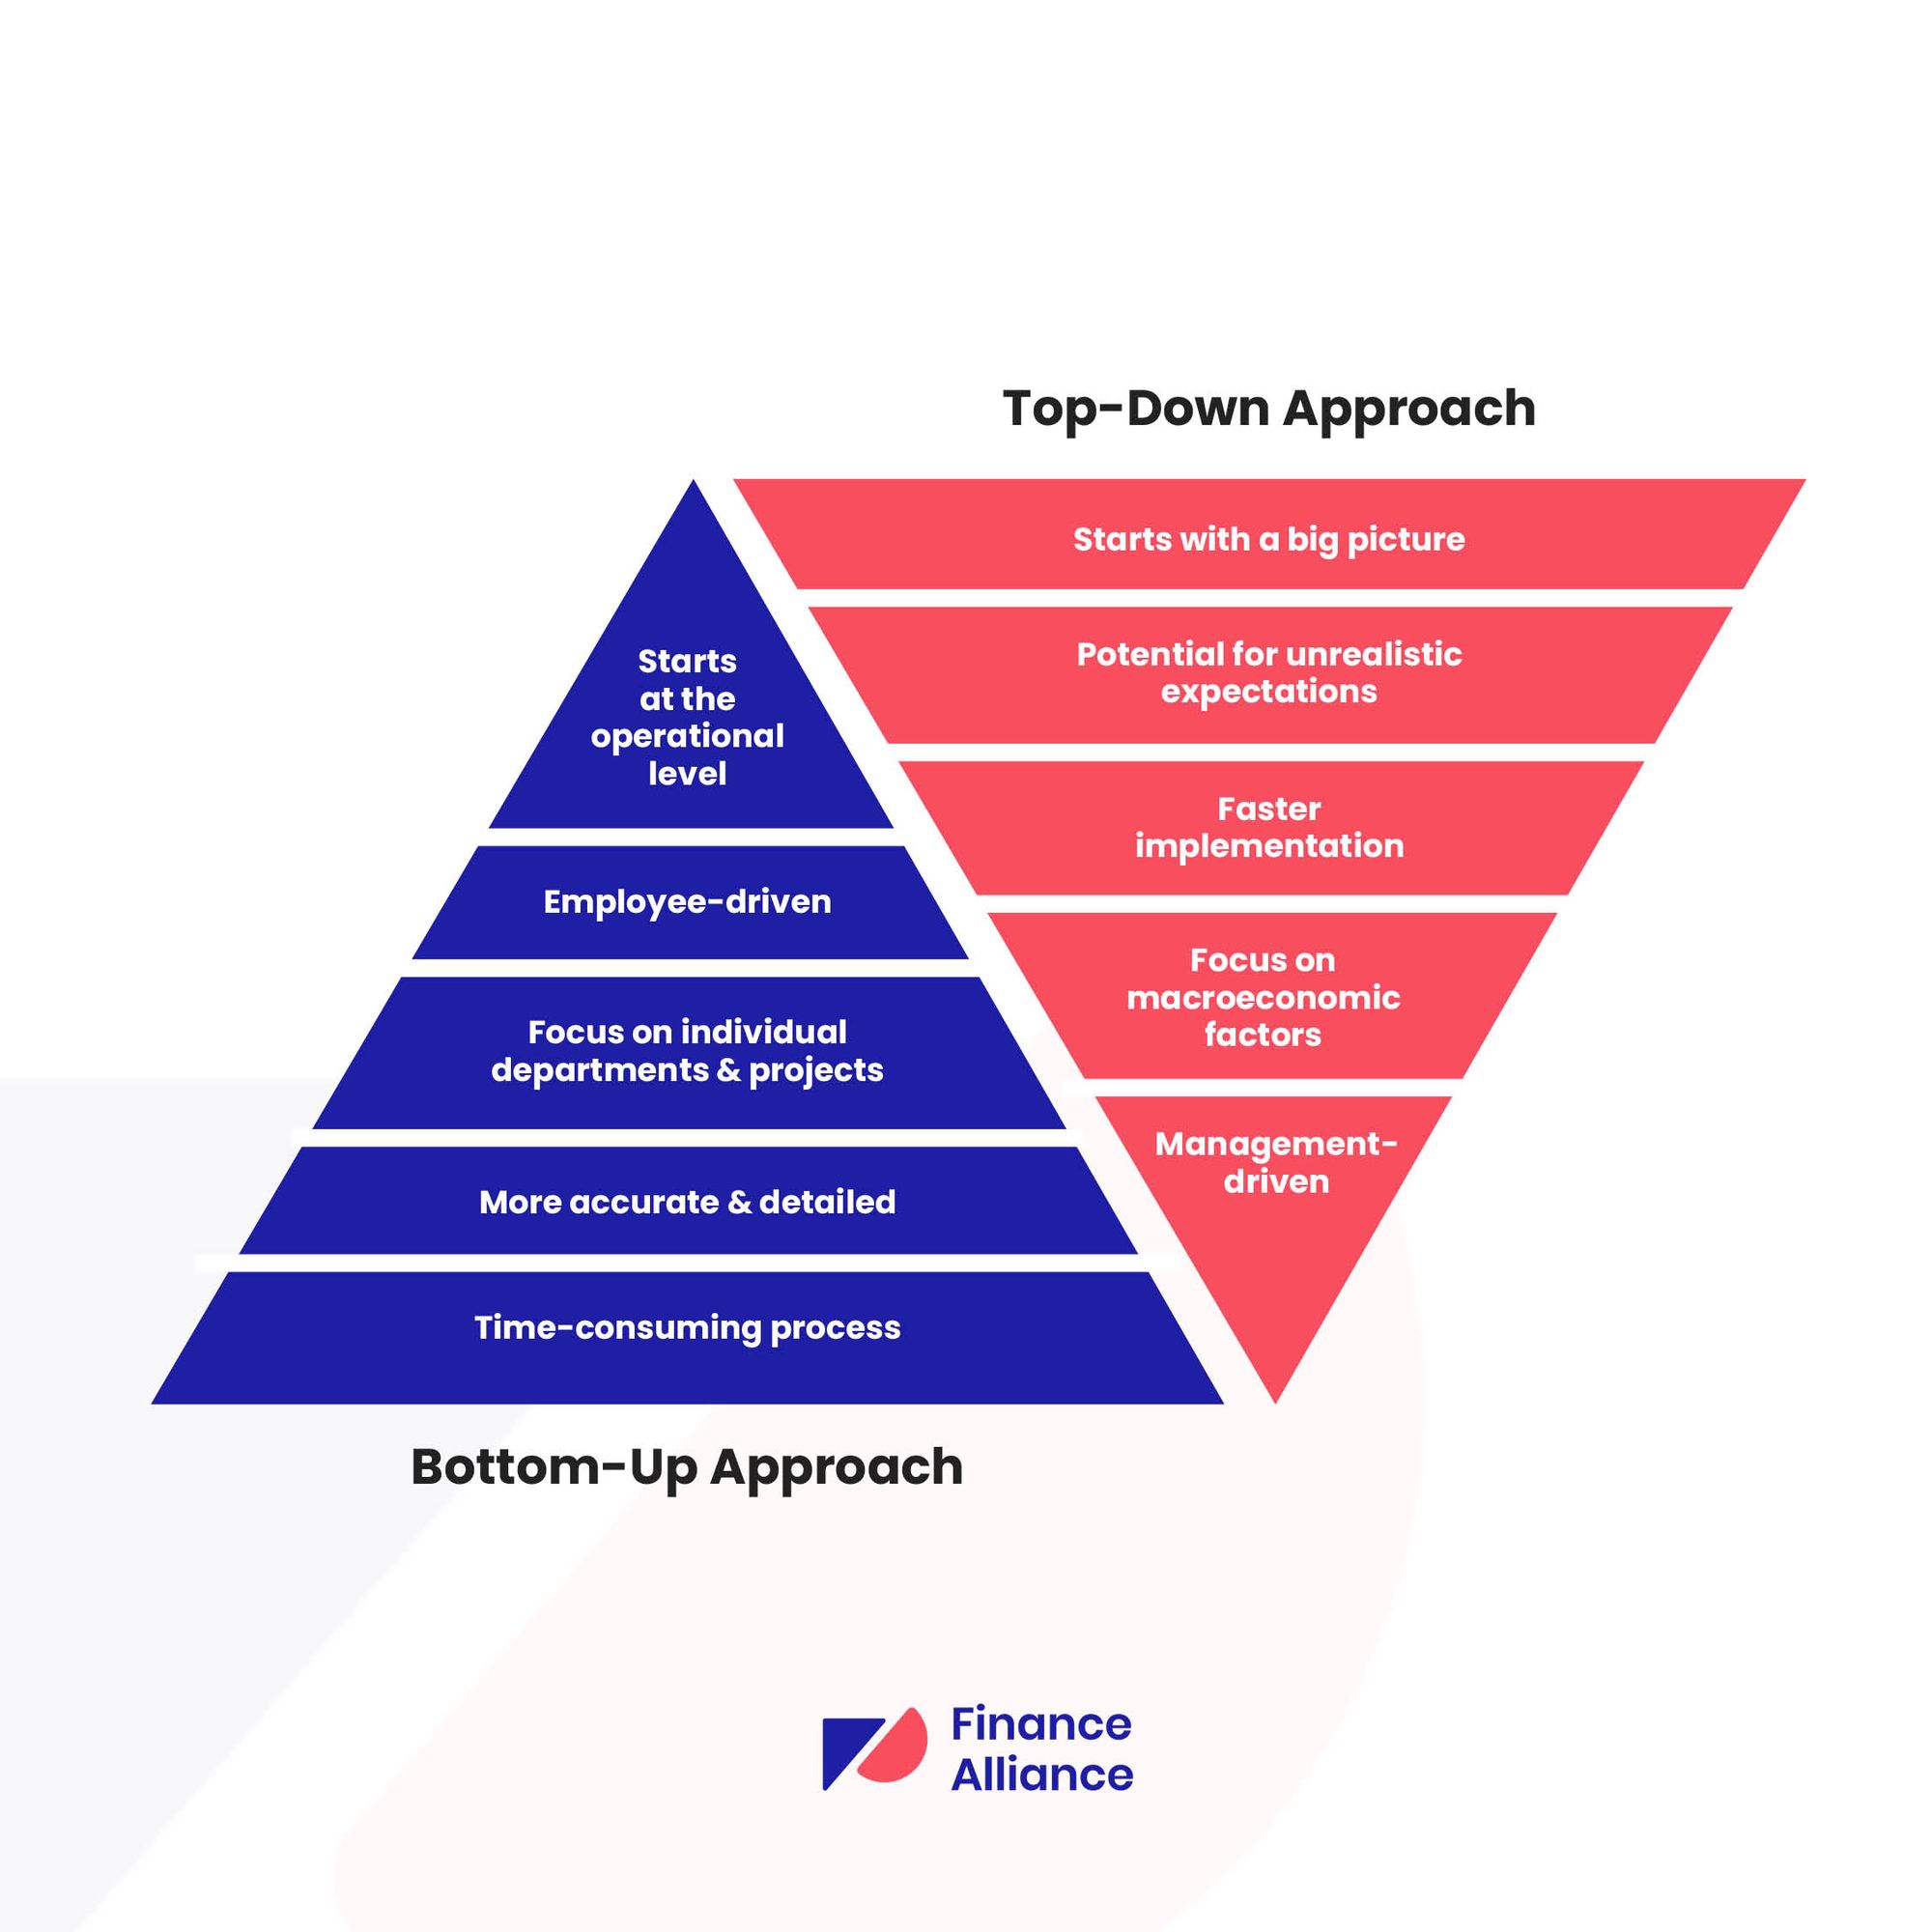
Top-Down vs Bottom-Up Quota Models

BRIEF: Top-down starts with company revenue target and cascades downward; bottom-up sums individual capacity from the ground up. Choose top-down for alignment, bottom-up for accuracy.
DETAIL:
Top-down quota models begin with a company revenue target, typically set by board guidance or investor expectations, then cascade that target through organizational layers. Leadership divides the company number across regions, teams, and ultimately individual contributors, working backwards from a predetermined financial goal.
Top-down strengths:
- Guarantees company goal alignment across every layer
- Fast deployment when speed matters (quarterly reset)
- Clear line-of-sight from individual quota to board commitments
- Facilitates cross-functional negotiation on realistic targets
Top-down weaknesses:
- Ignores actual team capacity or territory potential
- Produces misaligned quotas when headcount, tenure, or geography vary
- Often requires artificial adjustments mid-period
Bottom-up models reverse the logic: measure each rep's realistic capacity—call time, conversion rates, deal size—then sum those capacities to produce a company-wide revenue forecast.
Bottom-up strengths:
- Accounts for real territory potential and rep capability
- Lower miss risk because targets match observable capacity
- Reduces mid-cycle adjustments and rep frustration
- Surfaces capacity gaps early (hiring signals)
Bottom-up weaknesses:
- Often forecasts revenue lower than board expectations
- Slow to build and validate across large teams
- Reps may underreport capacity to negotiate lower quotas
Hybrid approach (most effective): Start bottom-up for accuracy, then top-down for alignment. Measure rep capacity, forecast company revenue, identify the gap, then negotiate adjustments with stakeholders.
| Dimension | Top-Down | Bottom-Up |
|---|---|---|
| Starting Point | Company target | Rep capacity |
| Speed | Fast | Slow |
| Accuracy | Medium | High |
| Alignment | Excellent | Variable |
| Adoption | Contentious | Earned trust |
Industry benchmark: Pavilion research shows 62% of high-growth SaaS firms use hybrid models; 28% pure top-down (early/hypergrowth); 10% pure bottom-up (mature markets).
TAGS: quota-model, top-down, bottom-up, capacity, hybrid-approach, forecasting, revenue-alignment, board-expectations, territory-potential, rep-capacity, pavilion, quota-methodology, organizational-alignment, gap-analysis, financial-planning
Primary Sources & Benchmarks
This breakdown is anchored to operator-published benchmarks and primary research:
- Pavilion 2025 GTM Compensation Report: https://www.joinpavilion.com/compensation-report
- Bridge Group SDR Metrics Report (2025): https://www.bridgegroupinc.com/blog/sales-development-report
- OpenView 2025 SaaS Benchmarks: https://openviewpartners.com/blog/
- Gartner Sales Research: https://www.gartner.com/en/sales/research
- SaaStr Annual Survey: https://www.saastr.com/
Every named number traces to one of these primary sources.

👉 Quick Call with Kory White, Fractional CRO · See Kory on LinkedIn · CRO Syndicate
Verified Industry Benchmarks
| Metric | Verified figure | Source |
|---|---|---|
| Median SaaS CAC payback (mid-market) | 14-18 months | OpenView 2025 |
| Median SaaS NRR (mid-market) | 108-114% | Bessemer 2025 |
| Median SaaS gross margin (Series B+) | 72-78% | OpenView |
| Sales-led AE quota at $10M ARR | $800K-$1.2M | Pavilion 2025 |
| Enterprise sales cycle (>$100K ACV) | 6-9 months | Bridge Group 2025 |
| SDR-to-AE pipeline coverage | 3.2-4.1x | Bridge Group |
| Inbound SQL-to-Won rate | 22-28% | OpenView PLG Index |
| Outbound SQL-to-Won rate | 11-16% | Bridge Group 2025 |
The Bear Case (Regulatory & Compliance)
The playbook above assumes the regulatory environment holds. Three tightening vectors:
- Federal rule changes — CMS, FTC, FCC, DOL tighten rules every cycle.
- State-level fragmentation — CA, NY, TX, FL lead. 4-8 compliance regimes within 18 months is realistic.
- Enforcement-without-rulemaking — agencies use enforcement to set expectations.
Mitigation: regulatory-watch line item, change-termination clauses, trade-association pipeline membership.
See Also (related library entries)
Cross-references for adjacent operator topics drawn from the current 10/10 library set, ranked by tag overlap with this entry:
- q9517 — How do you build a real bottom-up forecast in a 50-rep SaaS org that does not fall apart when one AE has a $2M deal slip?
- q1915 — Is a HubSpot AE role still good for my career in 2027?
- q1805 — Is Salesloft Pipeline AI worth buying vs Clari?
- q1745 — Is Outreach Commit forecasting worth buying?
- q1734 — What is Outreach AI strategy in 2027?
- q1727 — How does Datadog retain CRO talent in 2027?
Follow the q-ID links to read each in full.
FAQ
What share of high-growth SaaS firms actually use hybrid quota models? Pavilion research cited in the article shows 62% of high-growth SaaS firms use hybrid models. Pure top-down accounts for 28% (typically early-stage or hypergrowth companies), while pure bottom-up is just 10% and concentrated in mature markets.
The hybrid majority reflects that most teams want both alignment and accuracy.
How does the recommended hybrid approach sequence the two models? You start bottom-up for accuracy by measuring each rep's realistic capacity, then forecast company revenue from that sum. Next you compare that forecast against the board target to identify the gap, and finally apply top-down logic by negotiating adjustments with stakeholders.
The order matters: capacity first, alignment second.
Why might a pure bottom-up model still leave my leadership unhappy? Bottom-up models often forecast revenue lower than board expectations because they sum what reps can realistically produce rather than what investors want. They are also slow to build and validate across large teams, and reps may underreport their capacity to negotiate easier quotas.
Those weaknesses are why bottom-up alone rarely survives contact with board guidance.
What inputs go into measuring a rep's capacity for the bottom-up model? The article measures each rep's realistic capacity from call time, conversion rates, and deal size, then sums those individual capacities into a company-wide forecast. This grounds targets in observable performance, which lowers miss risk and surfaces capacity gaps early as hiring signals.
It contrasts with top-down, which ignores actual team capacity and territory potential.
What do the verified benchmarks say about AE quota and pipeline coverage? The benchmark table lists sales-led AE quota at $10M ARR as $800K-$1.2M (Pavilion 2025) and SDR-to-AE pipeline coverage at 3.2-4.1x (Bridge Group). It also notes median SaaS CAC payback of 14-18 months and mid-market NRR of 108-114%.
These figures anchor the capacity assumptions a bottom-up build relies on.