
How do you set quarterly sales goals that cascade from quota to daily activity in 2027?
 Curated byKory White · Fractional CRO · Maryland
 PULSEKNOWLEDGE LIBRARY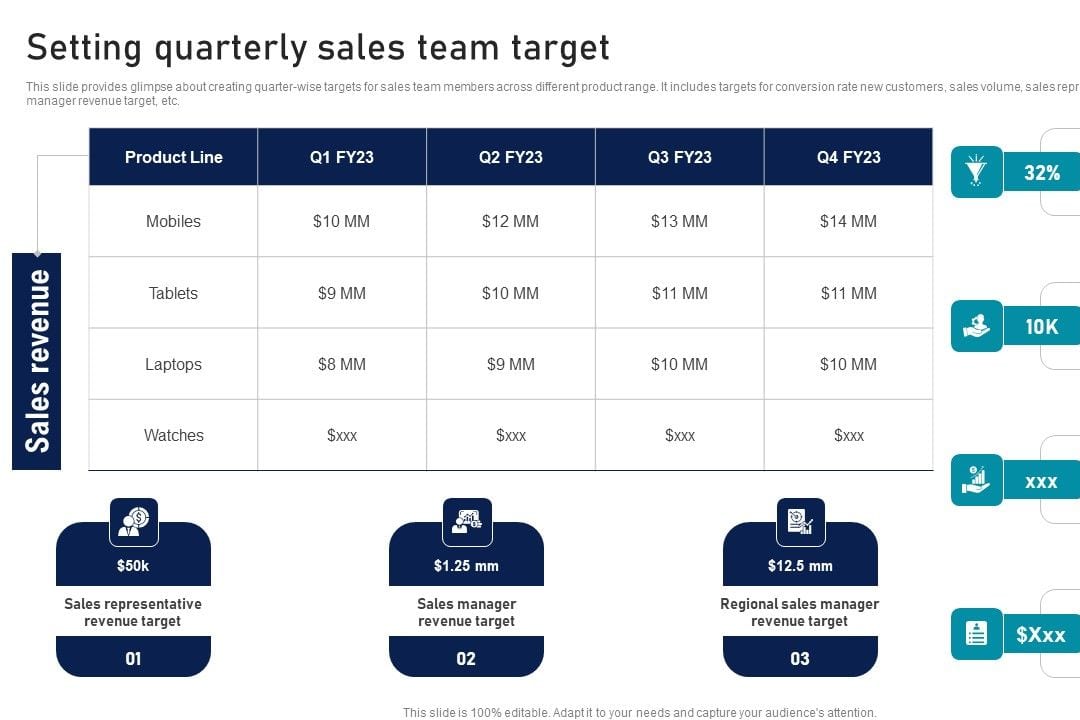
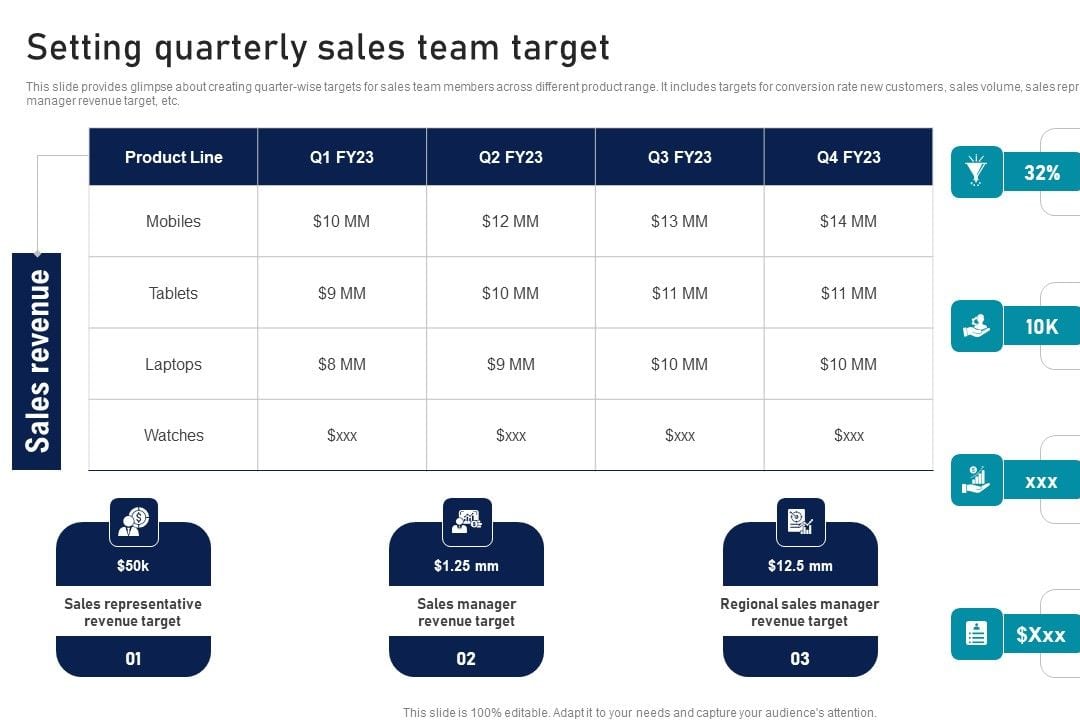
Start with the quarterly quota, divide by expected win rate and average deal size to get required pipeline, then convert pipeline into meetings, meetings into qualified conversations, and conversations into daily calls, emails, and touches. Model both top-down and bottom-up, reconcile the gap, and re-baseline the cascade monthly against actual conversion rates.
Two ways to build the cascade
Every quarterly goal-setting exercise resolves into one of two mechanics, and most teams that struggle are quietly running both without admitting it.
Option A: top-down quota division. The company sets a quarterly revenue number, finance allocates it across segments and territories, and each rep's quota is a slice of that allocation. From there, the cascade is pure division. If a rep owes $300,000 in closed-won for the quarter and the historical win rate on qualified opportunities is 22% with a $30,000 average deal, the rep needs 10 wins, which means roughly 46 qualified opportunities created and worked inside the window, which at a 30% meeting-to-opportunity rate means about 152 first meetings, which at a 4% cold-outbound meeting rate means roughly 3,800 targeted touches across the quarter. Divide by 60 selling days and you get a daily activity floor of about 63 touches plus 2-3 meetings. The virtue of top-down is that it always sums to the company number, which is what the board asked for. The defect is that it is indifferent to whether the activity it implies is physically possible.
Option B: bottom-up capacity modeling. You start at the other end. Count selling days in the quarter, subtract holidays, training, QBRs, and PTO, then multiply by what a rep can actually execute in a day. A rep who can sustain 45 quality touches and 4 discovery-or-later meetings per day, over 58 real selling days, produces a hard ceiling on pipeline creation. Run that ceiling forward through the same conversion rates and you get an *achievable* quarterly number. Bottom-up is credible with the sales floor because it was built from what reps do, and it exposes headcount and coverage gaps months before they show up as a miss. Its defect is that it rarely equals the board number, and left alone it drifts conservative — reps and frontline managers have an obvious incentive to under-model their own capacity.
Option C: the reconciled hybrid, which is what mature teams actually run. You build both, put them side by side, and treat the delta as the planning artifact. If top-down demands 3,800 touches and bottom-up says the rep can sustain 2,600, you have a 1,200-touch gap that must be closed by one of exactly four levers: raise a conversion rate, raise average deal size, add capacity (headcount, SDR support, or automation), or lower the quota. Naming the lever in the planning meeting is the entire point — a gap that goes unnamed becomes a coverage story in week 10 and a miss in week 13.
The 2027 wrinkle is that the touch-count layer of the cascade has become a poor proxy for effort. AI-assisted sequencing, research, and drafting mean raw send volume is nearly free and nearly worthless as a management signal. Teams that still cascade to "150 emails a day" are cascading to a number their tooling can satisfy in minutes without producing a single conversation. The durable bottom rungs are the ones a machine cannot fake: live conversations held, multi-threaded contacts added to an open opportunity, meetings that convert to a next step, opportunities that advance a stage with a documented buyer action. The cascade structure is unchanged; the leaf-level metric has to move from *volume produced* to *human engagement obtained*, or the whole chain decouples from revenue in about two quarters.
A third framing question sits underneath both options: what does the quarterly goal actually govern? If quota is the only thing that cascades, the daily layer is advisory and reps ignore it. If daily activity is the only thing that is managed, you get high-activity, low-yield teams that miss anyway. The cascade works when each layer owns a different decision — quota owns compensation, pipeline coverage owns forecasting, weekly activity owns coaching, and daily activity owns the rep's calendar. Assigning one purpose per layer prevents the common failure where a manager tries to coach a rep off a quota number they cannot influence today.
How to decide which model leads
The decision is mostly about data maturity and how much the business changed since the last comparable quarter.
Lead with top-down when you have at least four consecutive quarters of clean, stage-consistent funnel data; the segment, pricing, and motion are stable; and headcount is roughly flat. Under those conditions the historical conversion rates are trustworthy enough that division produces a real plan, and the board number is the binding constraint anyway.
Lead with bottom-up when any of the following is true: you changed segments or pricing in the last two quarters; more than a third of the team is ramping; the sales cycle exceeds the quarter, so most of what closes in Q3 was created in Q1 and Q2; or your CRM stage definitions have moved, which silently invalidates every historical rate you would otherwise divide by. In a long-cycle business the top-down cascade to *daily activity* is nearly meaningless for in-quarter revenue — the activity you run this quarter pays out next quarter, so the cascade must split into two goals: a closing goal on existing pipeline and a creation goal for future quarters.
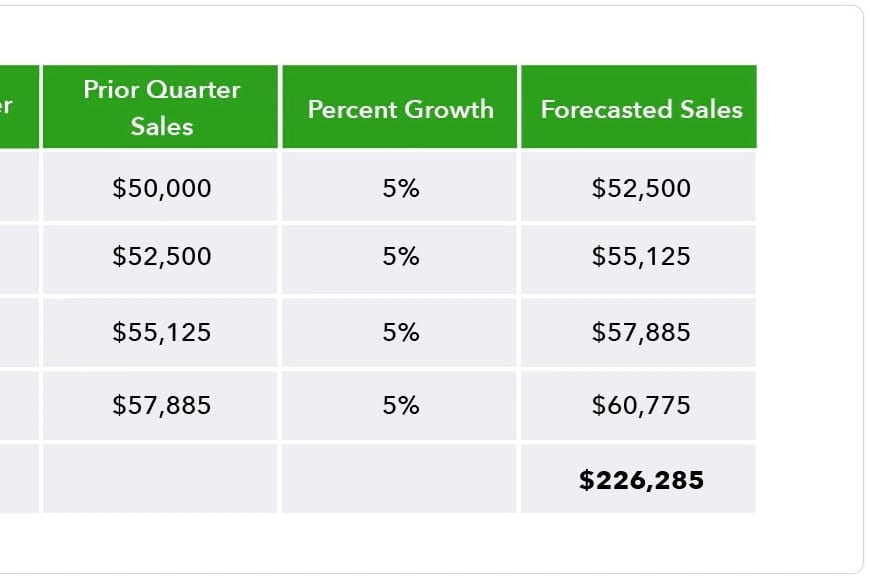
Ramping reps break both models unless handled explicitly. A rep in month two of a six-month ramp should not receive a linearly divided quota. Standard practice is a ramp schedule — commonly something like 25% / 50% / 75% / 100% of full quota across the first four quarters — with the shortfall absorbed at the manager or region level, not silently redistributed onto tenured reps.
One rule keeps the decision honest: whichever model leads, the other one must still be built and shown. A top-down plan published without a capacity check is a wish, and a bottom-up plan published without the company number is an abdication. The five-minute version — selling days times daily capacity times conversion chain — is cheap enough that there is no excuse for skipping it.
The arithmetic behind each model
Work a single territory end to end so the numbers are concrete. Assume a mid-market team, a $36,000 average deal, a 20% win rate on qualified opportunities, a 35% meeting-to-qualified-opportunity rate, and a 60-day sales cycle that fits inside a quarter.
Top-down math. Rep quota is $450,000 per quarter. At $36,000 per deal that is 12.5 wins, round to 13. At a 20% win rate, 13 wins require 65 qualified opportunities closing in the window. At a 35% meeting-to-opportunity rate, 65 opportunities require about 186 first meetings. If half of those meetings come from marketing and SDR sourcing, the rep self-sources 93. At a 5% outbound meeting rate on well-targeted accounts, 93 self-sourced meetings require roughly 1,860 meaningful touches. Across 60 selling days that is 31 touches and about 3 meetings per day — a demanding but plausible load.
Coverage math sits on top. Pipeline coverage is open pipeline value divided by quota. At a 20% win rate the break-even coverage is 5x, and because slippage and pushed deals are certain, most teams plan to 3x–4x on *late-stage* pipeline and higher on total pipeline. For the $450,000 quota, that means entering the quarter with roughly $1.35M–$1.8M of credible open pipeline. If the rep enters with $900,000, the cascade is already broken on day one, and no amount of daily activity in a 60-day-cycle business will fix it in time. That is the single most useful early signal the cascade produces.
Bottom-up math on the same territory. The quarter has 65 weekdays; subtract 3 holidays, 2 days of QBR and training, and 4 days of PTO, leaving 56 selling days. A tenured rep in this motion realistically sustains about 30 targeted touches and 3.5 meetings per day when they also have to run discovery, build proposals, and manage existing deals. That yields 1,680 touches and 196 meetings for the quarter. Run 196 meetings through 35% and you get 68 qualified opportunities; at 20% that is 13.7 wins, or roughly $493,000. In this case bottom-up slightly exceeds top-down, and the plan is credible.
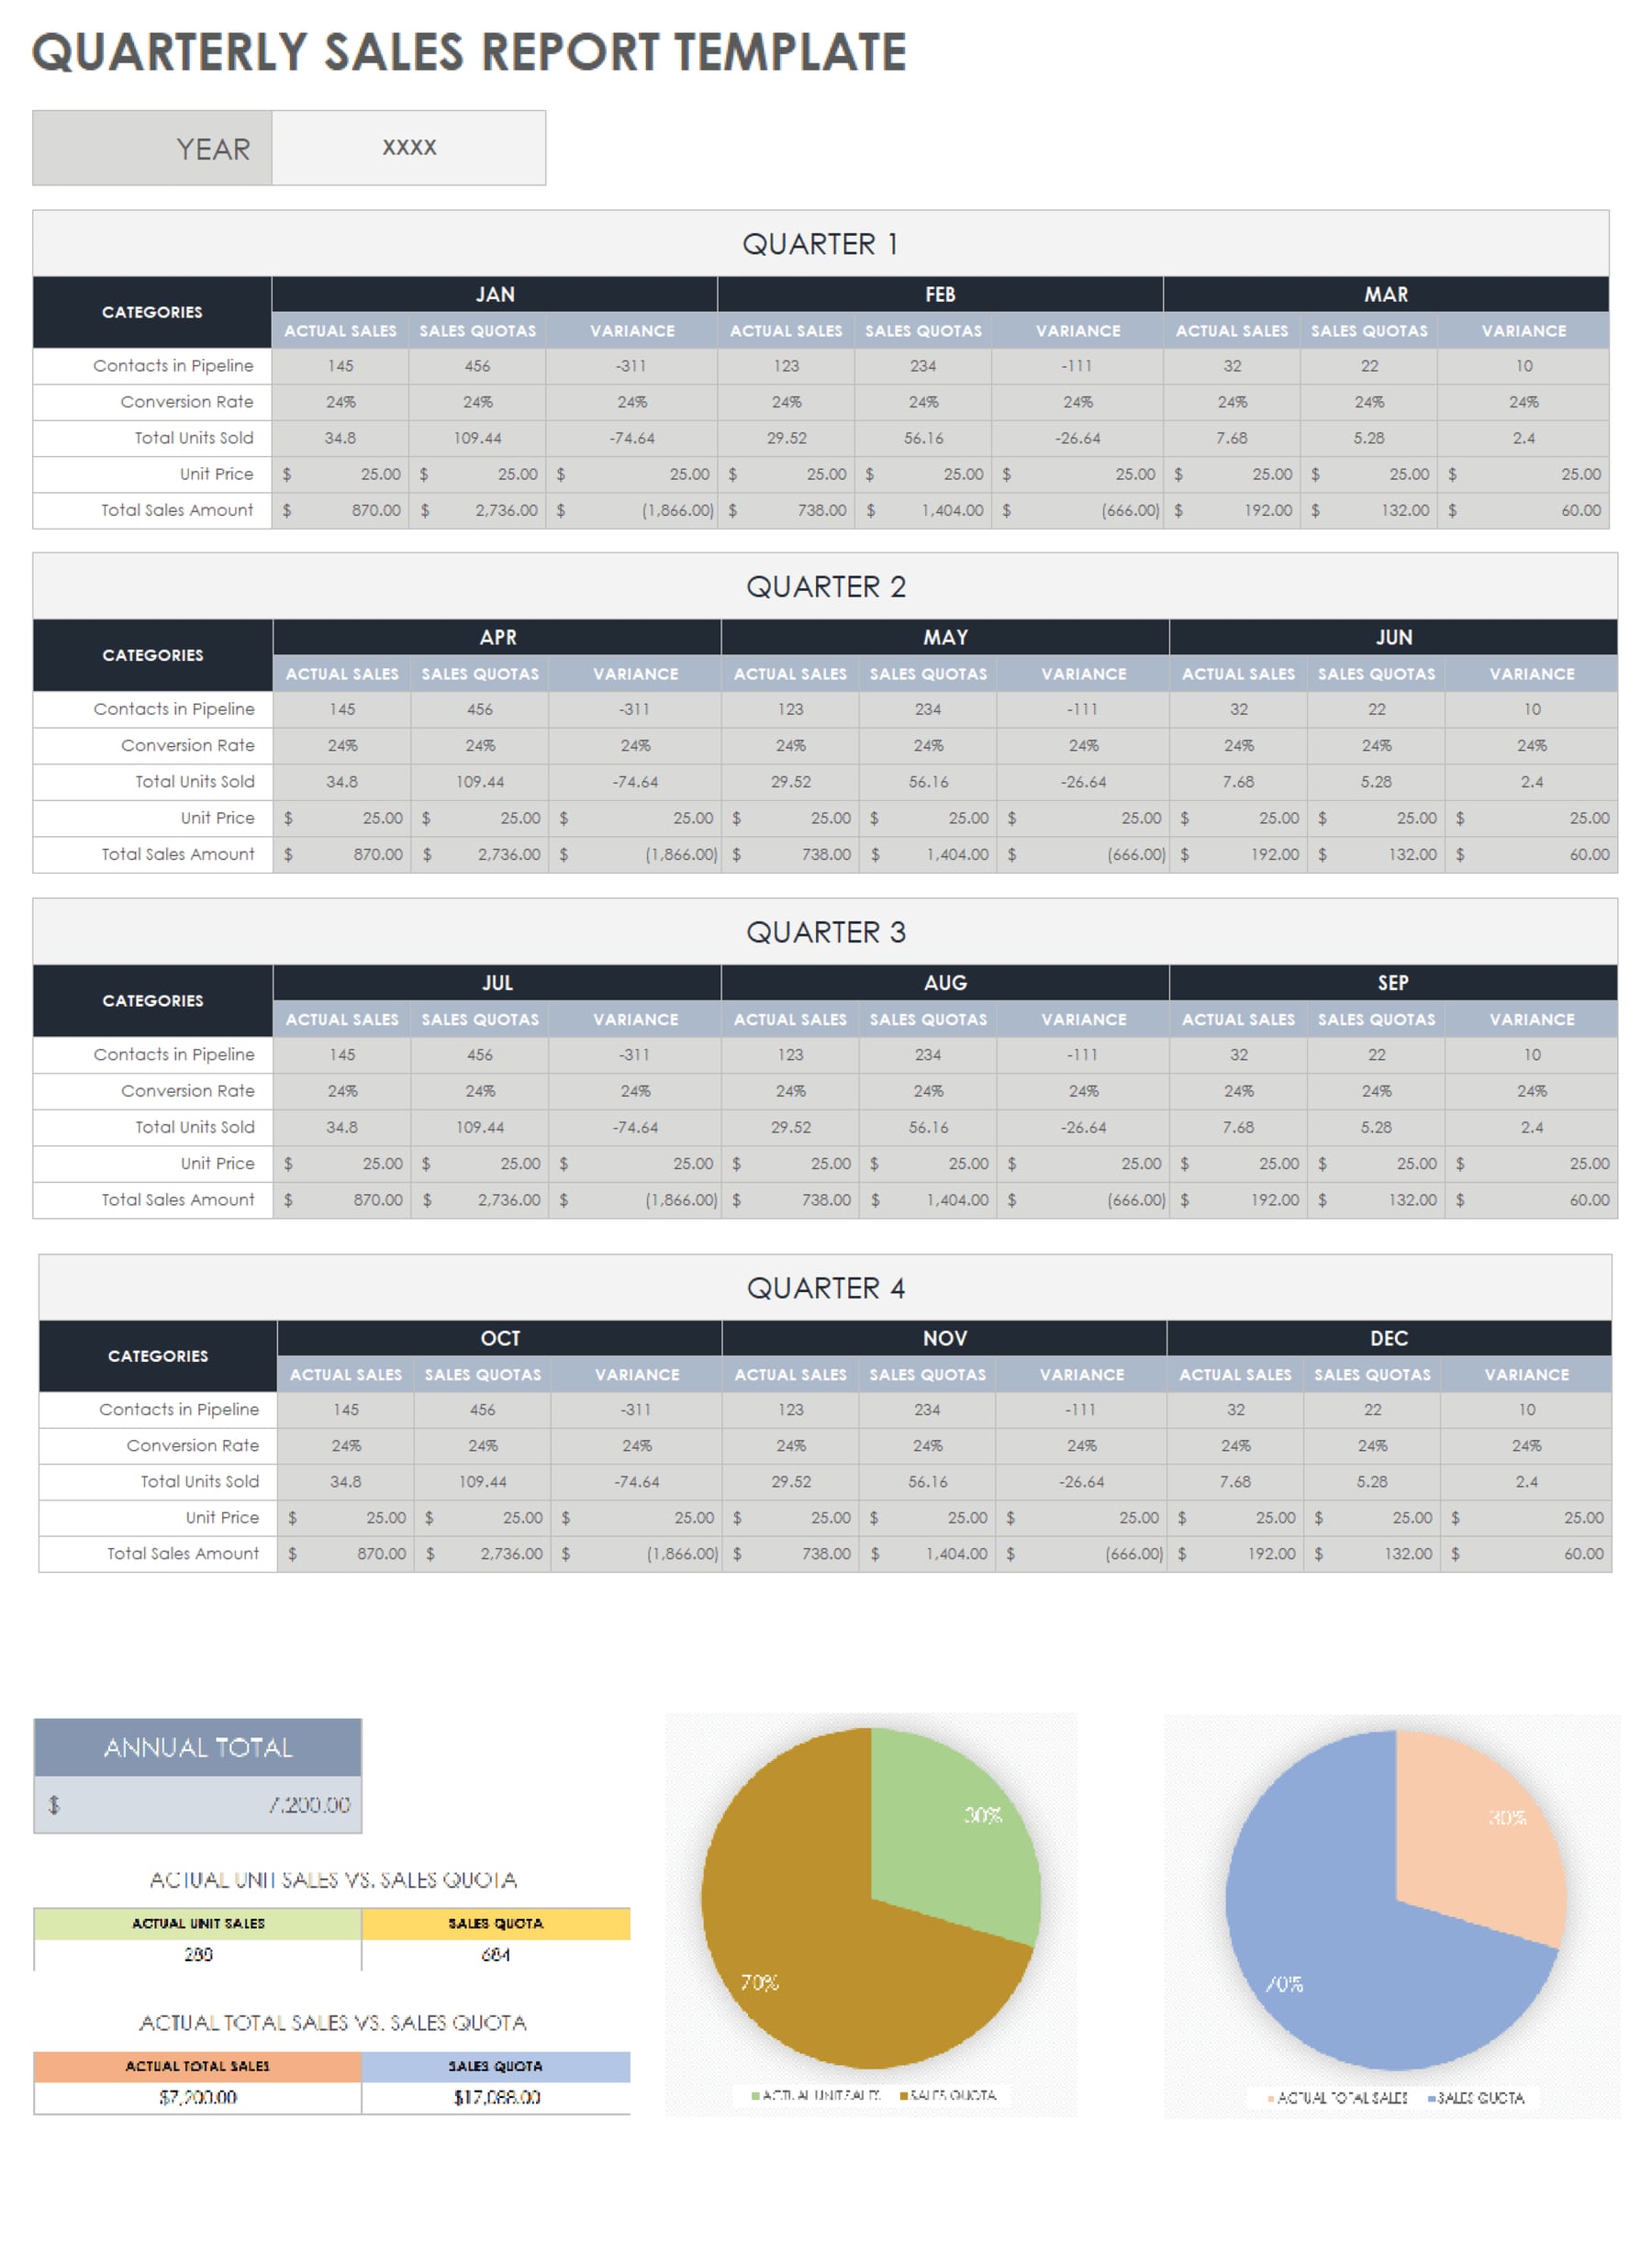
Now break it. Suppose the same rep is at 60% ramp and the win rate has drifted from 20% to 15% after a pricing change. Thirteen wins now require 87 opportunities, which require 248 meetings, which — with the same 50% self-sourced split — require about 2,480 touches. Capacity at 60% ramp is closer to 18 touches and 2 meetings a day, or 1,008 touches and 112 meetings across 56 days. The gap is not marginal; the plan calls for roughly 2.2x the meetings the rep can produce. No coaching cadence closes that. The only honest responses are reallocating quota, adding sourcing support, or accepting a planned shortfall at the region level and covering it elsewhere.
Converting weekly, not just daily. Daily targets are brittle because a single all-day onsite blows the day's numbers. The practical unit is the week with a daily floor. From the first example: 186 meetings over 12 working weeks is 15.5 meetings per week, and 1,860 touches is 155 per week. Publish those as the managed numbers, and publish a daily floor — say 20 touches and 2 meetings — as the "never go below this" line. Reps then have room to batch prospecting into two focused blocks a week without tripping a red dashboard, which is how high performers naturally work anyway.
Sanity checks that catch bad cascades. First, multiply your implied daily meeting count by average meeting length plus prep and follow-up; if it exceeds five hours, the plan is fiction. Second, check that implied new-opportunity creation is consistent with total addressable accounts in the territory — a cascade that requires touching 1,200 accounts in a 400-account patch is asking reps to burn the territory. Third, verify that the conversion rates you divided by came from the same segment and motion you are planning; blending SMB and enterprise rates produces a cascade that is wrong for both.
Sequencing the rollout across the quarter
Cascades fail on calendar as often as on math. The sequence below assumes the quarter starts on day 1 and works backward from there.
Weeks minus-4 to minus-3 (prior quarter). Finance and RevOps lock the company number and segment allocations. RevOps refreshes conversion rates from the trailing four quarters, flags any stage-definition changes that invalidate comparisons, and publishes the rate card that everyone will divide by. This is the step most often skipped, and skipping it means each manager quietly uses their own rates.
Weeks minus-3 to minus-2. Territory and account assignments finalize. Both cascades get built — top-down from the allocation, bottom-up from named-rep capacity including ramp status and known PTO. The gap analysis happens here, in writing, with a named lever per territory.
Week minus-1. Quota letters and activity targets go out together. Dashboards are configured before the quarter opens, not in week 3. Every rep should be able to see, on day 1, their quota, their required pipeline coverage, their weekly meeting target, and their daily floor — four numbers, on one screen.
Weeks 1-2. Manage inputs only. It is too early for revenue signal, and pushing on deal outcomes in week 1 produces sandbagging and pulled-forward discounting. Coach on meeting counts, opportunity creation, and multi-threading.
Weeks 3-4. First coverage checkpoint. Compare actual open pipeline against the coverage requirement. This is the last point at which a coverage gap can realistically be closed inside the quarter in a 60-day-cycle business.
Weeks 5-8. Re-baseline conversion rates against in-quarter actuals. If the meeting-to-opportunity rate is running 28% instead of 35%, recompute the required activity immediately rather than waiting for the quarter-end postmortem. The cascade is a live model, not a document.
Weeks 9-13. Shift the coaching emphasis from creation to progression and close. Activity targets should not vanish — creation for the following quarter still has to happen — but they typically step down 20-30% while deal execution absorbs the time.
Governance details that determine whether it sticks. Put the cascade in one system of record, not a spreadsheet per manager. Version it, so week-8 rate changes are visible rather than overwritten. Review at exactly two cadences — a 20-minute weekly on inputs and coverage, and a monthly on rate drift — because a third meeting turns the model into overhead. Do not compensate directly on the daily activity layer; the moment volume metrics carry money, they get gamed, and in 2027 they get gamed by tooling in a single afternoon. Compensate on revenue, manage on coverage, coach on activity. Finally, at quarter close, compare planned versus actual at every rung, not just the top. A team that hit revenue while missing meetings by 40% learned something important about its rate card, and a team that hit every activity number and missed revenue learned something more urgent about targeting.
Related questions
How many selling days should you plan into a quarter?
Start at roughly 65 weekdays, then subtract company holidays, QBR and training days, expected PTO, and any all-hands or kickoff time. Most teams land near 55-58 usable selling days. Planning against the raw 65 systematically overstates capacity by about 12%.
Should activity targets be daily or weekly?
Both. Publish weekly targets as the managed number so reps can batch prospecting into focused blocks, and publish a lower daily floor as a minimum. Daily-only targets punish reps for a legitimate onsite day; weekly-only targets let people cram on Friday.
What pipeline coverage ratio should you require?
Invert your win rate for break-even, then add margin for slippage. At a 20% win rate, break-even is 5x, so plan for more on total pipeline and roughly 3x on late-stage. Segment-specific rates matter — never apply one blended ratio across SMB and enterprise.
How do you cascade goals for ramping reps?
Use a published ramp schedule rather than linear division — a common shape is 25%, 50%, 75%, then 100% of full quota across four quarters. Absorb the shortfall at manager or region level, and scale activity targets to ramp stage too, not just quota.
What replaces raw email volume as a bottom-rung metric?
Metrics a tool cannot manufacture: live conversations held, new contacts multi-threaded into open opportunities, meetings that produce a scheduled next step, and stage advances backed by a documented buyer action. These stay correlated to revenue even as generative tooling makes send volume free.
FAQ
Why do most quarterly cascades break by week 6?
Because they were built on stale conversion rates and never re-baselined. The plan divides quota by last year's win rate, in-quarter reality runs several points lower, and nobody recomputes the required activity until the postmortem. Re-baselining at weeks 5-8 against actual in-quarter rates is the single highest-leverage fix, and it costs one meeting.
Should the sales team see the bottom-up model or only their quota?
Show both. Reps who only see a quota assume it was invented in a finance spreadsheet, and that assumption kills adoption of the activity layer. Showing the capacity model — including the named gap and the lever chosen to close it — converts the cascade from an imposition into a shared plan, and it surfaces bad assumptions early from the people closest to the accounts.
How do you handle a sales cycle longer than one quarter?
Split the goal in two. One goal governs closing existing pipeline created in prior quarters; a separate goal governs creation for future quarters. Cascading daily activity to in-quarter revenue in a 120-day-cycle business produces panic prospecting that cannot possibly pay out in time, and it starves the following quarter of pipeline.
Does compensating on activity metrics help adoption?
It helps adoption and hurts truth. Once volume metrics carry money they get optimized directly, and with current tooling that optimization takes hours, not weeks. Keep compensation on revenue and outcome-linked milestones, use coverage for forecasting, and use activity purely as a coaching and diagnostic layer.
What is the minimum data needed to build a credible cascade?
Four rungs with defensible rates: average deal size, win rate on qualified opportunities, meeting-to-qualified-opportunity rate, and touch-to-meeting rate — each from the same segment and motion you are planning. Without segment-specific rates, use bottom-up capacity as the primary model and treat the top-down division as an aspiration to reconcile against.
How often should the cascade be revisited inside the quarter?
Weekly for inputs and coverage in a short 20-minute review, monthly for conversion-rate drift and any required recomputation of activity targets. More frequent reviews turn the model into administrative overhead; less frequent means a broken rate assumption survives past the point where the quarter can still be saved.
Sources
- https://hbr.org/2017/07/how-to-set-sales-quotas-that-motivate-your-team
- https://www.mckinsey.com/capabilities/growth-marketing-and-sales/our-insights
- https://www.salesforce.com/resources/research-reports/state-of-sales/
- https://www.gartner.com/en/sales
- https://www.bain.com/insights/topics/sales-and-marketing/
- https://www.forrester.com/blogs/category/b2b-sales/
- https://hbr.org/2012/07/the-right-way-to-use-compensation
- https://www.bcg.com/capabilities/marketing-sales/overview
Related on PULSE
- [Quarterly Goal Cascading: From Quota to Daily Activity Breakdown](/knowledge/st0745)
- [The Sales Activity Metrics Reboot — 60-Min Training](/knowledge/st199)
- [How do you set stretch goals that motivate sellers without causing burnout in 2027?](/knowledge/st814)
- [What are the key steps to setting SMART goals for individual sales reps in 2027?](/knowledge/st809)
- [Top 10 team-meeting templates for quarterly sales goal alignment in 2027](/knowledge/st0758)
- [Top 10 Templates for Daily Stand-Up Sales Huddles in 2027](/knowledge/st0687)
 stWhat is the most effective method for splitting territories between inside and field sales in 2027?
 stWhat tools or templates help assign territories based on account data in 2027?
 stHow do you define leading vs. lagging KPIs for a sales team in a one-hour workshop?
 stHow do you set stretch goals that motivate sellers without causing burnout in 2027?
 stWhat is the best framework for defining sales KPIs for a new B2B team in 2027?
 stHow do you align sales team KPIs with company revenue targets during a 60-minute training?
 stHow should sales territories be assigned to balance workload and revenue potential in 2027?
 stWhat criteria should you use to define KPIs for a sales development rep in 2027?
 stWhat are the key steps to setting SMART goals for individual sales reps in 2027?
 stIs Sales Trainings worth it in 2027?