
The Quant Trading Stack: Backtesting and Execution with R, QuantLib, and AWS Lambda
 Curated byKory White · Fractional CRO · Maryland
 PULSEKNOWLEDGE LIBRARY
Quality
Certified
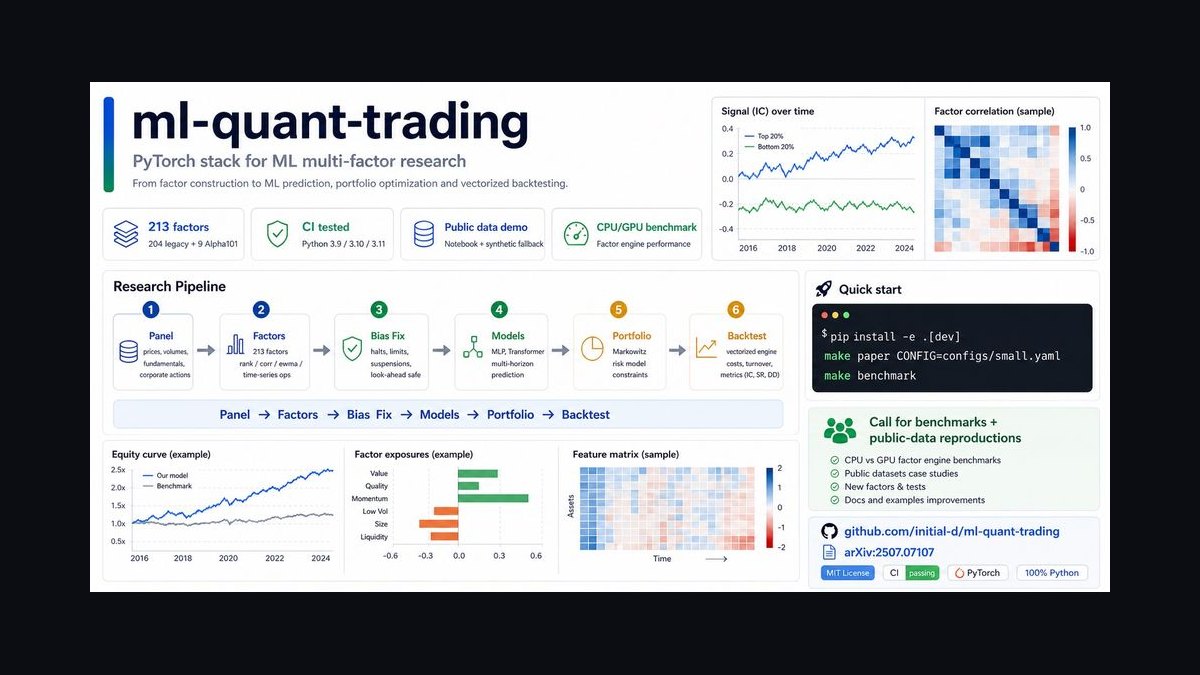
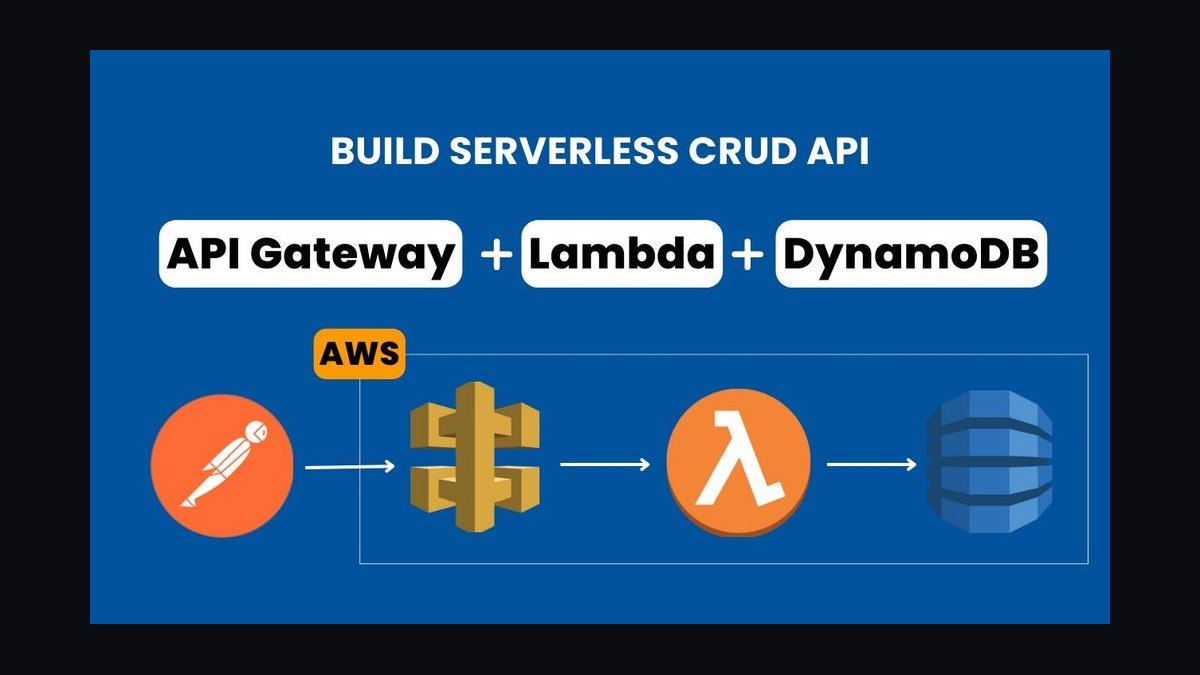
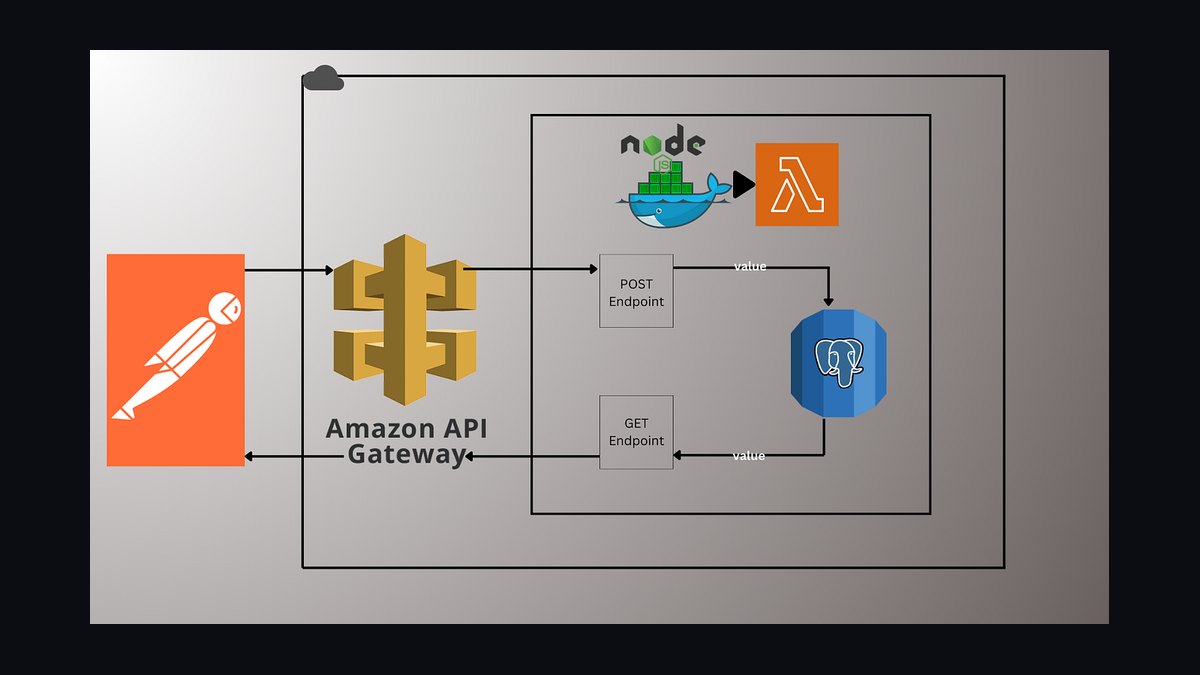
A quant trading stack for backtesting and execution combines R for statistical research, QuantLib for derivatives pricing, and AWS Lambda for serverless compute. R handles signal generation and performance analytics, QuantLib prices options, swaps, and exotics, and Lambda runs backtests and live orders without provisioning servers. Data flows from market feeds through S3 into stateless functions that write results to DynamoDB and broker APIs.
What the stack is and why it matters
The stack has three cooperating layers, each doing one job well. R is the research and analytics layer: packages like quantmod pull price series, PerformanceAnalytics computes Sharpe ratios, drawdowns, and value-at-risk, and caret or tidymodels train predictive models such as random forests for volatility forecasting. QuantLib is the pricing layer: it values options, swaps, bonds, and exotics with battle-tested numerical methods, so a strategy that trades anything beyond plain equities gets a defensible fair value rather than a rough approximation. AWS Lambda is the compute layer: it runs each backtest, each pricing call, and each order submission as a short-lived, stateless function that scales horizontally on demand.
Why this combination rather than a monolithic Python service or a colocated C++ trading engine? Three reasons. First, R's statistical ecosystem is deeper for research work — the CRAN task views for finance, time series, and machine learning cover ground that would take weeks to reimplement elsewhere. Second, QuantLib is the reference implementation for derivative pricing across the industry; reusing it means your model risk is bounded by a library that thousands of quants have audited. Third, Lambda removes the operational tax of running research clusters: a backtest that needs 900 CPU-seconds can fan out across 300 concurrent invocations and finish in seconds, then cost nothing until the next run.
The trade-off is real. Lambda has a 15-minute ceiling per invocation, cold starts measured in hundreds of milliseconds to a few seconds, and no persistent in-memory state between calls. That means the stack suits strategies on minute-to-daily bars, portfolio research, and derivatives analytics — not sub-millisecond market making. If your holding period is measured in microseconds, this is the wrong architecture and you should look at colocated C++ or Rust instead. For everything from swing trading to systematic options overlays, the serverless model wins on cost and iteration speed.

The step-by-step process
Building this stack follows a repeatable sequence. Each step produces an artifact the next step consumes, so you can stop, inspect, and restart without redoing work.
Step 1 — Land raw market data in S3. Pull daily or minute bars from a vendor (Alpha Vantage, Polygon.io, or your broker's API) into a partitioned S3 prefix such as s3://quant-lake/bars/symbol=AAPL/year=2024/month=03/. Store as Parquet, not CSV, so Athena and DuckDB can scan columns selectively. Partitioning by symbol and date keeps query costs predictable as the lake grows.
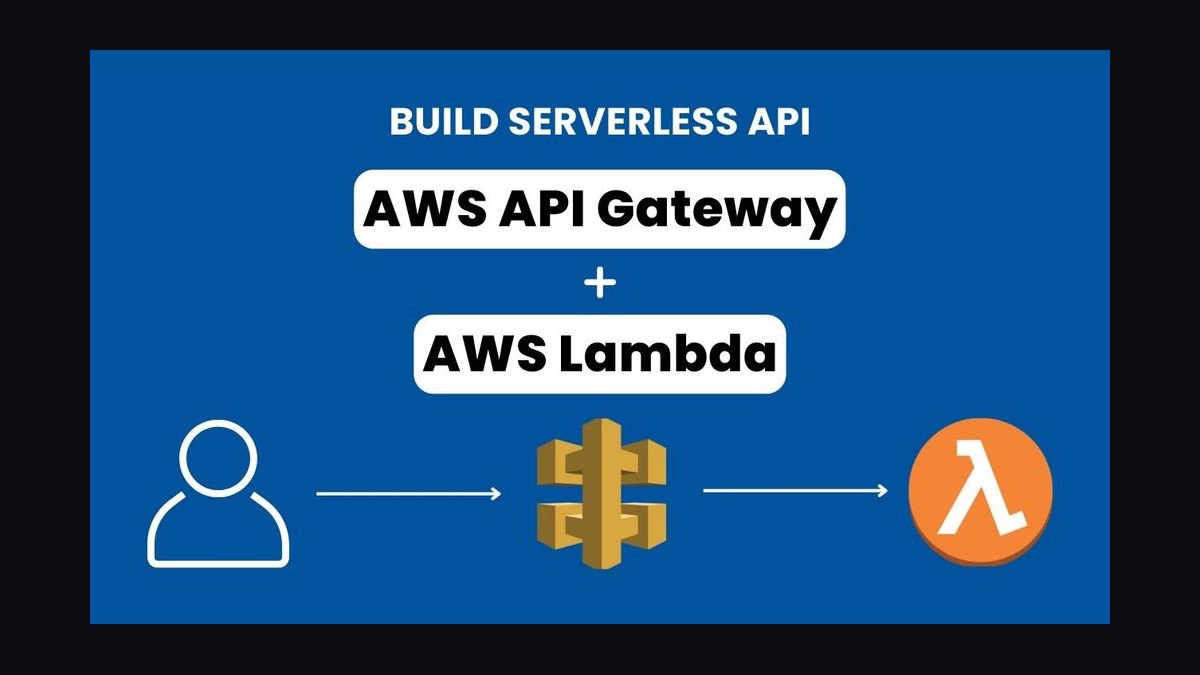
Step 2 — Normalize and validate. A scheduled Lambda reads new objects, checks for gaps, splits, and duplicate timestamps, adjusts for corporate actions, and writes a clean table to a second prefix. Log every rejected row with a reason code. Bad data is the single largest source of phantom backtest alpha.
Step 3 — Run the backtest in R. A container-image Lambda loads the clean series, applies your signal logic (moving-average crossover, mean reversion, momentum ranking, or a trained model), simulates fills with realistic slippage and commissions, and computes performance metrics. Write each run's parameters and metrics to DynamoDB with a run ID so results are reproducible.
Step 4 — Price any derivatives exposure with QuantLib. If the strategy involves options, collars, or swaps, the execution path calls QuantLib to compute fair value, Greeks, and scenario P&L before the order is sized. This step is what separates a toy backtest from something you can defend to a risk committee.
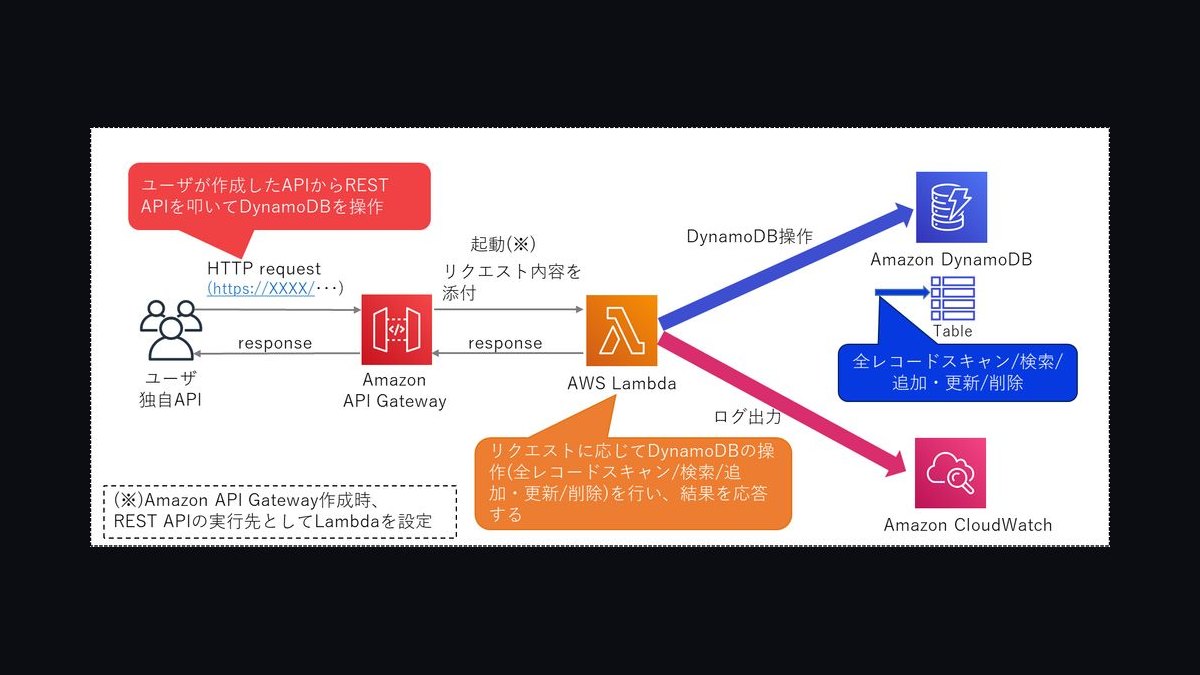
Step 5 — Execute through a broker API. A separate Lambda receives an approved signal, re-prices with QuantLib against the current quote, submits the order to Interactive Brokers, Alpaca, or similar, and records the fill. Keep execution in its own function so a pricing bug cannot accidentally fire orders.
Step 6 — Monitor and feed back. CloudWatch captures logs and custom metrics; a post-trade Lambda reconciles fills against the model, updates the strategy's live performance table, and raises an alert when realized slippage drifts beyond a threshold.
The loop closes when post-trade metrics feed back into the next backtest as a calibration input — realized slippage becomes the assumption for the next simulation, so the model drifts toward reality instead of away from it.
Costs, timelines, and typical ranges
Serverless quant infrastructure is cheap to start and scales sub-linearly with research volume, which is why it appeals to small teams. Concrete ranges for a single-strategy stack:
- Market data: $0 to roughly $200 per month depending on vendor and history depth. Free tiers cover daily bars for a few hundred symbols; minute bars for a broad universe push you into paid plans.
- S3 storage: A decade of daily bars for 3,000 symbols is under 5 GB — pennies per month. Minute bars for the same universe run into hundreds of GB, still typically $5–$25 per month at standard tier.
- Lambda compute: At 3,008 MB and roughly 60 seconds per backtest run, each invocation costs a few cents. A thousand scenario runs per day lands in the $20–$80 monthly range.
- DynamoDB: On-demand pricing for a few million small writes per month is usually under $10.
- Broker API: Most retail-facing APIs are free with an account; institutional feeds carry separate agreements.
- Engineering time: The dominant cost. A working backtest-to-paper-trading loop typically takes one experienced developer two to four weeks. Adding QuantLib pricing, live execution, and reconciliation pushes it to six to ten weeks.
The break-even against a small EC2 cluster is real but modest. A t3.medium running continuously costs roughly $30 per month; the serverless equivalent for intermittent research workloads is often $5–$15, and the gap widens as your run frequency drops. The bigger saving is operational: no patching, no idle capacity, no capacity planning for month-end batch runs.
Timelines compress if you resist scope creep. A minimum viable stack — one data source, one strategy, daily bars, paper trading only — can be live in under two weeks. The most common schedule slip is trying to support every asset class and every order type on the first pass.
Where teams get it wrong
Treating Lambda as a low-latency execution venue. Lambda cold starts and API gateway hops add tens to hundreds of milliseconds. If your edge depends on being first in the queue, this is the wrong tool. Use it for signal generation and portfolio-level decisions, and hand off to a colocated execution service if latency truly matters.
Backtesting without realistic frictions. Assuming zero slippage and zero commission inflates Sharpe ratios by amounts that routinely exceed the entire edge. Model spread crossing, market impact at your intended size, and borrow costs for shorts. If the strategy only works at zero cost, it does not work.
Ignoring the 15-minute ceiling. A monolithic backtest that loops over 500 symbols in one invocation will time out. Fan out: one invocation per symbol or per parameter set, then aggregate. This also makes retries cheap and failures isolated.

Skipping the pricing layer for anything with optionality. Teams often approximate option values with Black-Scholes when the instrument is American-style, has a dividend schedule, or sits on a curve. QuantLib exists precisely because those approximations leak money. If your strategy touches derivatives, wire in the real pricer.
Letting research and execution share a function. A single Lambda that both decides and trades is convenient until a config change causes it to fire unintended orders. Separate the decision from the action, require an explicit approval artifact, and keep execution credentials scoped to the execution function only.

No reproducibility. If you cannot re-run last quarter's backtest and get the same numbers, you cannot debug a live drawdown. Version your data snapshots, pin package versions in the container image, and store the full parameter set with every run.
Underestimating data quality work. Corporate actions, survivorship bias, and timezone mismatches corrupt more backtests than bad models do. Budget as much time for validation as for strategy logic.
Decision framework: when to choose what
Not every strategy belongs on this stack, and not every component is mandatory. Use the following tests.

Choose R when your edge is statistical — factor models, regime detection, time-series forecasting, or portfolio optimization. Choose Python when your team already lives there and the strategy is more engineering-heavy than statistics-heavy. Both can call QuantLib; the choice is about where your researchers are productive.
Choose QuantLib when any instrument in the strategy has optionality, a term structure, or a non-trivial payoff. For plain cash equities with no derivatives overlay, you can skip it entirely and save the container complexity.

Choose Lambda when workloads are bursty, run on schedules, or need to fan out across hundreds of parallel scenarios. Choose a container service or EC2 when you need persistent connections to a streaming feed, sub-100ms response, or long-running stateful processes.
Choose paper trading first when the strategy is new, the broker integration is untested, or the position sizing logic has changed. Run the full pipeline against a simulated account for at least one full market cycle before committing capital.
The framework's value is in the early exits. Most failed quant projects die because the holding period or latency requirement was never matched to the architecture, and the team spent months optimizing a stack that could never have worked for that strategy.
Related questions
Can I run QuantLib inside an AWS Lambda function?
Yes. Compile QuantLib as a Lambda layer or bake it into a container image based on Amazon Linux. The RQuantLib package wraps the C++ library, so R code can call the pricer directly. Keep the layer under the 250 MB unzipped limit or use a container image, which allows up to 10 GB.
How much historical data do I need for a credible backtest?
Enough to cover multiple market regimes — typically ten years of daily bars or three to five years of minute bars. Fewer than 250 trades in the sample makes Sharpe estimates statistically fragile. Always hold out a recent period you never tuned against.
Is serverless fast enough for live order submission?
For strategies on minute bars or slower, yes. Round-trip latency through Lambda to a broker API is typically 100–500 ms. For sub-100 ms requirements, keep signal generation in Lambda but route execution through a persistent, colocated service.
How do I keep backtests reproducible?
Pin every dependency in a container image, snapshot the input data to a versioned S3 prefix, and store the full parameter set with each run in DynamoDB. If a run cannot be replayed byte-for-byte, treat it as unreproducible and fix the pipeline.
What is the biggest hidden cost in this stack?
Engineering time on data validation and reconciliation. Vendor feeds arrive with gaps, duplicate rows, and inconsistent timezones. Budget roughly as much effort for cleaning and monitoring as for the strategy itself.
FAQ
Do I need to know C++ to use QuantLib? No. RQuantLib and QuantLib-Python expose the library's core functionality through high-level bindings. You only need C++ if you are extending the library with custom instruments or pricing engines, which is rare for typical strategy work.
How do I handle Lambda cold starts in a trading context? Provisioned concurrency keeps a set number of execution environments warm, eliminating cold starts at a predictable hourly cost. For scheduled backtests, cold starts are irrelevant. For live execution, either enable provisioned concurrency or accept a few hundred milliseconds of added latency.
Can R and QuantLib run in the same Lambda invocation? Yes, if QuantLib is packaged as a layer or inside the container image alongside the R runtime. The combined image is larger, which slows cold starts, so many teams split pricing into its own function and call it only when the strategy needs a derivative value.
How do I model transaction costs in R backtests? PerformanceAnalytics and the blotter family of packages let you apply per-trade commissions and slippage assumptions. Simpler approaches subtract a fixed basis-point cost from each return. Whichever you choose, calibrate the assumption against your actual fills once live.
What monitoring should run in production? Track realized versus modeled slippage, order rejection rates, function error rates, and time since last successful data ingest. Alert on any of these drifting beyond a threshold you set during paper trading. Silent data staleness is the most dangerous failure mode.
Is this stack suitable for regulatory environments? It can be, provided you enable CloudTrail for API auditing, store logs immutably with S3 Object Lock, and enforce encryption at rest and in transit. Confirm specific retention and reporting rules with your compliance team, since requirements vary by jurisdiction and entity type.
Sources
- QuantLib documentation
- AWS Lambda developer guide
- CRAN Task View: Empirical Finance
- CRAN Task View: Time Series Analysis
- Amazon S3 user guide
- Amazon DynamoDB developer guide
- Interactive Brokers API documentation
- Alpaca trading API documentation
- AWS Well-Architected Framework
Related on PULSE
- [A Rust and WebAssembly Stack for High-Frequency Trading Systems](/knowledge/tk0360)
- [A Serverless AI Stack for Legal Document Review Using AWS Lambda and LangChain](/knowledge/tk0365)
- [Building a Serverless E-Commerce Backend: AWS AppSync, DynamoDB, and Stripe](/knowledge/tk0420)
- [A Bioinformatics Pipeline: Genome Assembly and Variant Calling with Nextflow, Conda, and AWS Batch](/knowledge/tk0441)
- [Modernizing the Mainframe: A COBOL-to-Cloud Migration Toolkit Using AWS DMS and Micro Focus Enterprise Server](/knowledge/tk0411)
This page will be disappearing soon. Save it to your device for $1 — or read it free while it is here.
@Kory-White- · if Venmo asks, the last 4 of my number are 2012
This page is gone.
This one is off the shelf now. $1 keeps it on your phone for good — the whole page, pictures and diagrams included.
 pulse-tech-stacksTop 10 Tech Stacks strategies for 2027
 pulse-tech-stacksTop 10 Database Management Systems for IoT Applications in 2027
 pulse-tech-stacksTop 10 Cross-Platform Tools for EdTech Mobile Apps in 2027
 pulse-tech-stacksTop 10 CI/CD Tools for Blockchain Development Teams in 2027
 pulse-tech-stacksTop 10 Open Source IDEs for Embedded Systems Engineers in 2027
 pulse-tech-stacksIs the Temporal Cloud worth its premium over self-hosted Cadence for a mid-size logistics tech stack in 2027?
 pulse-tech-stacksTop 10 IoT Tech Stacks for Smart Factory Monitoring in 2027
 pulse-tech-stacksWhat are the most common mistakes in Tech Stacks in 2027?
 pulse-tech-stacksTech Stack Consolidation: Cutting SaaS Spend by 40% in 2027
 pulse-tech-stacksThe Music Production Tech Stack: DAW Automation, Sample Management, and Collaboration with JUCE and Google Drive API