 Pulse Reviews and Analysis
Top 10 Retail Shopping Center REIT Revenue KPIs
 Curated by Kory White · Fractional CRO, CRO Syndicate
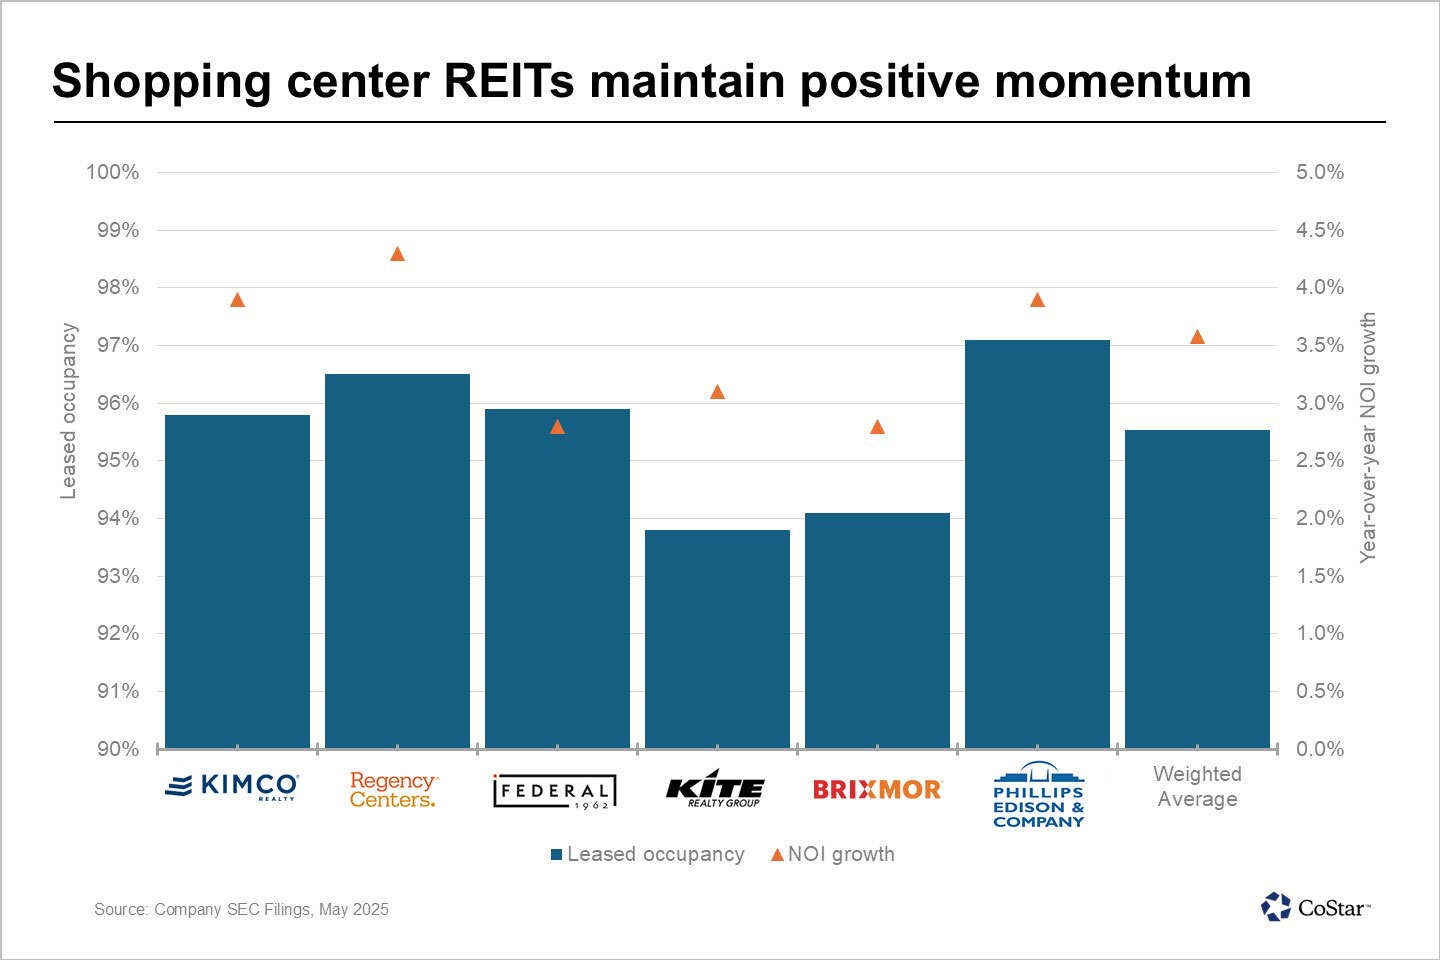
Direct Answer
Why Retail Shopping Center REITs Measure Differently
Retail REITs are not passive landlords. Their revenue depends on tenant sales performance because many leases include percentage-rent clauses (a share of sales above a breakpoint) and common area maintenance (CAM) pass-throughs. A regional-mall operator cares deeply about whether a tenant's store generates strong or weak sales per square foot—that number drives renewal probability, rent growth, and the REIT's ability to refinance.
Industry research from Nareit and brokerages shows that shopping-center economics hinge on the occupancy cost ratio (rent + CAM as a percentage of tenant sales). When that ratio climbs too high, tenants start closing stores. Office REITs do not track this; industrial REITs do not either.
Retail REITs live and die by the consumer's willingness to walk through the door.
Another key difference: leasing velocity. A large mall or open-air REIT may sign hundreds of leases per quarter, each with different rent escalators, co-tenancy clauses, and termination options. The KPI suite must capture lease expirations, renewal probability, and net effective rent—not just average rent per square foot.
The Most Important KPIs to Track
1. Occupancy Rate (Economic vs. Physical)
Definition: Physical occupancy is the percentage of leasable square feet occupied. Economic occupancy adjusts for rent abatements, free rent periods, and dark stores still paying base rent.
Benchmark: Top-tier (A) malls run very high physical occupancy; B- and C-class assets sit lower, and a property that falls too far can enter a downward spiral as tenants leave and CAM cost per remaining tenant rises. A gap between physical and economic occupancy signals aggressive rent concessions—watch for it.
2. Rent per Square Foot (Base + Percentage)
Definition: Total base rent plus percentage rent (overage) divided by total leased square feet. Percentage rent is the landlord's share of tenant sales above a threshold.
Benchmark: Rent per square foot varies sharply by format—productive regional malls run well above power centers (big-box-anchored), and trophy/luxury centers run far higher still.
Tool: CoStar provides market-level rent comps. REITs track lease-level rent rolls in Yardi or MRI Software.
3. Sales per Square Foot (Tenant Sales)
Definition: Gross sales of all tenants divided by total leasable square footage. This is one of the best predictors of future rent growth.
Benchmark: Top-tier malls post far higher tenant sales per square foot than B-class centers; below a healthy threshold, a center is at risk of losing anchor tenants. The spread between high- and low-productivity malls is a primary driver of valuation differences.
4. Rent as a Percentage of Tenant Sales (Occupancy Cost Ratio)
Definition: Total occupancy cost (base rent + CAM + property taxes + insurance) divided by tenant sales. Also called the occupancy cost ratio (OCR).
Benchmark: Inline tenants typically run a low-double-digit OCR; anchors run much lower because they drive traffic. When OCR climbs too high, tenants will not renew.
Why it matters: Operators use OCR to set renewal rents. A low tenant OCR creates room to push rent at renewal; a high OCR forces concessions.
5. Leasing Spreads (Cash vs. GAAP)
Definition: Cash leasing spreads compare new lease base rent to the expiring lease's base rent. GAAP spreads include straight-line rent adjustments and free rent periods.
Benchmark: Positive cash spreads indicate pricing power; sustained negative spreads signal a weak market or poor asset quality. Open-air, grocery-anchored REITs have generally posted healthy positive spreads in recent cycles.
6. Tenant Sales Growth (Year-over-Year)
Definition: Same-store sales growth for all tenants in the portfolio. Excludes new tenants and stores open less than 12 months.
Benchmark: Low-to-mid single-digit growth is healthy; sustained declines trigger lease-renegotiation risk.
Tool: Foot-traffic analytics from Placer.ai correlate with sales. REITs also collect monthly tenant sales reports.
7. Anchor vs. Inline Tenant Mix
Definition: Percentage of square footage leased to anchor tenants (typically large-format) vs. Inline tenants (smaller shops). Anchors pay lower rent but drive foot traffic.
Benchmark: A balanced mix supports both traffic and rent per square foot. Too much anchor space depresses rent per square foot; too little starves the center of traffic.
8. Co-tenancy Risk
Definition: Percentage of leases with co-tenancy clauses that allow rent reduction or lease termination if an anchor closes or occupancy thresholds are not met.
Benchmark: A modest share of leases typically carries co-tenancy clauses; a high concentration is dangerous because one anchor closure can trigger a cascade of rent reductions.
9. CAM Recovery Rate
Definition: Percentage of common area maintenance costs (snow removal, lighting, security) recovered from tenants. Many leases are triple-net, so tenants pay CAM, but vacancy and abatements reduce recovery.
Benchmark: Well-run centers recover the large majority of CAM; a low recovery rate means the REIT is absorbing costs.
Tool: MRI Software and Yardi automate CAM reconciliation and recovery tracking.
10. Net Operating Income (NOI) Margin
Definition: (Gross revenue - operating expenses) / gross revenue. Excludes interest, depreciation, and corporate overhead.
Benchmark: Well-managed centers run NOI margins in the 60s-to-low-70s percent; a margin well below that suggests the property is struggling. Distressed B/C-class operators have historically run far lower before restructuring.

Reach Kory White, Fractional CRO: 📅 Book a Quick Call · 💼 Kory on LinkedIn · 🏢 CRO Syndicate
Real Operators
The public retail REITs illustrate how these KPIs map to strategy:
- Simon Property Group (NYSE: SPG) is the largest U.S. Retail REIT, operating premium malls and outlets. It discloses portfolio occupancy, base rent per square foot, and tenant sales per square foot each quarter, and manages renewals against tenant OCR.
- Kimco Realty (NYSE: KIM) focuses on grocery-anchored open-air centers and reports leasing spreads and occupancy, leaning on the resilience of essential retail.
- Macerich (NYSE: MAC) operates regional Class-A malls and tracks co-tenancy exposure and CAM recovery closely given its enclosed-mall format.
- Brixmor Property Group (NYSE: BRX) runs a large open-air portfolio and emphasizes leasing spreads and re-tenanting of anchor boxes.
Operationally, retail REITs pair property management (Yardi, MRI Software) with foot-traffic analytics (Placer.ai), CRM/forecasting (Salesforce, Clari), and third-party research (Green Street, CBRE, JLL). The historical distress of weaker mall operators (several of which went through Chapter 11 as anchors closed) is a real reminder of these risks—verify any specific occupancy, sales-per-square-foot, or spread figure against each REIT's latest disclosures before citing it.
Failure Modes
- Ignoring co-tenancy risk: Heavy co-tenancy exposure means a single anchor closure can trigger cascading rent reductions across inline tenants—a dynamic that contributed to several enclosed-mall bankruptcies.
- Chasing occupancy over rent quality: Backfilling vacancy with low-credit, low-rent tenants depresses sales per square foot and can begin a downward valuation spiral.
- Over-leveraging B-class assets: Borrowing heavily to renovate weaker malls without a corresponding lift in tenant sales has historically led to defaults.
- Poor CAM recovery: A recovery rate below target means the REIT absorbs operating costs that should be passed through, eroding NOI margin.
- Ignoring tenant sales data: Not tracking sales per square foot blinds an operator to early warning signs of anchor or inline-tenant failure.
Reporting Cadence
- Daily: Foot traffic (via Placer.ai), tenant sales reporting, and leasing pipeline (via Clari).
- Weekly: Leasing spreads (cash vs. GAAP), CAM recovery rate, and anchor tenant health. Review a "red flag" report of tenants with high OCR.
- Monthly: Same-store sales growth, NOI margin, and co-tenancy risk. Present a KPI pack to leadership.
- Quarterly: Full portfolio review against Nareit and brokerage benchmarks, with occupancy, rent per square foot, and leasing spreads.
- Annually: Third-party NAV/cap-rate review (e.g., Green Street) to inform capital allocation and dividend policy.
30-60-90
Days 1-30: Audit your current KPI stack. Pull 12 months of data for occupancy, sales per square foot, and OCR. Identify assets below your occupancy threshold or with elevated OCR. Generate a baseline report in Yardi or MRI Software.
Days 31-60: Implement a daily dashboard with Clari for leasing pipeline, Placer.ai for foot traffic, and your PM platform for tenant sales. Set up alerts for co-tenancy risk (e.g., a meaningful anchor sales decline). Run a structured review on your top leasing conversations to find where renewals are failing.
Days 61-90: Present a KPI improvement plan to leadership. Target improved cash leasing spreads by renegotiating a slice of expiring leases. Use Salesloft or Outreach to sequence tenant renewal offers. Benchmark against peer disclosures and set a goal to reduce co-tenancy exposure by re-leasing anchor spaces.
FAQ
What is the most important KPI for a retail REIT? Occupancy is the foundation, but sales per square foot is the leading indicator—when tenant sales weaken, occupancy tends to follow.
How do I calculate rent as a percentage of tenant sales? Divide total occupancy cost (base rent + CAM + taxes + insurance) by the tenant's gross sales. For example, $50,000 in rent and CAM on $400,000 of sales is a 12.5% OCR.
What is a healthy leasing spread? Positive cash spreads indicate pricing power. Sustained negative spreads mean you are cutting rents to fill space—a sign of weak demand.
How often should I review co-tenancy risk? Monthly. Co-tenancy clauses are triggered by anchor closures, which can happen on short notice, so track the share of leases with co-tenancy exposure.
What tools do retail REITs use for KPI tracking? Yardi and MRI Software for property management and CAM recovery, Salesforce for lease management, Clari for forecasting, Placer.ai for foot traffic, and Gong for leasing-call analysis.
How do I benchmark my REIT against peers? Use Green Street for NAV and cap rates, Nareit for sector performance data, and CBRE or JLL for market-level rent and occupancy comps.