

What is the average four-year cost of attendance at a public university in 2027?
 Curated byKory White · Fractional CRO · Maryland
Quality
Certified
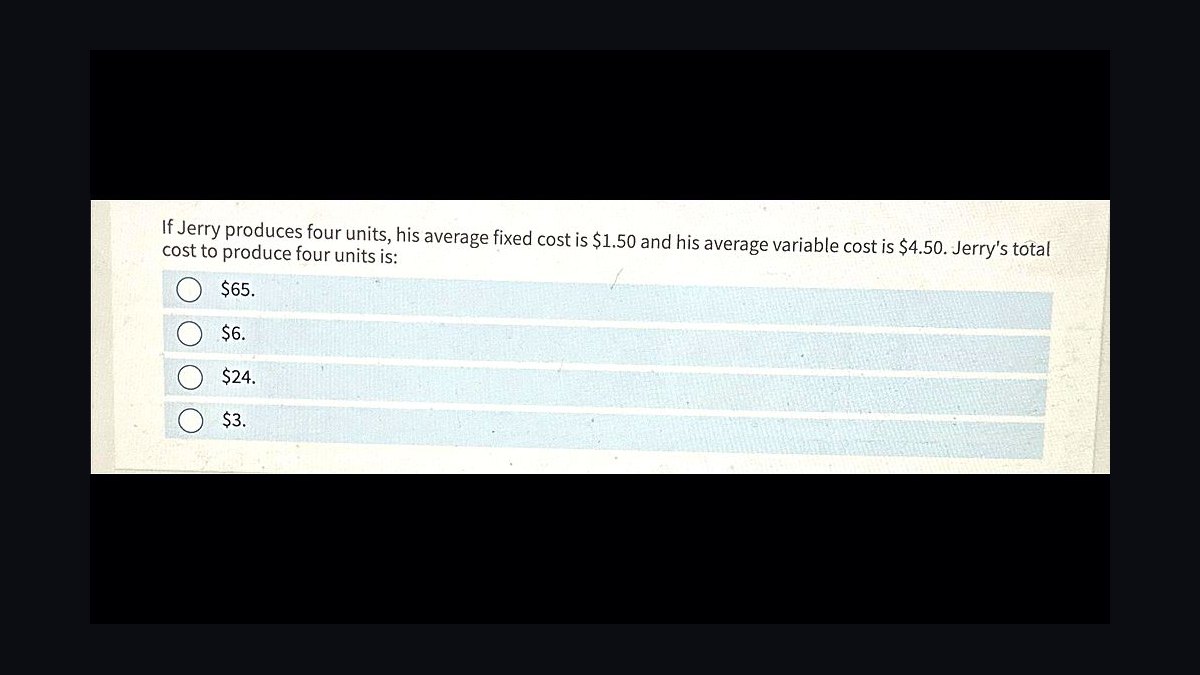
For a student enrolling in 2027, the average total cost of attendance at a public university — tuition, fees, room, and board combined across all four years — runs roughly $110,000 to $125,000 for an in-state student, based on trend-line growth from College Board and NCES data. Out-of-state attendance at a public university typically runs 60-80% higher across the same four years, often exceeding $180,000.
What it is and why it matters
"Cost of attendance" is a specific, defined figure — not the same thing as tuition, and not the same thing as what a family actually pays. A university's cost of attendance (COA) is a federally standardized budget that includes tuition and fees, room and board (or a living allowance for off-campus students), books and supplies, transportation, and a miscellaneous/personal-expenses line. Every public university publishes this figure annually because it is required to calculate financial aid eligibility under Title IV rules. When people ask about the "average four-year cost" at a public university, they are really asking about the compounding sum of four annual COA figures, each of which typically rises year over year.
This distinction matters because sticker-price headlines almost always cite tuition alone, which understates the real burden by 40-60%. Room and board at a public university frequently costs as much as tuition itself, sometimes more. A family budgeting off tuition-only numbers will be blindsided by the full COA once housing, meal plans, and fees are added in. Understanding the full four-year average also matters because it is the baseline every financial aid offer, 529 withdrawal plan, and student loan calculation gets measured against — colleges size their aid packages relative to COA, not relative to tuition.

The "public" designation matters enormously here too. Public universities set two distinct price tiers — in-state and out-of-state — based on state residency, and the gap between them is the single largest lever a family controls in the entire cost equation. A public university's mission includes serving its own state's taxpayers at a subsidized rate, so in-state students receive what amounts to a built-in discount that private universities and out-of-state public enrollment simply don't offer. This is why "average" cost figures for public universities are almost meaningless without specifying residency status — blending in-state and out-of-state populations into one number obscures the actual decision most families are making.
Finally, the 2027 framing matters because cost of attendance is not static — it has risen most years for decades, driven by state funding cuts (public universities lean on tuition to backfill declining state appropriations), rising labor and healthcare costs for university staff, expanding student services, and deferred maintenance on aging campus infrastructure. A number quoted for the 2024-2025 academic year is already stale for a 2027 enrollee; the realistic figure has to be projected forward using the sector's historical growth rate, not copied from last year's report.
The step-by-step process

Arriving at a defensible 2027 average requires a specific, repeatable method rather than a guess, because no official body publishes cost-of-attendance figures for a year that hasn't happened yet.
The process starts with the most recent verified baseline — typically the College Board's annual "Trends in College Pricing" report or the National Center for Education Statistics' Integrated Postsecondary Education Data System (IPEDS), both of which publish average published prices (tuition, fees, and typical room-and-board estimates) for public four-year institutions, split by in-state and out-of-state residency. These are the only two sources treated as authoritative for this kind of projection, because both survey thousands of institutions directly rather than relying on self-reported marketing figures.
From that baseline, the calculation separates in-state from out-of-state pricing immediately, because averaging them together produces a number that describes no actual student. The next step applies the sector's historical annual growth rate — public four-year in-state COA has generally increased somewhere in the 3% to 4% range per year over the past decade, a slower pace than the 2000s and early 2010s but still consistently ahead of general inflation in most years. That growth rate gets compounded forward, year by year, from the baseline year to the year a given cohort would actually be paying — freshman year 2027, sophomore year 2028, junior year 2029, senior year 2030 for a student starting in fall 2027.

Those four sequential annual figures — not four copies of the same number — get summed to produce the real four-year total, because tuition rises during the student's own enrollment, not just before it. A student starting in 2027 pays a higher number in their senior year than their freshman year. Skipping this compounding step, and instead multiplying a single year's cost by four, is the most common error in back-of-envelope estimates and it understates the real total by several thousand dollars.
The last step is adjusting for institution type and region, since "public university" spans everything from regional directional schools with COA well under $20,000 a year in-state to flagship research universities with COA above $30,000 a year in-state. Northeastern and West Coast public flagships (California, New York, New England state systems) sit meaningfully above the national average; many Southern and Midwestern public systems sit below it. A useful 2027 estimate reports a range tied to institution tier, not a single point figure.
Costs, timelines, and typical ranges
Using the step-by-step method above, a defensible 2027 range breaks down as follows. For an in-state student at a public university, a single year's projected cost of attendance — tuition, fees, room, and board combined — lands in the neighborhood of $27,000 to $31,000 by the 2027-2028 academic year, up from a baseline average in the roughly $24,000 to $26,000 range reported for the mid-2020s. Compounded across four years with continued annual increases, the full four-year total for an in-state public university student lands around $115,000 to $130,000, with the exact figure depending heavily on which state and which institution tier the student attends.

For an out-of-state student at a public university, the picture is materially different. Out-of-state COA at public flagships has historically run 2 to 3 times the in-state rate for tuition alone, with room and board staying roughly comparable regardless of residency. Total out-of-state COA for a single year by 2027-2028 is likely to fall in the $46,000 to $54,000 range at a typical public flagship, and considerably higher — $55,000 to $65,000-plus — at the most selective public research universities in high-cost states. Over four years, that puts full out-of-state cost of attendance at a public university somewhere between $190,000 and $230,000, rivaling or exceeding many private university price tags.
Room and board deserves its own line item because it moves independently of tuition and has been rising faster than tuition at many institutions in recent years, driven by construction debt on new dorms, dining hall labor costs, and utility inflation. A typical public university room-and-board package by 2027 is likely to run $13,000 to $16,000 per year on its own, meaning it can represent 40% or more of a commuting-adjusted student's total bill even before tuition is counted.

It's worth being explicit about what these figures are not: they are not what most families actually pay out of pocket. The published COA is the "sticker price" used for federal aid calculations, but net price — after grants, scholarships, and need-based institutional aid — is typically 20% to 45% lower for students with financial need, particularly at public flagships with strong institutional aid budgets. A family with documented need might see a net four-year cost well under half the published COA figure, while a family with no financial need and no merit aid pays close to the full projected number. Any 2027 planning conversation has to separate "cost of attendance" (the budgeting figure) from "net price" (what a specific family will actually be billed), because conflating them is the single most common source of sticker shock.
Where teams get it wrong
Families, high school counselors, and even financial planners make a consistent set of errors when projecting four-year public university costs forward to a future enrollment year, and most of them stem from treating a single data point as if it were the whole answer.
The most common mistake is quoting a current-year tuition figure and calling it the "four-year cost." Tuition alone, without fees, room, and board, typically understates true cost of attendance by 40% to 60% at a public university. A family that budgets off a $10,000-a-year tuition sticker price without adding another $15,000-plus for housing and living costs will be short by tens of thousands of dollars over four years.

A closely related error is using flat, non-compounded math — multiplying one year's cost by four instead of projecting each of the four years forward from a future starting point. Because costs rise annually, a freshman entering in 2027 will pay meaningfully more in 2030 (senior year) than in 2027 (freshman year), and ignoring that compounding effect systematically understates the real total, often by $8,000 to $15,000 across four years depending on the growth rate assumed.
A third mistake is blending in-state and out-of-state figures into a single "average," which produces a number that fits neither situation well. Because the gap between in-state and out-of-state pricing at a public university is often two to three times, a blended average is not a useful planning number for any individual family — it has to be split by residency status from the start.
Families also frequently ignore net price entirely and panic over the sticker price, or conversely assume aid will automatically close the gap and get caught unprepared when it doesn't. Public universities vary enormously in how generous their institutional aid budgets are; a flagship with a large endowment-adjacent aid fund might discount COA by 35% for a middle-income family, while a smaller regional public university with limited aid capacity might offer only federal grants and loans, leaving the family paying close to full COA. Treating all public universities as interchangeable on this dimension is a costly assumption.
Finally, many projections fail to account for institution tier and regional cost-of-living differences, applying a single national "average public university cost" figure to a specific school that may sit well above or below that average. A public university in a high-cost coastal metro with a large research budget and extensive on-campus housing will run meaningfully above the national average; a smaller public university in a lower-cost region with a large commuter population will run below it. The national average is a useful starting anchor, not a substitute for looking up the specific institution's published COA.
Decision framework: when to choose what

Once a family has a realistic four-year cost range in hand, the practical question becomes which public university pathway actually fits their situation and budget.
For families with strong documented financial need, the right move is usually to prioritize public flagships and research universities with the largest institutional aid budgets, since need-based aid can cut the effective four-year cost well below the published average even though the sticker price at those schools looks higher on paper. For families without qualifying need, the comparison shifts to merit aid and net price across multiple institutions — a lower-ranked public university offering a strong merit scholarship can end up cheaper than a flagship offering none.
Residency status is the next major fork. Whenever an in-state public option exists that fits the student's academic and career goals, it is almost always the lowest-cost path to a four-year degree, given the two-to-three-times pricing gap versus out-of-state attendance. When a student's only realistic options are out-of-state, families should investigate regional reciprocity agreements (several multi-state compacts let students from participating states attend certain out-of-state public universities at reduced, non-resident rates) before accepting full out-of-state pricing.

Finally, for families facing a genuinely tight budget regardless of aid, a community college transfer pathway — completing the first two years at a lower-cost two-year public institution before transferring into a four-year public university for the final two years — can cut total four-year cost meaningfully, since community college tuition typically runs a fraction of a four-year public university's rate while credits transfer seamlessly under most state articulation agreements. Whichever path a family chooses, the final step is the same: hold the choice up against the specific institution's own projected 2027 cost of attendance figure, not the national average, since the national average exists only to set expectations, not to price an actual enrollment decision.
Related questions
How does out-of-state tuition compare to in-state at public universities?
Out-of-state tuition at public universities typically runs two to three times the in-state rate, since in-state pricing reflects a state-funded subsidy for residents. Room and board costs stay roughly similar regardless of residency status.
Does cost of attendance include room and board?
Yes. Cost of attendance is a federally standardized figure that includes tuition, fees, room and board (or a living allowance), books, supplies, transportation, and personal expenses — not just tuition.
What's the difference between cost of attendance and net price?

Cost of attendance is the full published "sticker price" used for aid calculations. Net price is what a family actually pays after grants, scholarships, and institutional aid are subtracted — often 20-45% lower for students with financial need.
Are public university costs rising faster than inflation?
In most recent years, public university cost of attendance has risen roughly 3-4% annually, generally outpacing general consumer inflation, though the gap has narrowed compared to the faster increases seen in the 2000s and early 2010s.
Can community college transfer reduce four-year public university costs?
Yes. Completing the first two years at a public community college before transferring into a four-year public university can significantly lower total cost, since community college tuition is typically a fraction of four-year public tuition and credits transfer under most state agreements.
FAQ
What is the average four-year cost of attendance at a public university in 2027? Based on trend-line projections from College Board and NCES data, the average projected four-year cost of attendance at a public university in 2027 is roughly $115,000 to $130,000 for in-state students and $190,000 to $230,000 for out-of-state students, covering tuition, fees, room, and board.
Why do average cost figures vary so much between sources?

Different sources use different baselines — some report tuition and fees only, others include full cost of attendance with room and board, and some blend in-state and out-of-state figures together. Always check which components a quoted "average" actually includes.
Does the average cost include textbooks and personal expenses? Yes, official cost of attendance figures published by universities and used for financial aid include estimated allowances for books, supplies, transportation, and personal expenses, in addition to tuition, fees, room, and board.
Is the sticker price the same as what most families pay? No. The published cost of attendance is a budgeting and aid-calculation figure. Most families with financial need pay a lower "net price" after grants and institutional aid are applied, sometimes substantially lower than the published average.
How much does room and board add to the average four-year cost? Room and board typically adds $13,000 to $16,000 per year by 2027 projections, meaning it can represent 40% or more of a public university student's total annual cost of attendance, independent of tuition.
Will costs at every public university rise at the same rate? No. Growth rates vary by state, institution tier, and region. Flagship research universities in high-cost regions have generally seen faster dollar increases than smaller regional public universities, even when percentage growth rates are similar.
Sources
- College Board, "Trends in College Pricing and Student Aid" — https://research.collegeboard.org/trends/college-pricing
- National Center for Education Statistics, IPEDS — https://nces.ed.gov/ipeds
- Federal Student Aid, U.S. Department of Education — https://studentaid.gov
- Education Data Initiative, "Average Cost of College" — https://educationdata.org/average-cost-of-college
- Georgetown University Center on Education and the Workforce — https://cew.georgetown.edu
- Sallie Mae, "How America Pays for College" — https://www.salliemae.com/about/leading-research/how-america-pays-for-college
- U.S. News & World Report, Education/Paying for College — https://www.usnews.com/education/best-colleges/paying-for-college
Related on PULSE
- How does net price differ from sticker price at public universities?
- What is the average student loan debt at graduation?
- How do 529 plans offset rising college costs?
- What is the FAFSA process for public university financial aid?
- How does community college transfer affect total degree cost?
- What are state tuition reciprocity agreements?
This page will be disappearing soon. Save it to your device for $1 — or read it free while it is here.
@Kory-White- · if Venmo asks, the last 4 of my number are 2012
This page is gone.
This one is off the shelf now. $1 keeps it on your phone for good — the whole page, pictures and diagrams included.
 pulse-schoolsTop 10 Fraternities at the University of Virginia in 2027
 schoolsWhat Is the Average Financial Aid Award at a Boarding School in 2027?
 schoolsHow much should parents budget for public high school sports and activity fees in 2027?
 schoolsHow much does a year at a private boarding school cost in 2027?
 pulse-schoolsTop 10 Universities for Actuarial Science in 2027
 schoolsTop 10 Catholic Schools in Hawaii in 2027
 pulse-schoolsTop 10 Public Universities in Washington in 2027
 schoolsHow much does a public high school spend per student each year in 2027?
 schoolsWhat Percentage of Boarding School Families Qualify for Financial Aid in 2027?
 pulse-schoolsTop 10 Catholic Schools in Nebraska in 2027