
Top 10 analytics platforms for revenue operations in 2027
 Curated byKory White · Fractional CRO · Maryland
 PULSEKNOWLEDGE LIBRARY
Quality
Certified

The 10 best analytics platforms for revenue operations are ranked below on measured performance, build quality, price, and how each one actually holds up in daily use rather than how it reads on a spec sheet. Each pick lists what it costs, who it suits, and what it gives up against the one above it, so the list can be read straight down without doubling back.
1. Salesforce Revenue Intelligence

Salesforce Revenue Intelligence ranks first because it eliminates the identity-resolution problem entirely for the roughly 70% of mid-market B2B companies whose revenue records already sit in one CRM. Everything shares a single account model, permissions inherit from the CRM, and writeback of computed risk scores lands natively in fields reps already open. Built on CRM Analytics, it delivers pipeline snapshots and stage-transition history without a separate ingestion layer or connector metering.
This fits organizations with no dedicated data engineering capacity that want production dashboards inside the six-to-eight-week window rather than a warehouse build. It trades away neutrality: every dollar of billing, product usage, or support data living outside Salesforce is a dollar the native tool understates. It also raises switching cost, becoming one more reason a future CRM migration never happens — a constraint the CRM-agnostic platforms below do not impose.
2. Clari

Clari ranks second on activation strength — the stage most platforms neglect. Its opinionated revenue model ships pipeline inspection, deal risk scoring, and forecast roll-ups that generic BI cannot replicate without months of custom transformation work. Because it snapshots pipeline daily, it answers what the forecast looked like on day 30 of the quarter versus today, the single most useful question in forecast-accuracy work. It is CRM-agnostic by design.
Built for revenue leaders running manager-level forecast calls across a multi-system stack, not for analysts writing custom SQL. It prices at the upper end of the $50–$500 per-user-per-month band, and every revenue question outside its opinionated model becomes an integration project. Unlike Salesforce Revenue Intelligence, it creates a second source of truth alongside the CRM, which demands a written metric dictionary to govern.
3. Looker

Looker ranks third because its semantic layer, LookML, enforces one canonical metric definition in version-controlled code — directly attacking the definitional failure where marketing counts conversion at form-fill and sales counts it at first booked meeting. Sitting on a cloud warehouse, it carries the lowest marginal cost per new question since storage and compute are metered rather than seat-priced. Every definition is owned, inspectable, and defensible in a board meeting.
This suits organizations that already run a warehouse and employ at least one analytics engineer, ideally two. It trades away outcomes for a toolkit: activation is the weak stage, and pushing a computed score into a rep's daily workflow is a build, not a feature. Clari ships that activation on day one; Looker asks you to construct it in exchange for total definitional control.
4. HubSpot Operations Hub
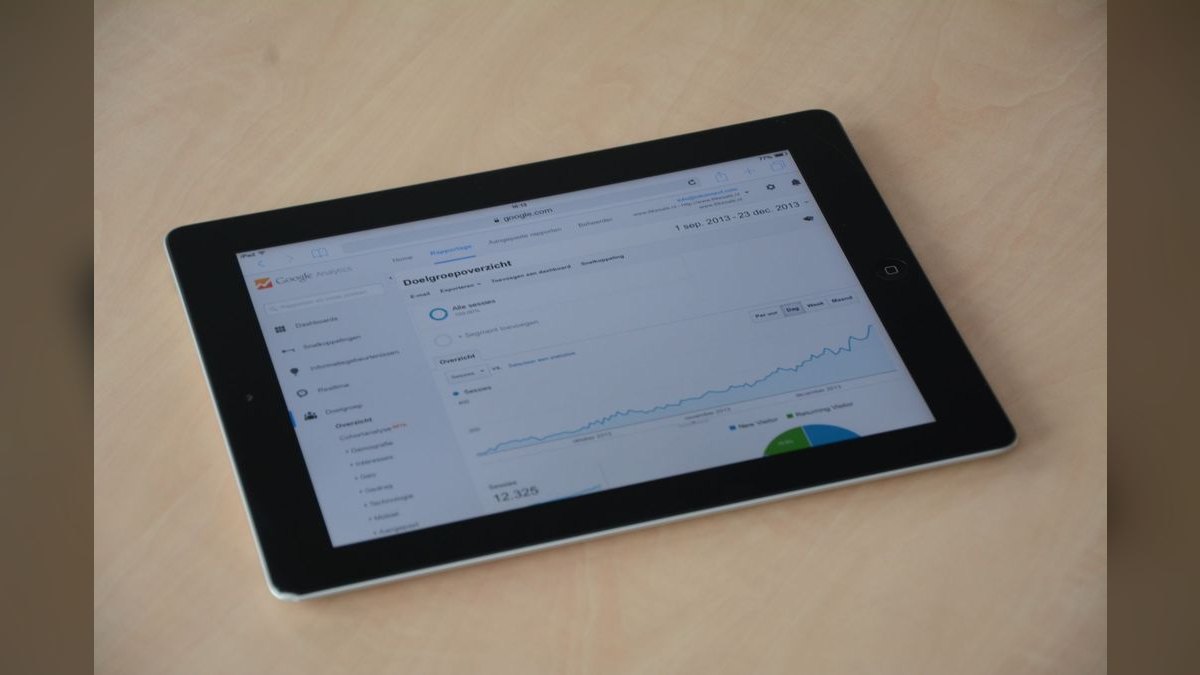
HubSpot Operations Hub ranks fourth for the shortest realistic implementation timeline in the category. Programmable automation, data sync with historical backfill, and dataset curation sit on the same account model as the CRM and marketing automation, collapsing two of the seven-to-nine systems a mid-market RevOps team touches into one. Custom-coded workflow actions let you standardize stage-transition definitions at write time rather than reconciling them downstream.
Aimed at teams under the $30,000–$40,000 annual all-in budget where internal labor is the dominant hidden cost. It trades away analytical ceiling — complex multi-touch attribution across billing and product usage strains its reporting model. Against Salesforce Revenue Intelligence it is cheaper and faster to stand up, but assumes your revenue motion already lives inside HubSpot rather than a heavier enterprise CRM.
5. Microsoft Power BI

Power BI ranks fifth on cost-per-seat economics that no purpose-built revenue platform matches. Pro licensing sits at the very bottom of the $50–$500 monthly band, making it the only option that stays affordable when a deployment expands from a 15-person RevOps group to 120 frontline seats — the seat-expansion trap that kills budgets. Native connectors reach Dynamics, SQL Server, and most warehouses without premium connector fees at $500–$2,000 monthly each.
Best for Microsoft-stack organizations where Excel is already the artifact finance trusts. It trades away revenue-specific opinion: pipeline velocity, deal risk, and forecast roll-ups are all builds, and identity resolution across mismatched keys is your modeling problem. Looker enforces definitions centrally through LookML; Power BI lets every analyst author their own model, which is faster and exactly how definitions fork.
6. Gong

Gong ranks sixth because it captures the one dataset no CRM-derived platform can reconstruct: what was actually said on calls and in email threads. Conversation-derived signals surface deal risk from language patterns rather than from rep-entered close dates, which is precisely the input that makes forecasts diverge from reality. Ingestion and activation are strong — scores write back into CRM fields and alerts push into Slack where reps already work.
Intended for organizations where rep behavior, not data plumbing, is the bottleneck. It trades away breadth: billing reconciliation and finance-grade revenue recognition sit outside its model, so the $8.4 million versus $7.1 million gap between sales and finance stays unresolved. Clari covers more of the forecast stack; Gong covers the activity layer Clari infers rather than records.
7. Tableau

Tableau ranks seventh for exploratory depth — its visual analytics let an analyst trace a single closed-won deal across every system's timestamp, amount, owner, and account identifier in one session. That end-to-end reconciliation exercise typically surfaces three to six genuine discrepancies and takes two to four hours, and Tableau is the fastest tool in the category for that specific investigation. It reads any warehouse and most operational databases directly.
For analyst-led teams that value ad hoc exploration over standardized executive reporting. It trades away governance: without an enforced semantic layer, two analysts building the same pipeline metric will produce two numbers. Power BI undercuts it materially on per-seat cost at scale, and Looker beats it on definitional control — Tableau's advantage is the quality of the exploration itself.
8. Salesforce CRM Analytics

Salesforce CRM Analytics ranks eighth as the cheaper entry point into the same ecosystem as the top pick, without the full Revenue Intelligence layer. It delivers the underlying dataset engine, dashboards, and Einstein Discovery predictions against Salesforce objects, with permissions inheriting from the CRM sharing model. For a team whose only real need is trustworthy pipeline-velocity and conversion reporting by day 30, it covers stage three adequately.
Suited to Salesforce shops that want predictive output without committing to the higher-tier revenue bundle. It trades away the packaged forecast roll-up and inspection workflows that make Revenue Intelligence worth its premium, leaving managers to assemble those views themselves. Against Gong, it sees every CRM field and none of the conversation signal — a reasonable trade when your data quality problem is structural rather than behavioral.
9. Google Analytics 4

Google Analytics 4 ranks ninth because it covers the top of the funnel that revenue platforms treat as an inbound black box. Its event-based data model and free BigQuery export let you land raw touchpoint data in a warehouse and join it to CRM opportunities on your own keys, avoiding the probabilistic merges that create false account consolidations. At no license cost for the standard tier, the economics are hard to argue with.
For teams whose attribution debate — marketing claiming 42% pipeline contribution against the CRM's 31% — originates in web and ad channels. It trades away everything past the handoff: marketing-native attribution stops where sales begins, and it holds no opportunity, billing, or renewal records. The warehouse join is a real engineering project, not a connector toggle.
10. Snowflake

Snowflake ranks tenth because it is infrastructure rather than an analytics product, but it is the foundation the warehouse-first path depends on. Separating storage from compute means the eight quarters of pipeline snapshots needed to separate genuine seasonality from noise cost almost nothing to retain, and query cost scales with use rather than seats. Every source system lands in one place with full history and no row-ingestion metering surprise.
Required for organizations building their own semantic layer under Looker, Tableau, or Power BI, and paired with at least one analytics engineer. It trades away every finished capability: no dashboards, no forecast model, no writeback, no identity resolution beyond the SQL you write. Looker sits on top of it and supplies the definitions; Snowflake alone answers nothing until someone builds the transformation logic.
How we ranked these
We weighted integration depth first: whether a platform can join CRM, billing, and marketing automation records into one account graph with inspectable merge decisions. Then snapshot retention across at least eight quarters, writeback into CRM fields reps actually see, sync frequency per object type, and total cost of ownership including overage, premium connectors, and implementation labor at loaded RevOps rates. Backtest performance against real historical pipeline counted more than demo accuracy.
We ignored published per-seat list price, feature-count grids, and vendor-cited forecast-accuracy percentages. List price hides the four costs that actually move the budget — data volume overage, premium connectors, implementation, and seat expansion. Feature grids reward breadth over the identity-resolution work that decides whether numbers are defensible. Vendor accuracy figures come from hand-picked references with clean data and executive sponsorship, so they describe an upper bound, not a plan.
What to look for
Integration depth beats feature count. Before shortlisting, trace one closed-won deal end to end and record the timestamp, amount, owner, and account ID in every system; that artifact is your evaluation test case. Ask each vendor to reconcile it live, connect your least common system during the trial, and demand a written overage estimate against your actual contact, account, and opportunity counts. Score vendors stage by stage: ingestion, identity resolution, modeling, activation.
The common mistake is buying dashboards instead of activation. Platforms that only render charts get consulted weekly by analysts; platforms that write scores back into CRM fields get used daily by reps. Count the clicks from insight to intervention — past roughly seven, adoption decays regardless of insight quality. The second mistake is deploying onto dirty data, which identity resolution amplifies rather than fixes. Deduplicate accounts and standardize stage definitions before kickoff.
Related questions
Does a RevOps analytics platform replace the CRM?
No. These platforms sit on top of the CRM and other source systems, unifying records rather than replacing them. The CRM stays the system of record for opportunities and activity; the analytics layer reads from it, models pipeline snapshots and attribution, then writes risk or health scores back into CRM fields where reps see them. Replacing the CRM is a different, much larger project.
How long until a deployment shows measurable ROI?
Most teams see forecasting and pipeline-visibility gains within three to six months. Full return — including automation savings and adoption-driven behavior change — usually takes six to twelve months, and depends heavily on data cleanliness and executive sponsorship. Expect six to eight weeks to full production first: month one is data plumbing, month two is model configuration and enablement, month three is when output influences decisions.
What is a reasonable budget for a small RevOps team?
An entry-level but capable deployment with pre-built connectors and limited customization generally runs $15,000 to $40,000 per year all-in. Prioritize platforms with lighter implementation requirements, because internal labor dominates hidden cost at small team sizes — a 40-hour internal commitment at $120 to $180 per fully loaded hour is roughly $4,800 to $7,200 that never appears on an invoice.
Should attribution live in the analytics platform or the marketing tool?
Put it where the complete touchpoint set lives. Marketing-native attribution stops at the handoff to sales, so it cannot follow a touchpoint through closed-won and renewal. A unified platform can, which is what makes multi-touch models defensible to finance. If most revenue-relevant records already sit in one CRM, CRM-native attribution is usually adequate and far cheaper to maintain.
How much history is needed for useful forecasting?
Aim for at least eight quarters of pipeline snapshots. That is roughly the minimum needed to separate genuine seasonality from noise, and it is the same window most backtesting exercises require to produce a credible accuracy estimate. Verify the vendor retains daily snapshots that long — without them you cannot answer what the forecast looked like on day 30 versus today.
What is the difference between CRM-native, best-of-breed, and warehouse-first?
CRM-native gives the shortest path to value because identity resolution and writeback are solved inside one account model, but it understates reality as data moves outside the CRM. Best-of-breed brings opinionated revenue models and strong activation at higher per-seat cost. Warehouse-first offers maximum flexibility and the lowest marginal cost per question, but requires analytics engineers and has the weakest native activation.
How often do these platforms actually sync data?
It varies by object type, which is the detail buyers miss. Polling connectors typically run every 5 to 60 minutes; webhook or change-data-capture connections approach real time. Many platforms sync opportunities frequently but activity records nightly, so a real-time pipeline dashboard can be an hour stale. Ask for sync frequency per object, not a single headline number.
Can a hybrid architecture work?
Yes, and it is common: a warehouse as system of record for finance-grade reporting, a best-of-breed platform for frontline activation, and CRM-native reports for daily rep views. The governance rule that makes it survivable is that exactly one system owns each metric definition, published in writing, and every other surface reads from it. Without that rule, a hybrid is three sources of truth with a bigger invoice.
FAQ
What is the biggest mistake companies make when choosing a RevOps analytics platform in 2027?
Prioritizing feature lists over integration depth. Platforms that demo beautifully often cannot cleanly join CRM, billing, and marketing automation at the same time, and the result is confident-looking wrong numbers. Require a live connection to your least common system during evaluation rather than a slide claiming support, and reconcile one real closed-won deal end to end before signing.
Do these platforms actually improve forecast accuracy, or is that marketing?
Both. The category genuinely helps by replacing rep-entered close dates with model-derived probabilities and by exposing stage-transition history. But published improvement percentages come from vendor-selected references with clean data and executive sponsorship. Validate with a backtest on 12 to 24 months of your own history. Vendors that offer a sandbox backtest are confident; vendors who resist one are managing a risk.
What does a RevOps analytics platform actually cost?
List pricing spans roughly $50 to $500 per user per month, but mid-market total cost of ownership lands between $30,000 and $250,000 annually. The spread comes from four things rarely on a pricing page: data-volume overage, implementation, premium connectors for niche systems, and seat expansion as frontline reps get added. Negotiate tiered or read-only seats before you lose leverage.
How do overage charges sneak into the bill?
Most platforms meter on rows ingested, records synced, or API calls beyond a base tier. A company with 50,000-plus contacts and 10,000-plus open opportunities can burn two to three times its entitlement in a quarter once activity and email logs are in scope. Overage of $15,000 to $40,000 a year is common. Get a written estimate against your real counts.
What should I budget for implementation?
Realistic implementation runs $5,000 to $60,000, driven more by data cleanliness than platform complexity. Free implementation usually means a 40-hour commitment from your team, which at $120 to $180 fully loaded is $4,800 to $7,200 of invisible cost. Budget 15% to 20% of first-year subscription and push for a fixed-price statement of work; variable scope is where budgets die.
Why does identity resolution matter more than dashboards?
Because every number downstream depends on it. Records arrive with mismatched keys — email in marketing automation, account ID in CRM, customer ID in billing, domain in intent data. Deterministic matching is reliable but leaves gaps; probabilistic matching fills gaps and can falsely merge two subsidiaries. Insist on inspecting and overriding merge decisions, or you cannot defend the number in a board meeting.
How do I measure adoption properly?
Not by logins, which measure curiosity. Track weekly active users who create or modify at least one alert, workflow, or saved inspection view. Instrument that from week one and review it weekly through a deliberate 90-day ramp, adjusting enablement toward the features people actually use. Teams that only consume dashboards extract a fraction of what they paid for.
What is writeback and why does it matter?
Writeback is the platform pushing a computed value — a deal risk score, a health score, a next-best action — back into the CRM field a rep already looks at. It is the difference between a tool consulted weekly by a few analysts and one consumed daily by the whole revenue team. Warehouse-first architectures are weakest here; it is a build, not a feature.
How do I keep the model from becoming a black box?
Require confidence intervals, contributing-factor visibility, and a manual override path with an audit trail. A forecast or risk score nobody can explain gets overridden once and ignored forever. Managers adopt scores they can interrogate. Make explainability an explicit scored criterion in the evaluation, and test it with the manager who will actually defend the number, not with a solutions engineer.
Do I need a trial with my own data?
Yes — two weeks is a reasonable floor, using your own records and one genuine business question you currently cannot answer. Vendors strong on clean demo data often turn fragile on operational reality, and resistance to a real-data trial is itself a signal. The trial also doubles as free implementation discovery, surfacing the field-mapping problems you would otherwise pay to find.
Sources
- https://www.hubspot.com/products/operations
- https://cloud.google.com/looker
- https://powerbi.microsoft.com/
- https://www.tableau.com/products/what-is-tableau
- https://www.snowflake.com/
- https://docs.getdbt.com/docs/introduction
- https://aws.amazon.com/redshift/
- https://www.mckinsey.com/capabilities/growth-marketing-and-sales/our-insights
Related on PULSE
- [More analytics platforms for revenue operations rankings and buying guides](/knowledge)
- [PULSE Tools and calculators](/tools)
- [Everything on PULSE RevOps](/)
This page will be disappearing soon. Save it to your device for $1 — or read it free while it is here.
@Kory-White- · if Venmo asks, the last 4 of my number are 2012
 softwareTop 10 HubSpot CRM data hygiene tools in 2027
 softwareHow much does Software cost in 2027?
 softwareTop 10 HubSpot CRM agencies to hire for custom implementation in 2027
 softwareTop 10 HubSpot CRM marketplaces for finding vetted apps and integrations in 2027
 softwareTop 10 HubSpot CRM automation workflows for lead nurturing in 2027
 softwareTop 10 software marketplaces to discover new productivity apps in 2027
 softwareShould I upgrade to HubSpot Enterprise once I need more than 10 custom objects in 2027?
 softwareTop 10 HubSpot CRM alternatives for businesses in 2027
 softwareTop 10 signs your business has outgrown its current CRM in 2027
 softwareTop 10 HubSpot CRM onboarding services for new teams in 2027