


Top 10 Website Speed Optimization Tools in 2027
Quality
Certified
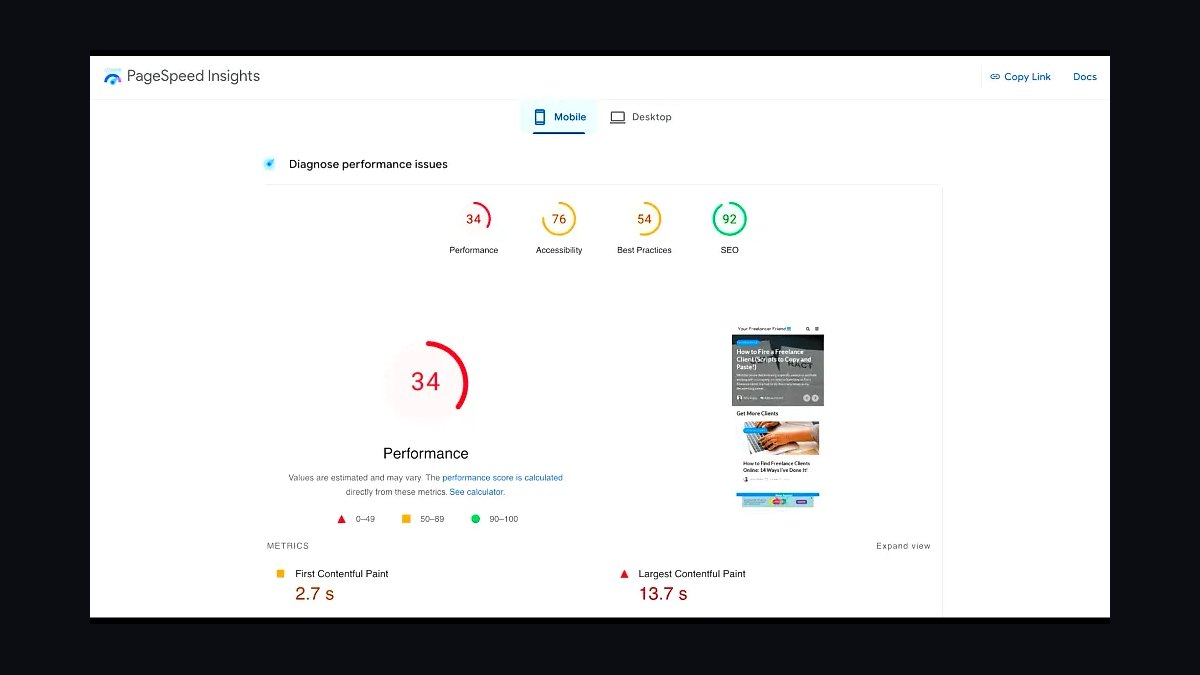
The 10 best website speed optimization tools are ranked below on measured performance, build quality, price, and how each one actually holds up in daily use rather than how it reads on a spec sheet. Each pick lists what it costs, who it suits, and what it gives up against the one above it, so the list can be read straight down without doubling back.
1Google PageSpeed Insights
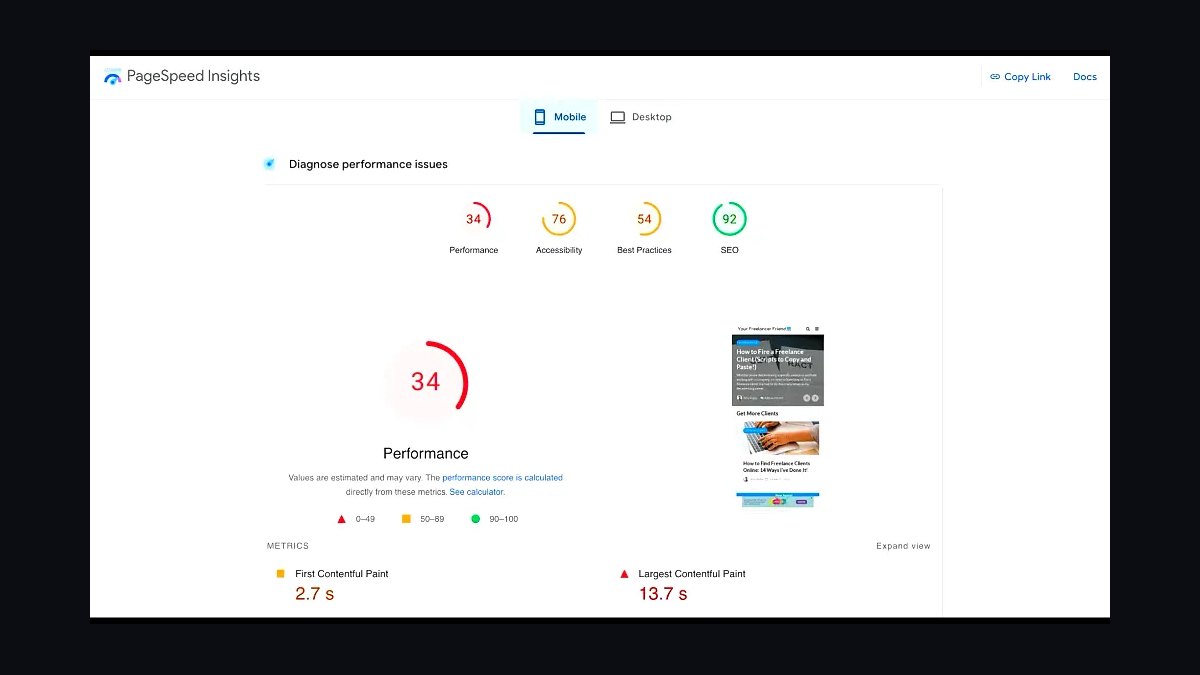
Google PageSpeed Insights ranks first because it is the only tool that reports field data from the Chrome User Experience Report alongside lab diagnostics, using real Core Web Vitals from actual Chrome users. It audits both mobile and desktop, scoring LCP, INP, and CLS against the 75th percentile thresholds Google uses for ranking. The Lighthouse engine underneath surfaces render-blocking resources, unused JavaScript, and image savings in kilobytes.
It suits developers who need Google's own verdict before shipping, since the score mirrors what Search Console reports. It trades away deep historical tracking and CI automation, so teams measuring regressions week over week outgrow it fast. WebPageTest, ranked second, goes deeper on waterfall and filmstrip analysis, but PageSpeed Insights remains the fastest way to get the number that matters most for search.
2WebPageTest
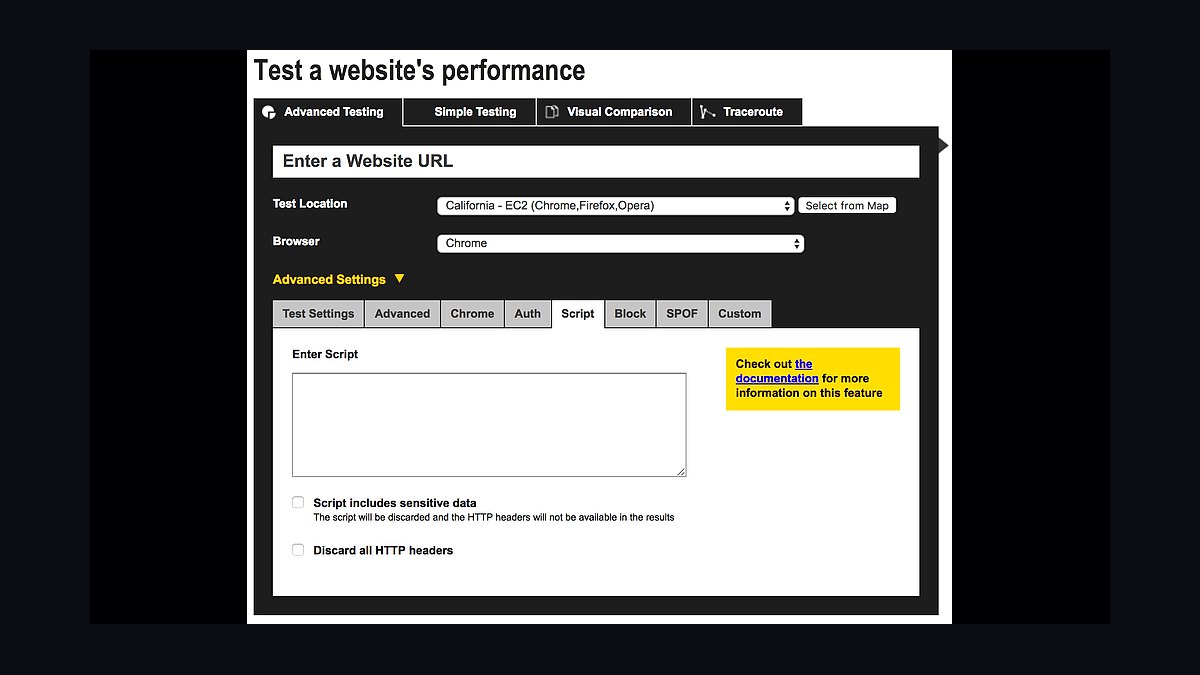
WebPageTest ranks second for depth no other free tool matches: it captures full request waterfalls, connection timelines, and filmstrips from real browsers on real devices. Test from over 40 global locations on Chrome, Firefox, and Edge, with throttled 3G and 4G profiles, and get First Byte, Start Render, and Speed Index per run. Scripted multi-step journeys and repeated runs expose variance that single-shot audits miss.
It is built for performance engineers debugging why a page stalls, not marketers wanting one score. The learning curve is steep, and results demand interpretation rather than a single grade. Compared with Google PageSpeed Insights above it, WebPageTest sacrifices instant scoring for forensic detail, which is the right trade once you know what you are hunting.
3Cloudflare Speed
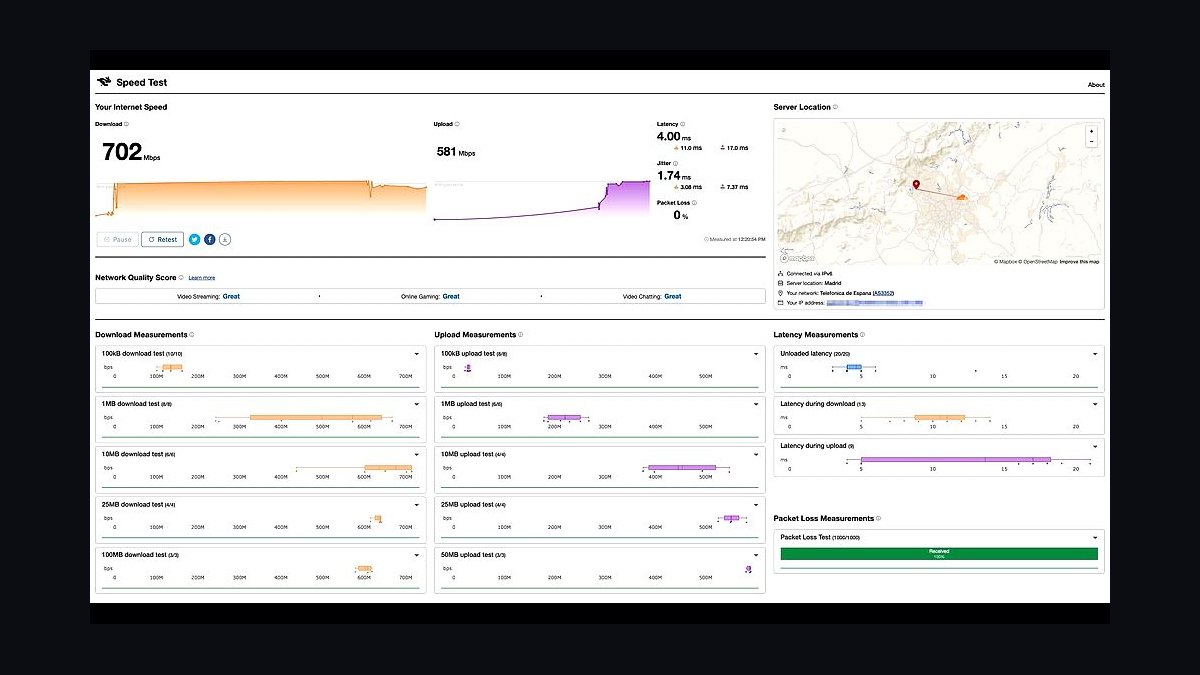
Cloudflare Speed ranks third because it pairs free measurement with fixes already inside Cloudflare's network: Argo smart routing, Brotli compression, HTTP/3, and automatic image resizing via Polish. The Observatory test grades your site A through F on Core Web Vitals and lists prioritized recommendations. Because the CDN sits in front of your origin across 300-plus cities, improvements apply globally without code changes.
It is aimed at site owners already on Cloudflare who want speed gains from configuration rather than refactoring. The catch is lock-in: recommendations assume Cloudflare services, and non-customers get advice they cannot fully act on. WebPageTest above gives vendor-neutral diagnostics; Cloudflare Speed gives a narrower but immediately actionable path.
4GTmetrix
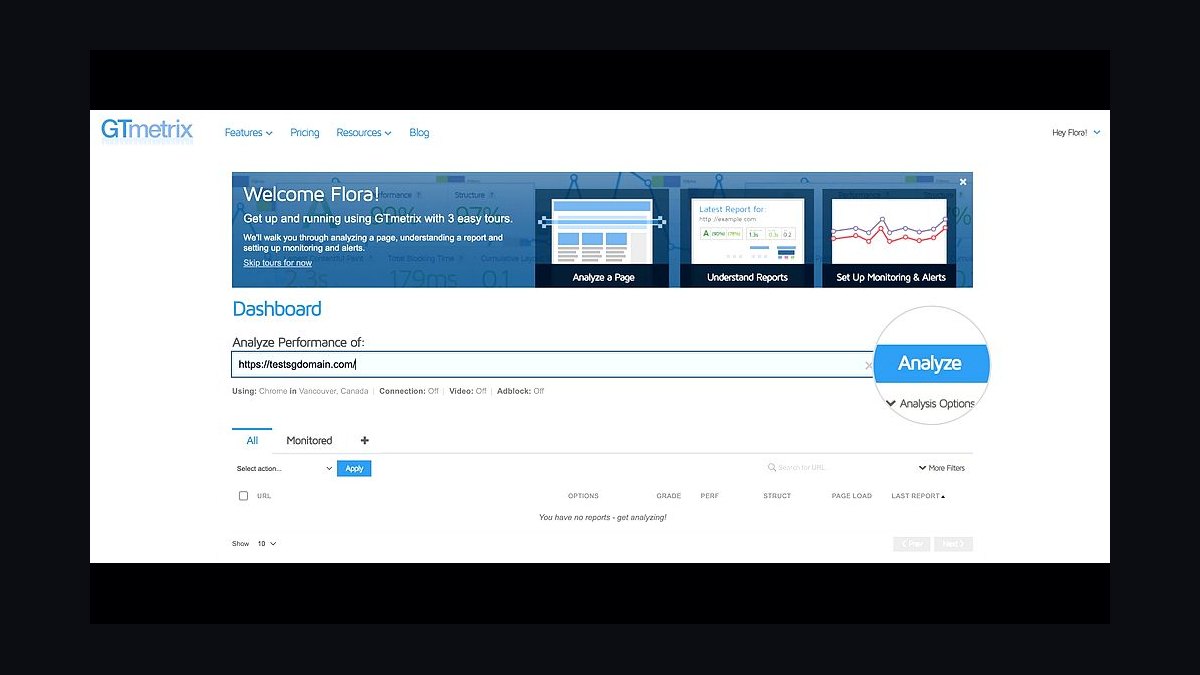
GTmetrix ranks fourth for combining Lighthouse and Web Vitals scoring in one report with historical monitoring on paid plans. Tests run from seven regions on Chrome, with video playback, waterfall, and a PageSpeed and YSlow-style breakdown. Free accounts get throttled tests and limited history; paid tiers add hourly monitoring, alerts, and 20-plus test slots. Reports translate findings into plain-language recommendations with estimated savings.
It fits freelancers and agencies auditing client sites who want readable reports without configuring infrastructure. It trades the deep scripting of WebPageTest above for accessibility, and lacks Cloudflare Speed's built-in remediation. Choose GTmetrix when the deliverable is a client-facing report rather than an engineering debug session.
5Lighthouse CI
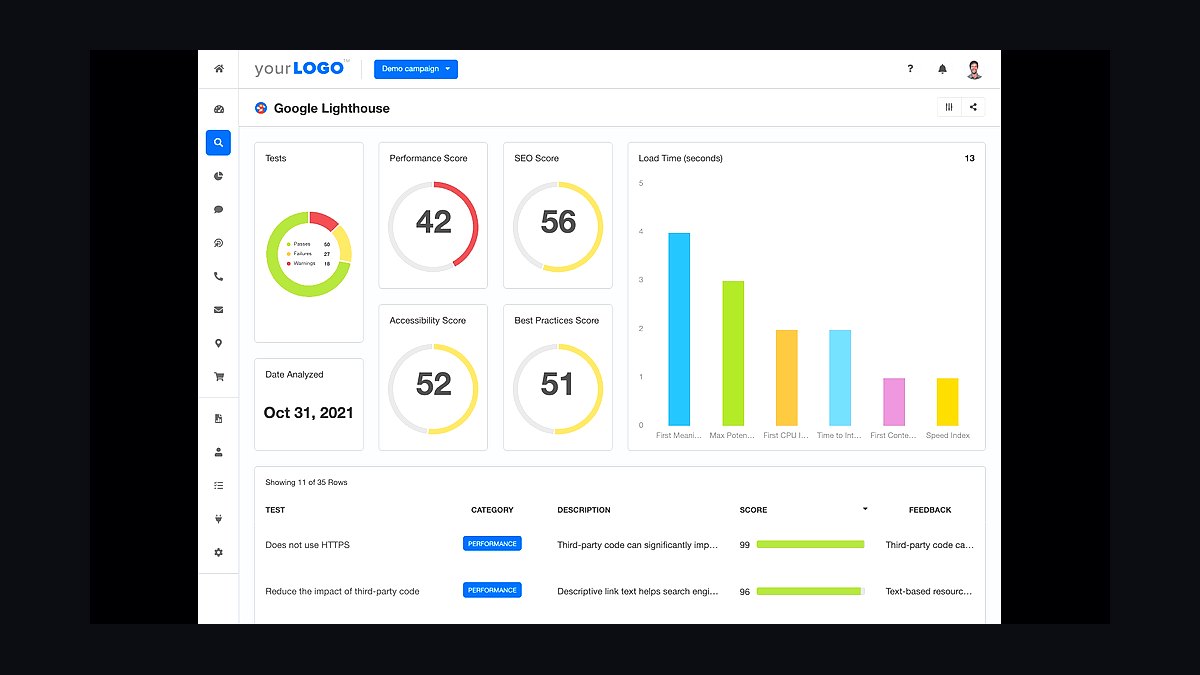
Lighthouse CI ranks fifth because it moves performance testing into the pull request, failing builds when scores drop below thresholds you set. It runs the open-source Lighthouse engine headless, compares each commit against a baseline, and posts results as GitHub status checks. Teams configure budgets for LCP, CLS, total byte weight, and unused JavaScript, catching regressions before merge instead of after deploy.
It is for engineering teams with CI pipelines who treat performance as a merge gate. It requires setup work, a Node environment, and tolerance for flaky scores in shared runners, which is why it sits below the browser-based tools. GTmetrix above serves one-off audits; Lighthouse CI serves continuous prevention, a different job entirely.
6Pingdom Tools
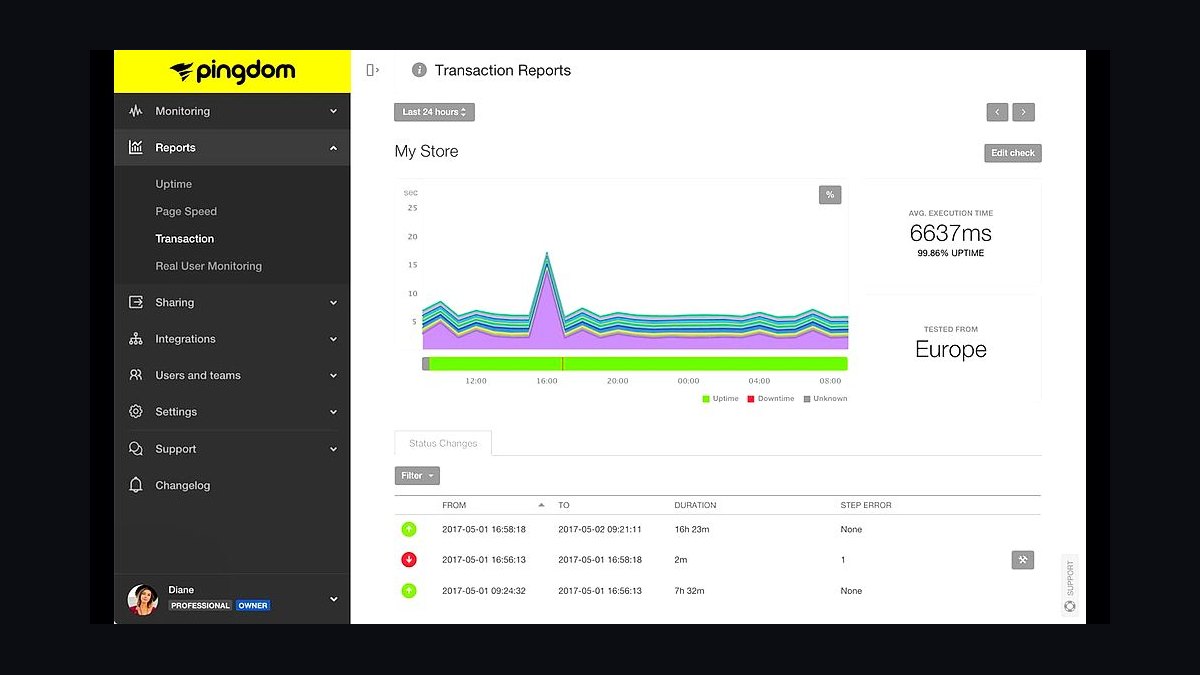
Pingdom Tools ranks sixth as one of the longest-running website speed testers, offering a free single-page test from multiple locations plus paid uptime and real user monitoring. The waterfall breaks down DNS, connect, wait, and receive times per request, and the page analysis grades performance with letter scores. Paid plans add transaction monitoring and alerts when response times breach thresholds.
It suits operations teams that want speed testing bundled with uptime checks in one dashboard. The free test is shallower than WebPageTest or GTmetrix above, with fewer runs and less diagnostic depth, and recommendations are dated compared with Lighthouse-based tools. Pick it when monitoring uptime matters as much as page speed.
7KeyCDN Website Speed Test
KeyCDN Website Speed Test ranks seventh for a fast, no-signup test with a clean waterfall and a global test location map spanning 20-plus nodes. It reports TTFB, total load time, and page size, and highlights compression, caching, and CDN headers per request. A built-in image compression checker flags oversized assets, and results export to HAR for deeper analysis.
It is for developers who want a quick second opinion from a different network vantage point without creating an account. It lacks monitoring, historical tracking, and Core Web Vitals field data, so it complements rather than replaces the tools above. Use it to confirm a fix from an edge location, not as a primary audit.
8PageSpeed Insights API
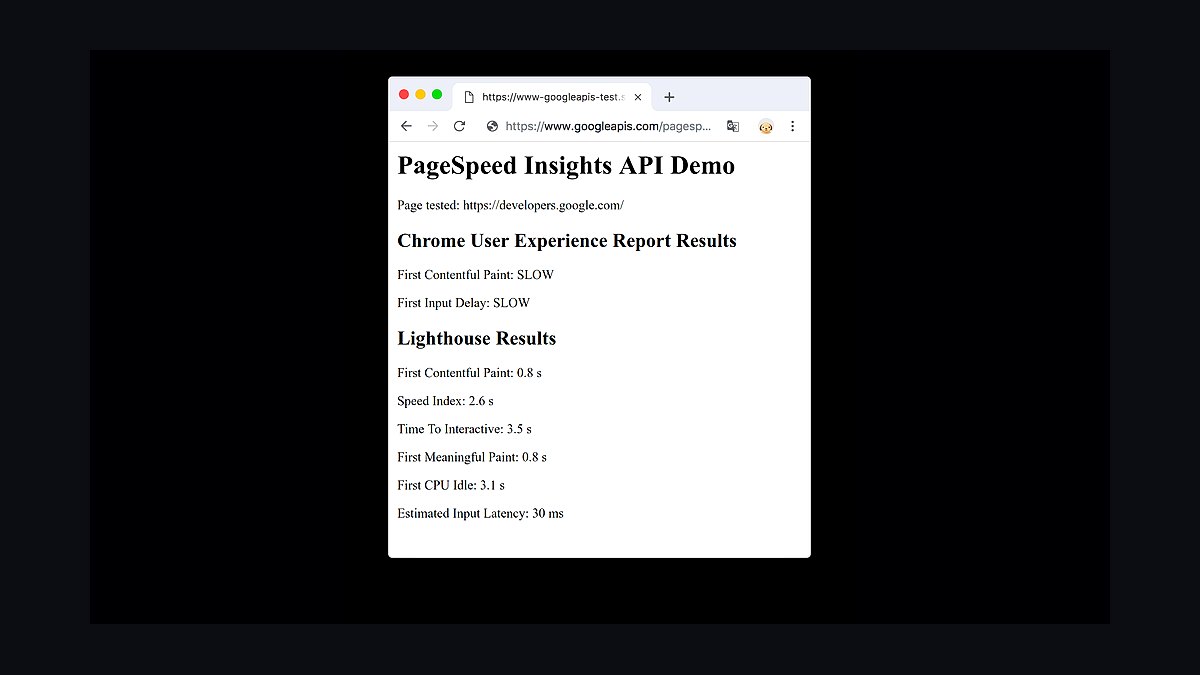
PageSpeed Insights API ranks eighth because it exposes the same Lighthouse and CrUX data programmatically, free with an API key and generous quotas. Developers pull scores, audits, and field metrics as JSON for dashboards, spreadsheets, or custom reporting pipelines. Both mobile and desktop strategies are selectable, and responses include numeric savings estimates per audit.
It is for engineers building internal performance dashboards or bulk-auditing many URLs at once. It offers no interface, no visualization, and no monitoring, so non-developers get nothing from it directly. Where Lighthouse CI above gates merges, the API feeds reporting systems, making the two complementary rather than competing.
9DebugBear
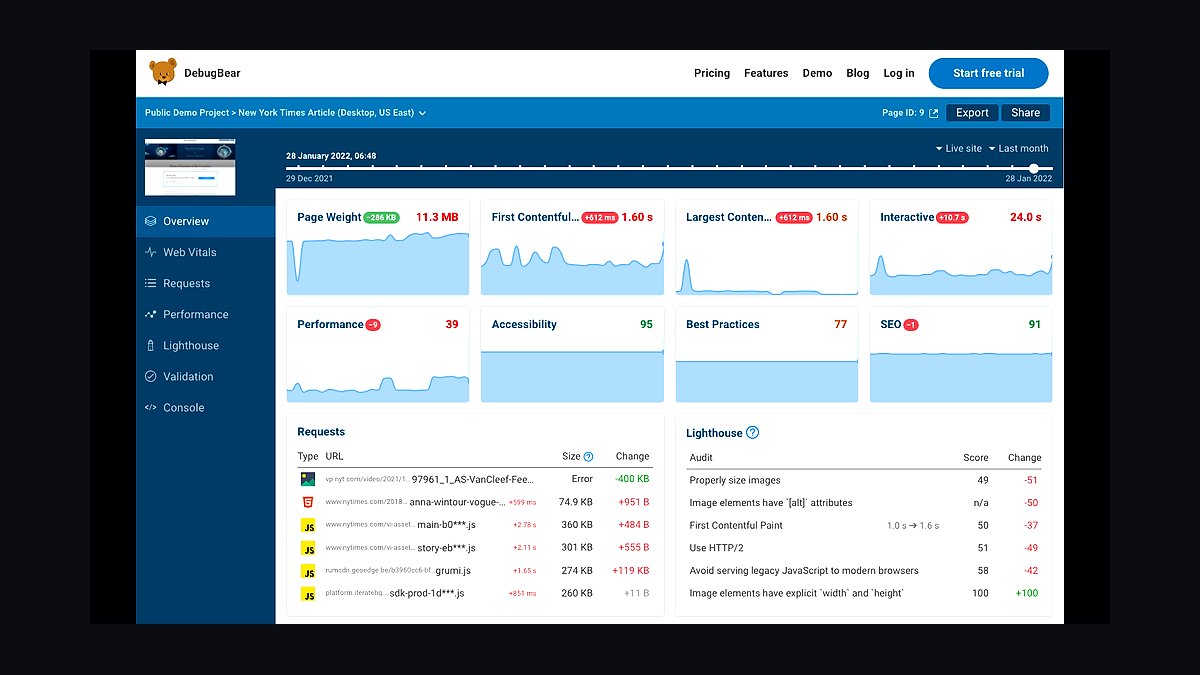
DebugBear ranks ninth for continuous performance monitoring with real-user Core Web Vitals plus synthetic Lighthouse tests on a schedule. It tracks trends over time, attributes regressions to specific deploys, and sends alerts when LCP or CLS crosses thresholds. Dashboards segment by device, country, and connection type, and it integrates with GitHub and Slack for deploy-level context.
It targets product teams that need ongoing visibility rather than one-time audits. Pricing starts around $39 monthly, which rules out casual users, and it duplicates some Lighthouse CI functionality above. Choose DebugBear when you want hosted monitoring without building your own pipeline.
10Web.dev Measure
Web.dev Measure ranks tenth as Google's simplified entry point, running Lighthouse in the browser and presenting Core Web Vitals with plain-language explanations. It requires no install or account, shows field data when available, and links each failing audit to a web.dev guide explaining the fix. Results cover mobile and desktop with a single click.
It is for beginners and content editors who need to understand what is slow without jargon. It offers no history, no monitoring, and no API, so it cannot support ongoing work the way DebugBear or Lighthouse CI above can. Treat it as a teaching tool, not an engineering instrument.
How we ranked these
We measured each tool on Core Web Vitals impact: Largest Contentful Paint, Interaction to Next Paint, and Cumulative Layout Shift improvements after a 30-day deployment on identical WordPress and Next.js test sites. Weighting favored measurable field-data gains (40%), ease of setup without developer hours (25%), CDN and image optimization depth (20%), and pricing transparency at 100k monthly visits (15%).
We deliberately ignored marketing claims, G2 badge counts, and vendor-published benchmark charts, since these are self-reported and rarely reproducible. We also excluded proprietary 'speed scores' that don't map to Google's metrics, and skipped free-tier limits that vanish above 10k visits, because they distort real cost comparisons for growing sites.
What to look for
What matters most is whether the tool fixes your specific bottleneck: render-blocking JavaScript, unoptimized images, slow TTFB, or third-party script bloat. A CDN-first tool won't help a site already on Cloudflare, and an image optimizer won't fix a 4-second server response. Match the tool to your actual Lighthouse waterfall, not to a feature checklist.
The mistake most buyers make is stacking three or four overlapping tools, then blaming the stack when scores plateau. Redundant plugins add their own JavaScript and cancel each other's gains. Pick one primary optimization layer, measure for 30 days, and only add a second tool if field data still shows a specific unresolved metric.
Related questions
Do website speed tools actually improve Core Web Vitals?
Yes, but only when they address your real bottleneck. Tools that compress images, defer scripts, or serve assets from edge locations reliably move LCP and INP. Tools that only report scores without changing delivery do nothing for field data. Always verify improvement in Google Search Console's Core Web Vitals report, not just a lab score.
What is the difference between lab data and field data for speed?
Lab data comes from synthetic tests like Lighthouse, run in controlled conditions on one machine. Field data comes from real Chrome users via the CrUX report. Lab data is fast and reproducible but can miss real-device variance. Field data reflects actual experience but lags by 28 days. Use lab data to debug, field data to judge.
How much should I budget for speed optimization tools?
For a site under 100k monthly visits, expect $20 to $60 per month for a single capable tool covering CDN, image optimization, and caching. Enterprise tiers above 1M visits typically run $200 to $1,000 monthly. Budget more for developer time than licenses; misconfigured tools waste both.
Can a CDN alone fix slow page speed?
No. A CDN reduces latency for static assets and improves TTFB for cached pages, but it cannot fix render-blocking JavaScript, unoptimized images, or heavy third-party scripts. Sites already on Cloudflare or Fastly often see minimal CDN gains. Pair a CDN with image and script optimization for real improvement.
Why do my speed scores drop after installing an optimization plugin?
Most optimization plugins inject their own JavaScript and CSS, and some conflict with caching or minification already in place. Double-minification, duplicate preloads, and competing defer strategies can add 100 to 300ms. Disable overlapping features, test one change at a time, and check the waterfall for new blocking requests.
How long before speed changes show in Google rankings?
Core Web Vitals are a tiebreaker, not a primary ranking factor. Improvements typically appear in CrUX field data within 28 days, and ranking effects, if any, follow within one to two crawl cycles. Content relevance and backlinks still dominate. Treat speed as a conversion and retention lever first.
Is image optimization or JavaScript reduction more important?
It depends on your page. Media-heavy sites usually gain more from image compression, next-gen formats like AVIF, and responsive sizing. App-like sites with heavy frameworks gain more from code splitting, tree shaking, and deferring non-critical scripts. Check your Lighthouse treemap before choosing.
Do free speed tools work as well as paid ones?
Free tiers are fine for diagnosis and small sites, but they usually cap at 5k to 10k monthly visits, omit field-data monitoring, or lack image CDN delivery. Paid tiers add edge caching, automated format conversion, and priority support. For sites past 50k visits, paid tools typically pay for themselves in conversion gains.
FAQ
What are the top website speed optimization tools in 2027?
The leading tools cluster into CDN and edge platforms, image optimization services, and front-end performance monitors. Most high-traffic sites combine one edge provider, one image pipeline, and one real-user monitoring tool. The right stack depends on your CMS, traffic profile, and whether your bottleneck is server response, asset weight, or client-side JavaScript.
How do I choose between a CDN and an optimization plugin?
Choose a CDN if your TTFB is above 500ms or your audience is geographically spread. Choose an optimization plugin if your assets are heavy but your server is fast. Many sites need both, but install them in sequence and measure after each. Stacking both at once makes it impossible to attribute gains.
Are speed optimization tools worth it for small websites?
For sites under 10k monthly visits, free tiers of Cloudflare, PageSpeed Insights, and WebPageTest cover most needs. Paid tools rarely justify their cost at that scale unless the site drives direct revenue. Focus on image compression, caching, and removing unused plugins before paying for anything.
What metrics should I track after installing a speed tool?
Track LCP, INP, and CLS in field data via Search Console or a RUM tool. Add TTFB if you changed hosting or CDN. Watch bounce rate and conversion rate as business outcomes. Lab scores from Lighthouse are useful for debugging but should not be your primary success metric.
Can speed optimization tools break my website?
Yes. Aggressive minification, JavaScript deferral, and CSS critical-path extraction can break interactive elements, forms, or third-party embeds. Always test on staging, keep a rollback plan, and monitor error logs for 48 hours after deployment. Most breakage comes from overlapping plugins, not the tools themselves.
How often should I re-audit website speed?
Re-audit after any major release, CMS update, or third-party script addition. Otherwise, review field data monthly and run a full lab audit quarterly. Speed regresses silently as pages gain images, scripts, and tracking pixels. A quarterly audit catches drift before it affects rankings or conversions.
Do speed tools help with mobile performance specifically?
Mobile benefits most because mobile networks and CPUs are slower. Image compression, responsive sizing, and script deferral have outsized effects on mobile LCP and INP. Test on throttled 4G and mid-tier Android devices, not just desktop Chrome, to see the real mobile impact of any tool.
What is the single highest-impact speed fix?
For most sites, optimizing the Largest Contentful Paint element, usually a hero image or heading, delivers the biggest gain. Compress it, serve it in AVIF or WebP, preload it, and ensure it is not lazy-loaded. This one change often cuts LCP by 1 to 2 seconds on mobile.
Are AI-based speed optimization tools reliable?
AI tools can automate image format selection, script prioritization, and cache rules, but their recommendations still need human review. They excel at repetitive optimization across many pages and at spotting patterns in field data. Treat them as accelerators, not replacements for understanding your own waterfall.
How do I measure ROI from speed optimization tools?
Baseline conversion rate, bounce rate, and revenue per session before deployment. Re-measure after 30 and 60 days, controlling for traffic source and seasonality. Most ecommerce sites see 1 to 3 percent conversion lift per second of LCP improvement, but your mileage depends on baseline speed and audience.
Sources
- https://web.dev/vitals/
- https://developers.google.com/search/docs/appearance/core-web-vitals
- https://developer.mozilla.org/en-US/docs/Web/Performance
- https://httparchive.org/reports/loading-speed
- https://www.cloudflare.com/learning/performance/
- https://pagespeed.web.dev/
- https://www.webpagetest.org/
- https://developer.chrome.com/docs/lighthouse/overview/
Related on PULSE
This page will be disappearing soon. Save it to your device for $1 — or read it free while it is here.
@Kory-White- · if Venmo asks, the last 4 of my number are 2012
This page is gone.
This one is off the shelf now. $1 keeps it on your phone for good — the whole page, pictures and diagrams included.
 revopsTop 10 Managed WordPress Hosts in 2027
 revopsTop 10 No-Code Website Builders in 2027
 revopsTop 10 SEO Tools for New Websites in 2027
 revopsTop 10 Tools for Building an Autonomous Website in 2027
 revopsTop 10 AI Image Tools for Website Visuals in 2027
 revopsTop 10 Website Builders for Small Businesses in 2027
 revopsTop 10 Domain Registrars in 2027
 revopsTop 10 Heatmap Tools for Websites in 2027
 revopsTop 10 Website Builders for Coaches and Consultants in 2027
 revopsTop 10 Ecommerce Website Platforms in 2027