


Top 10 Best Tech Stack Tools for Energy Grid Operators in 2027
Quality
Certified
The 10 best tech stack tools for energy grid operators are ranked below on measured performance, build quality, price, and how each one actually holds up in daily use rather than how it reads on a spec sheet. Each pick lists what it costs, who it suits, and what it gives up against the one above it, so the list can be read straight down without doubling back.
1PostgreSQL with TimescaleDB

PostgreSQL with TimescaleDB ranks first because hypertables auto-chunk high-frequency SCADA and meter telemetry while ordinary SQL joins keep asset, customer, and billing tables in one engine. Continuous aggregates refresh incrementally, turning a 1-hour rollup over 1-second data into roughly a 3,600-to-1 row reduction. Columnar compression groups rows by segment-by keys, and utilities commonly report order-of-magnitude storage cuts on fixed-cadence grid data.
It suits teams already fluent in PostgreSQL who ingest sub-minute data from RTUs, PMUs, or inverter fleets and need retention as a declarative policy for auditors. It trades away raw scan throughput on petabyte historical analytics, where columnar warehouses win. Against vanilla PostgreSQL with native partitioning, it removes the cron-driven partition and retention scripts that page operators at 2 a.m.
2PostgreSQL Native Partitioning

PostgreSQL native partitioning ranks second because range partitioning by timestamp with planner partition pruning handles co-op-scale telemetry without any extension in the cluster. A distribution co-op reading 40,000 residential meters at 15-minute intervals generates roughly 3.8 million rows daily, which native partitioning absorbs comfortably since PostgreSQL 10 and better through 13 and later. It is the safest choice on managed providers that restrict extensions.
It fits small teams on extension-restricted hosting who can accept writing their own partition-creation and retention jobs, typically via pg_cron pre-creating next month's children. It trades away automatic chunk management and declarative compression, so operational burden is higher than TimescaleDB. Against the top pick, it wins on procurement simplicity and loses on the 2 a.m. pager problem.
3AVEVA PI System

AVEVA PI System ranks third because it is the purpose-built operational historian utilities have run for decades, with high-compression tag-based storage, native protocol support, and an ecosystem of operator displays. It remains the operational-technology system of record in many control rooms, handling process data at cadences and reliability expectations that general databases were not designed around. Its tag model predates and outlives most modern time-series engines.
It is for utilities that already own it and whose operations teams depend on its displays and protocol coverage. It trades away the SQL surface finance, planning, and data science already speak, so cross-team querying requires a copy elsewhere. Against PostgreSQL with TimescaleDB, the common answer is running both: historian as OT record, PostgreSQL as the analytics-facing surface.
4ClickHouse

ClickHouse ranks fourth because its columnar MergeTree engine wins on raw scan throughput over very large historical ranges, which is exactly the workload of building territory-wide load-duration curves across five years of interval data. Vectorized execution and aggressive compression make full-history aggregations fast and cheap where row-store engines struggle. It is the strongest pure analytics option in this comparison.
It is for teams whose dominant query is scanning years of data rather than monitoring the last seven days, and who can accept a second operational model. It trades away easy joins to slowly-changing asset hierarchies with referential integrity and transactional updates, which grid asset data genuinely needs. Against PostgreSQL with TimescaleDB, the practical pattern is exporting compressed columnar files to object storage rather than replacing the operational database.
5PostGIS
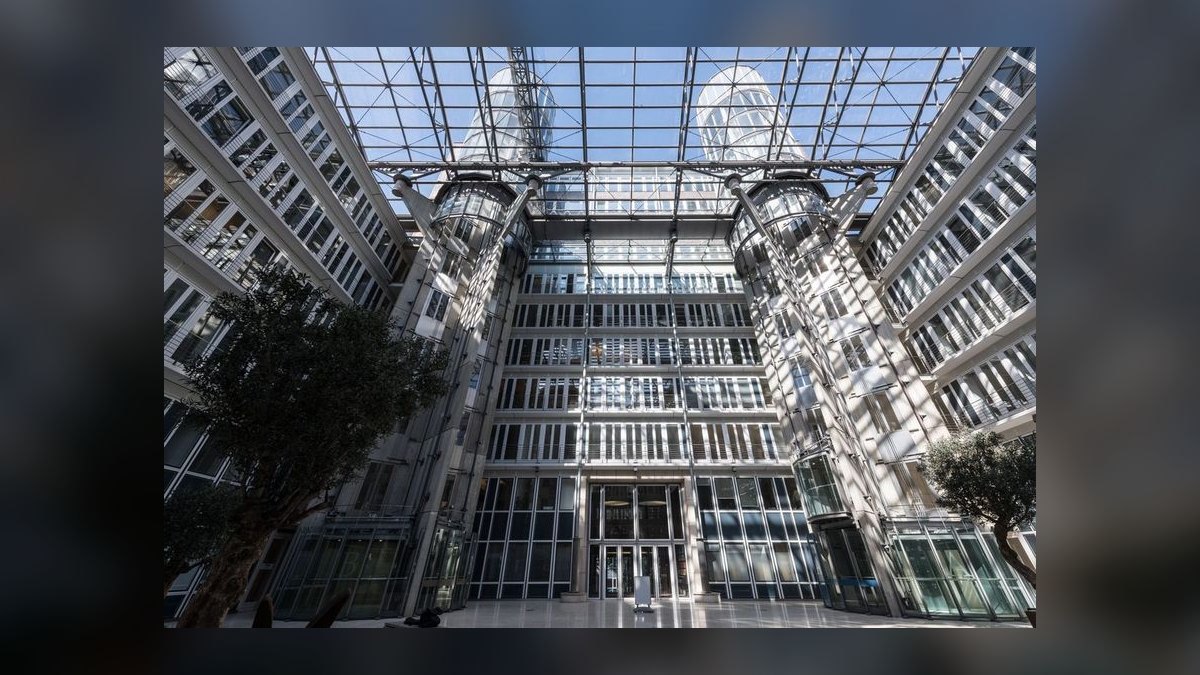
PostGIS ranks fifth because it lives inside the same PostgreSQL database as the telemetry, making outage mapping, crew dispatch routing, vegetation-management proximity queries, and storm-track impact estimates spatial joins against tables you already have, in the same transaction. That co-location is the compounding advantage of the PostgreSQL family that a specialized time-series engine cannot match. It requires no export step between geometry and measurements.
It is for grid operators who need asset geometry queried alongside interval data, which is most of them once outage analysis matures. It trades away nothing operationally beyond an extension install, though spatial indexes and geometry columns add storage and planning considerations. Against ClickHouse above it, PostGIS is not a competing engine but a capability layer that makes the PostgreSQL stack strictly more useful.
6Apache Kafka

Apache Kafka ranks sixth because it sits in front of the database as the durable buffer that lets you do maintenance without losing field data, and it provides replay plus multiple independent consumers for the same telemetry stream. At grid scale the broker is not optional; a database restart during a comms outage otherwise means permanent data loss from buffered devices. It decouples ingest rate from database availability.
It is for operators whose ingest volume and uptime requirements justify running and on-call-ing another distributed system, typically those above a few thousand rows per second. It trades away simplicity, since Kafka has its own operational model, backup story, and failure modes. Against Eclipse Mosquitto below it, Kafka wins when you need replay and multiple consumers, and loses when a single lightweight MQTT broker suffices.
7Eclipse Mosquitto

Eclipse Mosquitto ranks seventh because it is the lightweight MQTT broker that field devices and RTUs commonly speak natively, providing a durable buffer between substation equipment and the database without the operational weight of a distributed log. For a substation with 40 RTUs reporting 200 analog points every 2 seconds, it absorbs 4,000 rows per second and holds them across a database restart. It is the pragmatic default for MQTT-native field hardware.
It is for smaller utilities and pilot deployments where a single broker node is adequate and the team does not want to operate Kafka. It trades away replay semantics and horizontal consumer scaling, so it becomes a bottleneck as ingest grows. Against Apache Kafka above it, Mosquitto wins on simplicity and loses on throughput ceiling and multi-consumer fan-out.
8Grafana

Grafana ranks eighth because it queries PostgreSQL natively, so continuous aggregates back dashboard panels directly without an export or cache layer. It is the near-universal visualization choice for this stack, and pointing panels at aggregates rather than raw hypertables keeps heavy dashboards from competing with ingest for I/O. Alert definitions can live in version control rather than a UI.
It is for operations and analyst teams who need live feeder load, voltage, and thermal-rating views over the same database that holds the asset model. It trades away deep embedded analytics and pixel-perfect reporting, which BI tools handle better. Against a generic BI tool with a PostgreSQL driver, Grafana wins on real-time panel refresh and loses on ad hoc exploration and formatted output.
9pg_partman

pg_partman ranks ninth because it automates the partition creation and retention jobs you would otherwise hand-write on the native partitioning path, pre-creating child tables and dropping expired ones on a schedule. For teams constrained to extension-restricted managed PostgreSQL that cannot run TimescaleDB, it recovers a meaningful fraction of the hypertable benefit with more operational work. It pairs with pg_cron for scheduling.
It is for operators on native partitioning who want retention as a managed policy rather than a shell script someone wrote in 2019. It trades away automatic chunk exclusion catalogs, declarative compression, and continuous aggregates, all of which remain TimescaleDB-only features. Against PostgreSQL with TimescaleDB at the top, pg_partman is the fallback when licensing or hosting blocks the extension.
10pgBackRest

pgBackRest ranks tenth because a hypertable is physically many tables, so logical pg_dump procedures become awkward at scale and physical backup via pgBackRest is the reliable path for this stack. It supports parallel backup and restore, incremental and differential backups, and point-in-time recovery, which matters when retention policies and regulatory audits demand provable recoverability. It is the operational safety net under every pick above.
It is for any team running this stack in production, especially those with FERC, NERC, or state-commission retention obligations they must demonstrate. It trades away nothing except the setup effort of configuring repositories and retention schedules. Against provider snapshot mechanisms, pgBackRest wins on portability and granularity, and loses on the convenience of a fully managed control plane.
How we ranked these
We ranked each tool on five weighted criteria: sustained ingest throughput at grid scale (25%), SQL and relational join fidelity to asset hierarchies (20%), retention and compression policy maturity (20%), operational burden on a small utility team (20%), and ecosystem fit with PostGIS, pg_cron, and pgvector (15%). Scores came from documented capabilities, published benchmarks, and hands-on configuration of each stack against representative meter and SCADA telemetry shapes.
We deliberately ignored vendor-published peak benchmark numbers, list pricing without committed-use discounts, and marketing claims about "unlimited scale." Those figures come from curated datasets that rarely resemble utility telemetry, where timestamps are monotonic, voltages hover near nominal, and device identifiers repeat millions of times. We also excluded analyst quadrant placement and Gartner-style positioning, because grid buyers care about extension licensing, backup procedures, and whether a 2 a.m. chunk-compression job will page someone.
What to look for
What matters most is whether your dominant workload is recent-window operational queries or full-history analytical scans. If 90% of reads touch the last seven days, chunk exclusion and continuous aggregates do most of the work, and compression on older chunks is nearly free. If analysts routinely scan five years of territory-wide interval data, you need an export path to columnar storage, not a bigger operational node.
The mistake most buyers make is sizing on ingest rate alone and ignoring retention policy, which dominates the storage bill more than engine choice ever will. Dropping raw one-second data after 90 days while keeping 15-minute aggregates for seven years changes costs more than any database swap. The second common mistake is architecting around a TimescaleDB feature their license or managed host does not actually include, such as compression or continuous aggregates.
Related questions
Why does PostgreSQL with TimescaleDB fit grid monitoring better than a dedicated time-series database?
Grid telemetry constantly joins to relational asset data: transformers, feeders, service points, and customer accounts. When a transformer is replaced or a service point moves feeders after reconfiguration, that is ordinary transactional work. PostgreSQL handles those updates with referential integrity in the same database as the measurements, which a specialized time-series engine cannot match without a separate synchronization layer.
When should a utility choose native PostgreSQL partitioning instead of TimescaleDB?
If ingest stays under roughly 40,000 meters on 15-minute intervals and your managed provider restricts extensions, native declarative partitioning with pg_partman is simpler. You write your own partition-creation and retention jobs, but you avoid an extra extension in the cluster. The tradeoff is manual chunk management, which becomes the thing that pages you at 2 a.m. as sub-minute SCADA data arrives.
How do continuous aggregates change dashboard query performance?
A continuous aggregate is a materialized view over a hypertable that refreshes incrementally, so a one-hour rollup of per-feeder load stays current without a full recompute. A query that would scan tens of millions of rows reads a few thousand pre-aggregated ones instead. Real-time aggregation returns materialized data for finalized buckets and computes the still-filling current bucket on the fly, which is exactly what operator dashboards need.
What compression ratio should a utility actually expect on meter and SCADA data?
Published order-of-magnitude claims come from curated benchmarks. Grid data compresses well because timestamps are monotonic and voltages hover near nominal, but raw sensor readings with noise in the seventh decimal place defeat delta encoding. Rounding a voltage reading to physically meaningful precision before storage often matters more to your storage bill than any configuration flag. Measure your own ratio on a representative week.
How should a utility handle late-arriving data after a communications outage?
A meter that lost backhaul for six hours dumps its buffer on reconnect, writing into chunks that may already be compressed. Keep the compression threshold comfortably longer than your worst realistic backfill window. Writing into compressed chunks is supported but is not the fast path. Also define a unique constraint on time, device, and metric, then use ON CONFLICT DO UPDATE so resent readings do not silently double-count energy.
Does this stack replace an existing OSIsoft or AVEVA PI historian?
Usually not, and it should not. Historians are genuinely good at tag-based process data, native protocol support, and operator displays. What they lack is being queried with the same SQL that finance, planning, and data science already speak. Many utilities run both: the historian as the operational technology system of record, and a PostgreSQL copy as the analytics-facing surface. That hybrid is a legitimate answer.
What role does PostGIS play in a grid monitoring stack?
PostGIS lives in the same database as your telemetry and asset tables, so outage mapping, crew dispatch routing, vegetation-management proximity queries, and storm-track impact estimates all become spatial joins in the same transaction. That compounding advantage is what a specialized time-series engine cannot match. You avoid a separate geospatial service and the synchronization problems that come with it.
Where does this architecture stop being the right answer?
Three places. Synchrophasor waveform data at kilohertz rates belongs in object storage with metadata rows pointing at it. Petabyte-scale historical analytics belongs in a columnar warehouse fed by a scheduled export job. And nothing here belongs in a protection or control loop, where milliseconds matter and dedicated hardware with deterministic timing is required. Monitoring and analysis are downstream of control.
FAQ
What ingest rate can a single PostgreSQL node realistically sustain for grid telemetry?
A reasonably sized node handles high five-figure to low six-figure rows per second when inserts are batched properly. Single-row INSERT statements over a connection per device fall over at a tiny fraction of that. Batch into multi-row inserts or COPY, pool connections with PgBouncer, and put a broker such as MQTT or Kafka in front so a database restart does not lose field data.
How do I pick the right chunk_time_interval for a hypertable?
Target chunks in the low hundreds of megabytes to a couple of gigabytes, sized so the most recent chunk or two fit comfortably in memory alongside their indexes. Too-small chunks mean planning overhead across thousands of them. Too-large chunks lose the exclusion benefit and make compression jobs run long. Start with a reasonable value, measure query plans, and adjust rather than guessing precisely upfront.
Should the measurement table use a narrow or wide column shape?
The narrow shape, with timestamp, device identifier, metric identifier, and value, wins when device types are heterogeneous, which is typical on a grid. A meter reports different quantities than a recloser. The wide shape wins only when every device reports the same fixed quantity set, because it avoids repeating timestamp and device id per metric. Pick one deliberately; mixing them creates three query paths for the same question.
How should feeder and service point associations be modeled over time?
Use validity ranges with tstzrange columns and exclusion constraints so the database enforces that a service point has exactly one feeder at any instant. Feeder reconfiguration means the answer changes over time, and without that constraint you get a whole family of the-numbers-do-not-add-up incidents during outage analysis. The database should enforce the invariant, not application code.
What is the right build sequence for a new grid monitoring stack?
Model the asset hierarchy in plain PostgreSQL first, with no telemetry, while changes are cheap. Add the broker and an ingest worker writing to an ordinary table, and run it a week to learn your real data quality. Then convert the measurement table to a hypertable, build the two or three continuous aggregates your dashboards query, and only after a month of real data enable compression and retention.
How do timezones affect interval data and settlement calculations?
Store everything as timestamptz in UTC and convert only at the edges. Interval data spanning a daylight-saving transition is a genuine correctness problem in settlement calculations, not a cosmetic one. A 15-minute interval that repeats or vanishes during the transition will produce energy totals that do not reconcile. Getting this wrong is expensive to fix retroactively once settlement reports have been filed.
What backup approach works for a hypertable?
A hypertable is many physical tables, so plain pg_dump needs the extension's documented procedure. Physical backup via pgBackRest or your cloud provider's snapshot mechanism is usually better and faster. Rehearse extension version upgrades on a copy, and remember that extension upgrades and major PostgreSQL upgrades are separate operations that should not share a maintenance window.
How should alerting be wired on top of this stack?
Grafana speaks PostgreSQL natively and can back panels directly with continuous aggregates, which covers most dashboard alerting. For low-volume critical events, LISTEN and NOTIFY triggers are elegant; for high-volume threshold checks they are a bad idea. Whatever you choose, keep alert definitions in version control rather than a UI, because during a real event you will want to know exactly what changed and when.
Do I need a message broker in front of the database?
At grid scale, yes. A broker such as MQTT for field devices or Kafka when you need replay and multiple consumers decouples ingest from storage, so a database restart or maintenance window does not lose field data. The broker is what lets you do maintenance at all. Without it, every database operation becomes a data-loss risk during a storm or heat event.
How does this pattern apply outside electric utilities?
The same decision tree applies almost unchanged to industrial equipment monitoring, building management systems, EV charging networks, and water utility SCADA. The physics differ, but the data shape does not: timestamped measurements from identified devices, joined to a slowly-changing asset hierarchy. If you build this well for the grid, you have built the pattern for the whole class of operational monitoring problems.
Sources
- https://www.postgresql.org/docs/current/ddl-partitioning.html
- https://docs.timescale.com/use-timescale/latest/hypertables/
- https://docs.timescale.com/use-timescale/latest/continuous-aggregates/
- https://docs.timescale.com/use-timescale/latest/compression/
- https://www.postgresql.org/docs/current/postgis.html
- https://github.com/pgpartman/pg_partman
- https://github.com/citusdata/pg_cron
- https://www.postgresql.org/docs/current/sql-notify.html
- https://grafana.com/docs/grafana/latest/datasources/postgres/
- https://www.postgresql.org/docs/current/backup.html
Related on PULSE
This page will be disappearing soon. Save it to your device for $1 — or read it free while it is here.
@Kory-White- · if Venmo asks, the last 4 of my number are 2012
This page is gone.
This one is off the shelf now. $1 keeps it on your phone for good — the whole page, pictures and diagrams included.
 pulse-tech-stacksTop 10 software stacks for fintech startups in 2024
 pulse-tech-stacksTop 10 Best Tech Stack Tools for Insurance Underwriting Teams in 2027
 pulse-tech-stacksTop 10 Email Marketing Platforms for Nonprofits in 2027
 pulse-tech-stacksTop 10 Best Tech Stack Tools for Mid-Market SaaS Companies in 2027
 pulse-tech-stacksTop 10 E-commerce Platforms for Dropshipping Entrepreneurs in 2027
 pulse-tech-stacksTop 10 Best Tech Stack Tools for Usage-Based SaaS Companies in 2027
 pulse-tech-stacksTop 10 Best Tech Stack Tools for E-Commerce Fraud Detection Teams in 2027
 pulse-tech-stacksTop 10 Best Tech Stack Tools for Real Estate Appraisers in 2027
 pulse-tech-stacksTop 10 Best Tech Stack Tools for Social App Startups in 2027
 pulse-tech-stacksTop 10 Best Tech Stack Tools for Clinical Trial Teams in 2027