


Where do I find a KPI tracking tool built specifically for fractional CRO engagements in 2027?
Quality
Certified
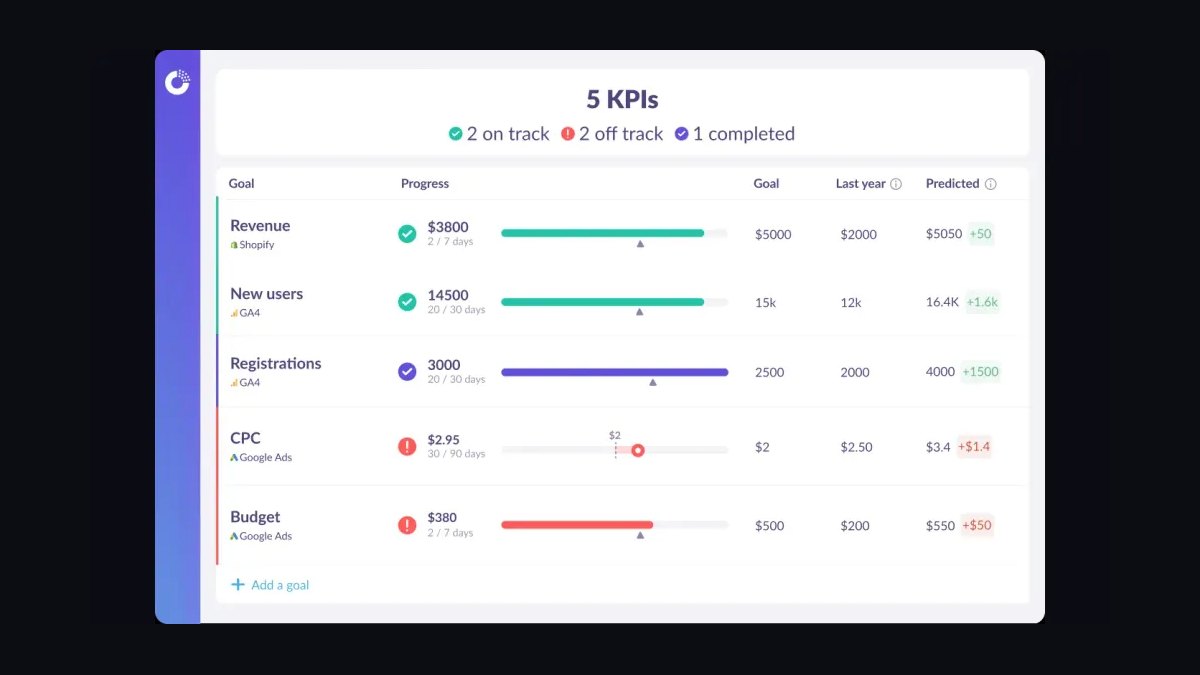
There is no single off-the-shelf KPI tracking tool built exclusively for fractional CRO engagements in 2027. Instead, you find one by combining a general RevOps dashboard platform with a fractional-CRO-specific template layer, or by adopting a boutique tool from a fractional executive marketplace. Search vendor marketplaces, RevOps communities, and fractional executive networks, then configure for multi-client portfolios.
Signals you actually need this
Fractional Chief Revenue Officers run a fundamentally different operating model than full-time CROs, and that difference is what creates the need for a purpose-built KPI tracking tool rather than a generic sales dashboard. A full-time CRO owns one revenue org, one CRM instance, one board, and one set of quarterly targets. A fractional CRO typically juggles three to six concurrent clients, each with its own CRM, its own fiscal calendar, its own board reporting cadence, and its own definition of what "pipeline" even means. When you multiply that across a portfolio, the tracking problem stops being "which chart do I show the CEO" and becomes "how do I keep 40 to 90 leading indicators straight without dropping a client."
The first signal you need a dedicated tool is portfolio sprawl. If you are maintaining KPI data in more than two spreadsheets per client, or if you have ever pulled a number for a Monday board meeting from a file you last touched the previous Thursday, you have already outgrown manual tracking. Fractional engagements are billed in limited monthly hours — often 20 to 40 hours per client — and every hour spent reconciling numbers is an hour not spent coaching a VP of Sales or rebuilding a comp plan.
The second signal is inconsistent KPI definitions across engagements. One client counts a "qualified opportunity" at the discovery call, another at the technical validation stage. If your tracking tool does not let you store a per-client metric dictionary, you will eventually present a number that means something different to you than to the client, and that erodes trust fast. A tool built for fractional work needs a client-level schema, not just a dashboard-level filter.
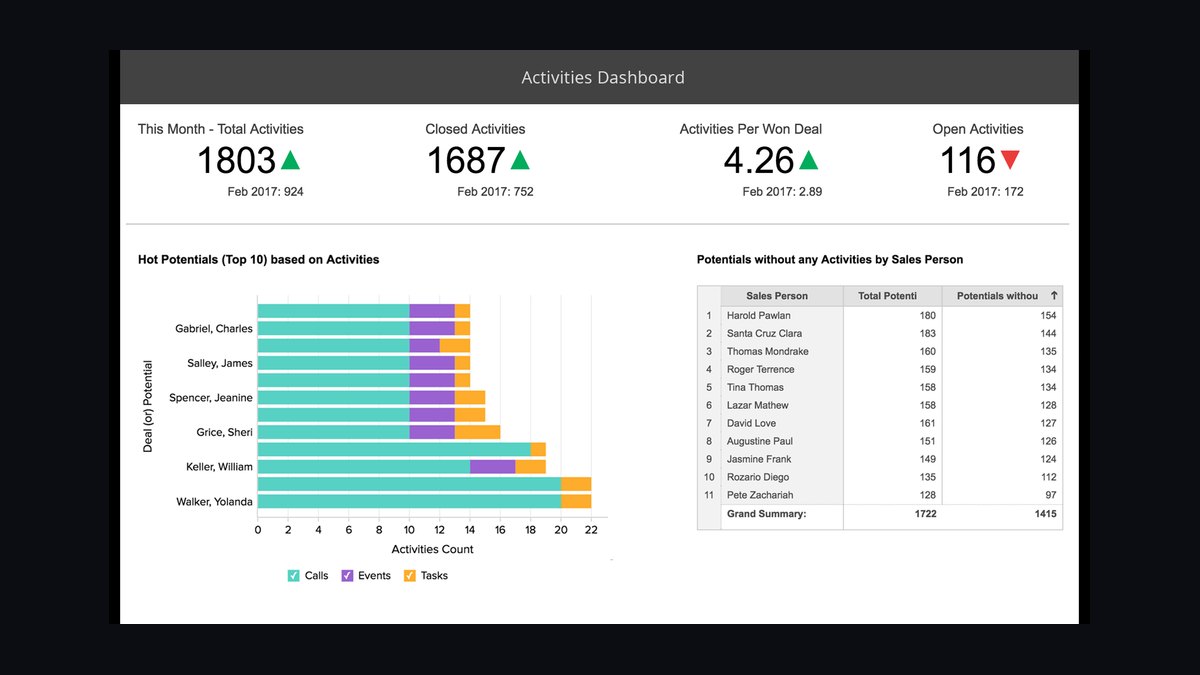
The third signal is board and investor reporting. Fractional CROs are frequently hired precisely because a company needs credible revenue reporting for a raise, an exit, or a turnaround. That means your tracking output has to survive scrutiny from investors who have seen hundreds of dashboards. If your tool cannot show a clean month-over-month trend with a documented source for every metric, you are exposed.
The fourth signal is handoff and continuity. Fractional engagements end. When yours does, the client should be able to keep the KPI system running without you. A tool that locks data inside your personal login is a liability; a tool that lets you hand over a configured workspace is a selling point for your next engagement. This is one of the reasons experienced fractional operators favor platforms with client-owned workspaces or exportable metric definitions.
Finally, watch for the "single-client comfort trap." Many fractional CROs start with one anchor client and build a bespoke dashboard in that client's BI stack. It works beautifully — until client two arrives with a different stack. At that point you either rebuild from scratch or migrate to something portable. Recognizing this signal early saves months of rework, and it is the single most common trigger that sends fractional CROs searching for a purpose-built tool.
What good looks like vs. bad
A good fractional-CRO KPI tracking setup has five properties. First, it is multi-tenant by design: one login, many client workspaces, with strict separation so you never leak Client A's pipeline into Client B's review. Second, it stores metric definitions per client, so "SQL," "pipeline coverage," and "net revenue retention" can each mean the client-specific thing they actually mean. Third, it pulls from source systems automatically — CRM, billing, product analytics, support — rather than relying on manual entry, because manual entry across five clients is where errors breed. Fourth, it produces a repeatable weekly and monthly output: a one-page scorecard per client plus a portfolio roll-up you can scan in ten minutes. Fifth, it is portable: you can export definitions, hand over a workspace, or clone a template to a new engagement in under an hour.
A bad setup has the mirror-image failures. It is single-tenant, forcing you to log into five separate tools. It hardcodes one client's KPI logic into the dashboard layer, so every new engagement requires a rebuild. It depends on a champion inside the client to update a spreadsheet, which means the data goes stale the moment that person takes vacation. It produces beautiful charts with no documented lineage, so when a board member asks "where does this 3.2x coverage number come from," you cannot answer. And it is locked to your personal account, making handoff awkward and renewal conversations harder.
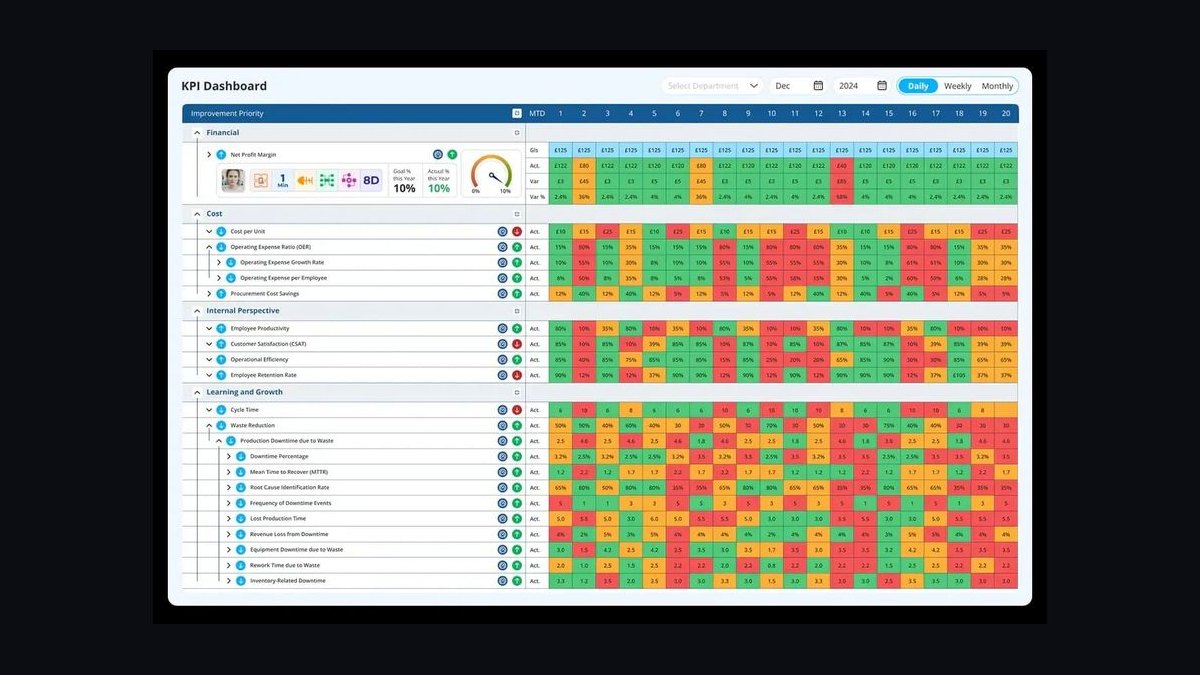
The practical test is the "new client in one hour" test. If you can onboard a new fractional engagement — connect the CRM, map the client's stage definitions, select a KPI template, and publish a first scorecard — in under an hour, your setup is good. If it takes a week, you are running a bad setup and paying for it in unbillable hours.
The diagram above is the decision tree most fractional CROs implicitly walk. The good branch compounds: each new engagement gets faster because templates and connectors carry over. The bad branch compounds the other way: each new client adds a fresh pile of manual work. The gap between the two branches is usually the difference between a fractional practice that scales to six clients and one that caps out at two.
Real cost and ROI ranges
Costs for KPI tracking in a fractional CRO practice fall into three buckets: platform subscription, setup and configuration time, and ongoing maintenance. Because no single tool is purpose-built exclusively for fractional CROs in 2027, most operators assemble a stack, and the stack cost varies widely by how much they build versus buy.
Platform subscription is the most visible line. General-purpose BI and RevOps dashboard tools commonly run in the range of roughly $20 to $100 per user per month for small teams, with enterprise tiers climbing well above that. Multi-tenant-capable revenue intelligence platforms often price per seat plus a platform fee, and the platform fee is what usually pushes a five-client practice into the low hundreds per month. Boutique tools sold through fractional executive marketplaces sometimes bundle tracking into a broader engagement-management subscription, which can be more economical if you already use that marketplace for lead flow.

Setup and configuration is the hidden cost. A first-time configuration of a multi-tenant KPI workspace — connectors, metric dictionary, scorecard templates, portfolio roll-up — realistically takes 15 to 40 hours. At a fractional CRO's typical blended rate, that is a meaningful one-time investment. The payoff is that each subsequent client onboarding drops to roughly 1 to 4 hours if templates are reused well. This is the core ROI mechanic: the tool pays for itself through onboarding time compression, not through the dashboard itself.
Ongoing maintenance runs perhaps 2 to 5 hours per month across a five-client portfolio once the system is stable. That covers connector breakage, metric definition updates when a client changes stages, and the monthly roll-up. If maintenance creeps above 8 hours a month, the setup is too manual and should be re-examined.
The ROI case is easiest to make in three scenarios. First, board reporting: if the tool lets you produce an investor-grade revenue scorecard in 30 minutes instead of 4 hours per client per month, and you have five clients, that is roughly 17 hours a month recovered — often enough to justify the entire subscription and then some. Second, retention: clients renew fractional engagements when they can see progress in numbers, and a clean KPI scorecard is one of the strongest renewal levers available. Third, business development: a documented, portable KPI system is a credible differentiator in proposals, and fractional CROs who can show a sample scorecard in the sales process often win engagements against competitors who cannot.
The trade-off to weigh is build-versus-buy. Building on a general BI platform gives maximum flexibility and lower per-seat cost but higher setup and maintenance burden. Buying a more opinionated revenue intelligence tool reduces setup time but constrains how you define metrics and may not support true multi-tenancy. Most fractional CROs in 2027 land somewhere in the middle: a flexible dashboard layer plus a lightweight client-management layer, with templates doing the heavy lifting.
How it plugs into your workflow

The tool only earns its keep if it slots into the weekly and monthly rhythm of a fractional engagement. The workflow below is the pattern most experienced fractional CROs converge on, and it is worth mapping your own cadence against it before you buy anything.
Step one is the intake week. During the first week of a new engagement, you connect the client's source systems — CRM at minimum, billing and product analytics if available — and map their stage definitions into your metric dictionary. You capture the baseline: current pipeline coverage, win rate, average deal size, sales cycle length, and any retention metrics that matter. This baseline becomes the anchor for every future comparison, and it is the single most important artifact you produce in week one.
Step two is the weekly scorecard. Every week, the tool refreshes leading indicators — pipeline created, stage conversion, activity ratios, forecast changes — and you review a one-page scorecard before your client working session. The scorecard is not a report you send; it is a conversation tool. You use it to decide what to coach that week. Keeping it to one page forces prioritization and prevents the "dashboard sprawl" that kills adoption.

Step three is the monthly business review. Once a month, you produce a fuller view: trailing trends, cohort analysis where relevant, and a short narrative on what moved and why. This is the artifact that goes to the client's leadership team or board. It should be reproducible in under an hour from the tool, with every number traceable to a source.
Step four is the quarterly portfolio roll-up. Across all your clients, you assemble a single view that shows each engagement's health, the KPIs you are accountable for, and where you are spending your hours. This roll-up is your own management tool — it tells you which engagements need more attention and which are ready to graduate to a lighter touch.
Step five is handoff. When an engagement ends, you export the metric dictionary, clone the workspace to the client, and walk their team through the scorecard. A clean handoff is both a professional courtesy and a referral generator.
The workflow matters because it defines your tool requirements. If you only ever produce monthly reports, you can tolerate a slower tool. If you run weekly scorecards across five clients, refresh speed and multi-tenant switching become non-negotiable. Buy for the cadence you actually run, not the cadence you admire.
Where to actually find these tools
Because no vendor sells a product labeled "KPI tracking for fractional CRO engagements," you find the right tool by searching in four specific places, each with different trade-offs.

The first place is fractional executive marketplaces and networks. Platforms that place fractional executives often bundle or recommend engagement-management tooling, and some have partner ecosystems where dashboard and reporting tools are listed. The advantage is that these tools are at least aware of the multi-client model. The disadvantage is that the tracking layer is usually thin — often a reporting add-on rather than a full KPI system — so you may still need a dashboard layer underneath.
The second place is RevOps communities and practitioner forums. RevOps professionals who support fractional and portfolio clients frequently publish their stack recommendations, template packs, and connector configurations. This is where you find the template layer that turns a general dashboard tool into something usable for fractional work. Search for terms like "multi-client RevOps dashboard," "portfolio KPI template," and "fractional CRO scorecard." The output is usually a template you import into a commercial BI or revenue intelligence platform.
The third place is revenue intelligence and BI vendor marketplaces. Most major dashboard and revenue intelligence platforms maintain template galleries and partner directories. Filter for templates that support multiple workspaces or client separation, and for connectors to the CRMs your clients actually use. This is where you find the platform itself. The trade-off is that vendor galleries are marketing surfaces, so validate any template against your own metric dictionary before trusting it.
The fourth place is your own network of fractional peers. Fractional CROs trade tooling recommendations constantly because the problem is shared and the market is thin. A single conversation with an operator running six clients can save you weeks of evaluation. Ask specifically what they use for multi-tenant separation, how they handle conflicting metric definitions, and what they wish they had bought instead.

Across all four places, apply the same filter: does the tool support multiple isolated client workspaces, per-client metric definitions, automated connectors, and exportable handoff? If it fails any of those, it is a general dashboard, not a fractional-CRO tracking tool, and you should keep looking. The honest answer to "where do I find one" is that you assemble it from a platform plus a template plus your own metric dictionary — and the search starts in marketplaces, RevOps communities, vendor galleries, and peer networks, in that order.
Related questions
Do I need a separate tool per client?
No. A single multi-tenant platform with isolated client workspaces is almost always better than separate tools, because it lets you reuse templates, maintain one metric dictionary structure, and produce a portfolio roll-up. Separate tools multiply logins, cost, and maintenance, and they make cross-client benchmarking impossible.
Can I just use the client's existing CRM dashboards?
You can, but you should not rely on them as your primary tracking layer. Client CRM dashboards are configured for the client's internal audience, not for a fractional operator switching between engagements. They also disappear when the engagement ends, which defeats handoff and portability.
How long does setup realistically take?
Expect 15 to 40 hours for a first multi-tenant configuration covering connectors, metric dictionary, scorecard templates, and portfolio roll-up. Subsequent client onboardings typically drop to 1 to 4 hours if you reuse templates well. If setup consistently exceeds 40 hours, the tool is too manual.
What if my clients use different CRMs?

This is common and manageable. Choose a platform with broad connector coverage, or budget for a lightweight integration layer. The metric dictionary should sit above the CRM layer so definitions stay consistent even when source systems differ. Test connector coverage against your actual client mix before committing.
Is a spreadsheet ever good enough?
For one client with simple metrics, yes. Spreadsheets break down at two clients or when you need automated refresh, per-client definitions, and portfolio roll-ups. The crossover point is usually the second or third engagement, or the first time you present to a board.
FAQ
What is the single best tool for fractional CRO KPI tracking in 2027? There is no single best tool, because no vendor builds exclusively for this niche. The best setup is a multi-tenant revenue intelligence or BI platform combined with a fractional-CRO scorecard template and your own per-client metric dictionary. Evaluate platforms on multi-tenancy, connector coverage, and exportable handoff.
How is a fractional CRO tracking tool different from a normal sales dashboard? A normal sales dashboard serves one revenue org with one set of definitions. A fractional-CRO tracking tool must serve multiple isolated clients from one login, store client-specific metric definitions, and produce both per-client scorecards and a portfolio roll-up. Multi-tenancy and portability are the defining differences.

Where should I search first? Start with fractional executive marketplaces and RevOps communities, because those are the two places where the multi-client problem is understood. Then check revenue intelligence vendor template galleries for the platform layer, and validate everything against peer recommendations from other fractional operators.
How much should I budget? Platform subscription commonly runs from roughly $20 to $100 per user per month for small-team tiers, with multi-tenant revenue intelligence platforms adding a platform fee that can push a five-client practice into the low hundreds per month. Budget 15 to 40 hours of one-time setup and 2 to 5 hours of monthly maintenance.
Can I build this myself instead of buying? Yes, and many fractional CROs do, using a general BI platform plus custom connectors and templates. Building gives flexibility and lower per-seat cost but shifts cost into setup and maintenance. Buy if you value speed and handoff; build if you have unusual metric requirements or strong technical support.
How do I prove ROI on the tool? Measure hours recovered on board and client reporting, renewal rates on engagements where you present a clean KPI scorecard, and win rates on proposals where you show a sample scorecard. Most operators find the subscription pays for itself through reporting time savings alone across three or more clients.
Sources
- https://www.gartner.com/en/sales
- https://hbr.org/topic/subject/sales
- https://www.mckinsey.com/capabilities/growth-marketing-and-sales/our-insights
- https://www.revenueops.org
- https://www.salesforce.com/resources/articles/sales-kpis/
- https://www.hubspot.com/sales/sales-metrics
- https://www.pavilionhq.com
- https://www.forrester.com/research/
Related on PULSE
- How to structure a fractional CRO engagement scope and deliverables
- Building a multi-client RevOps dashboard without leaking data
- Which KPIs belong on a fractional CRO weekly scorecard
- Handoff checklist when a fractional engagement ends
- Pricing models for fractional revenue leadership in 2027
- RevOps tooling stack for portfolio and fractional operators
This page will be disappearing soon. Save it to your device for $1 — or read it free while it is here.
@Kory-White- · if Venmo asks, the last 4 of my number are 2012
This page is gone.
This one is off the shelf now. $1 keeps it on your phone for good — the whole page, pictures and diagrams included.
 pulse-toolsHow do I hire a fractional CRO in San Jose in 2027?
 pulse-toolsHow do I hire a fractional CRO in New Mexico in 2027?
 pulse-toolsWhere do I find a fractional CRO in Ohio in 2027?
 pulse-toolsHow much does a outsourced CRO charge in 2027?
 pulse-toolsHow do I evaluate a fractional Chief Revenue Officer in Wisconsin in 2027?
 pulse-toolsWhere do I find a fractional VP of Sales in Wyoming in 2027?
 pulse-toolsHow do I evaluate a fractional Chief Revenue Officer in South Carolina in 2027?
 pulse-toolsWhat does a fractional Chief Revenue Officer engagement cost in Arizona in 2027?
 pulse-toolsHow do I hire a fractional CRO in Ellicott City in 2027?
 pulse-toolsIs there a fractional Chief Revenue Officer available near me in Arkansas in 2027?