
How to use Power BI to visualize fractional CRO ROI from multiple RevOps sources
 Curated byKory White · Fractional CRO · Maryland
 PULSEKNOWLEDGE LIBRARY
Quality
Certified

To visualize fractional CRO ROI from multiple RevOps sources in Power BI, build an audit-grade unified data model that reconciles CRM, revenue intelligence, forecasting, and marketing automation into a single star-schema semantic model. Calculate the core metric — incremental revenue attributed minus total cost, divided by total cost — with transparent, auditable DAX measures that explicitly weight each fractional CRO action and prevent double-counting from overlapping AI-influenced touchpoints. Then surface it through a decomposition tree for root-cause drill-down, a custom KPI matrix for at-a-glance performance, and automated escalation thresholds tied to external benchmarks.
The challenge of measuring fractional CRO ROI across multiple RevOps systems is fundamentally a data-architecture problem, not a reporting one. When a fractional leader touches pipeline through Salesforce, Gong, Clari, HubSpot, and sequence tools like Outreach or Salesloft, each system claims partial credit for the same revenue events. Without a disciplined model, the resulting visualizations will be flattering, contradictory, and indefensible under board scrutiny. The solution is to treat Power BI as the audit layer — ingesting every source through Power Query, normalizing field names and deal identifiers, loading into a governed warehouse, and encoding every attribution weight in a dimension table where stakeholders can inspect the assumptions. The payoff is a dashboard where fractional CRO ROI is arithmetic, not opinion, and where renewal conversations start with data rather than persuasion.
Why does fractional CRO ROI require a multi-source data architecture?
The fractional CRO model — a senior revenue leader retained part-time for 3 to 12 months — has become a default growth solution for startups and mid-market firms needing executive judgment without full-time compensation. This flexibility creates an attribution problem: a full-time CRO owns a quarter, but a fractional one owns a transformation. Transformations leave fingerprints across every RevOps source — pipeline stages in Salesforce, conversation intelligence in Gong, forecast rolls in Clari, campaign spend in HubSpot, and sequence telemetry in Outreach or Salesloft. Nobody buys a deal from one system, so no single system can credibly credit a deal to the fractional leader.
By 2027, the rise of AI in the funnel turns this hard problem into a contested one. When a fractional CRO retunes a lead-scoring model and conversion climbs, determining whether the human or the algorithm earned that improvement requires explicit weighting rules. Last-touch attribution shrugs; multi-touch spreads credit but cannot separate the operator from the tooling. The only honest instrument is fractional attribution with guardrails — each discrete CRO action (a re-architected sales stage, a re-priced tier, a coaching intervention) receives a weighted, auditable share of revenue, and every weight has a written justification. Power BI is the right home because Power Query can reach all of these sources and DAX can encode time-decay, position-based, or committee-adjusted logic without hard-coding a single answer.
Vendor consolidation adds another layer of complexity. As Outreach and Salesloft activity collapses into one feed, what appears to be a data-plumbing gift is actually a de-duplication hazard. Without proper reconciliation in Power Query, every sequence gets counted twice, inflating the fractional CRO's apparent pipeline influence. The architecture below addresses this by merging on deal ID or account name before any measure calculates ROI. For deeper context, see How to build a fractional CRO ROI dashboard in Power BI.
How do you build a unified star-schema model for RevOps ROI in Power BI?
Resist the urge to wire ten live connectors straight into a report — that path produces a model that is fast to build and impossible to reconcile. Instead, let Power Query do the extract-transform-load work into a governed Azure SQL or Snowflake warehouse first. Your fact table, Revenue_Events, holds one row per closed-won deal, stamped with the fractional CRO ID, the campaign ID, and an AI-touchpoint flag. Around it sit dimensions: CRO_Actions (each meeting, process change, and pricing edit as its own record), Time (built out to fiscal weeks so windowing works), and Attribution_Rules (the weighting policy itself — for example, first touch, CRO-led demo, and negotiation each carrying a stated share).
The unglamorous work is reconciliation. Use Power Query to normalize field names and types so Gong's "deal stage" and Salesforce's "opportunity stage" resolve to one canonical value through a lookup table — otherwise the same deal appears twice under two vocabularies. Apply incremental refresh policies so heavyweight Clari and HubSpot pulls don't force a full reload every cycle. Done right, this schema lets a single DAX measure answer "what was fractional ROI?" at campaign grain and account grain without the touchpoint overlap that produces flattering, wrong numbers.
Key DAX measure for fractional ROI:
Fractional_CRO_ROI = VAR TotalRevenue = SUM(Revenue_Events[Incremental_Revenue]) VAR TotalCost = SUM(CRO_Costs[Salary]) + SUM(CRO_Costs[Tool_Costs]) + SUM(CRO_Costs[Travel]) VAR AttributionFactor = AVERAGE(Attribution_Rules[Weight]) RETURN DIVIDE(TotalRevenue * AttributionFactor - TotalCost, TotalCost, 0)
Because the weight lives in a table rather than in the formula, a board member can inspect why a deal was credited the way it was — the measure is legible, not magical. A rolling 12-month reference in the Time dimension keeps that credit honest against 2027's long enterprise cycles.
Which attribution model should you choose for fractional CRO ROI?
There is no universal attribution model, so encode the choice as a visible artifact your stakeholders can challenge. Ship this decision tree inside the report as a reference tile so the assumption behind every credited deal is one click away rather than buried in a spec.

The branch that trips people up is the long-cycle path. A fractional CRO brought in to repair a broken MEDDIC qualification process on long enterprise deals does most of their damage early — mapping the economic buyer, fixing the decision criteria — so linear or last-touch models will systematically under-credit them. Time-decay is the only model that pays for early work. When AI touchpoints are present, the AI-adjusted branch caps what the tooling can claim so the human and the machine don't both file for the same momentum. Encoding this as a shared, inspectable rule is what turns "which model did you use?" from an accusation into a lookup.
How do you track and escalate fractional CRO ROI continuously?
ROI here is a heartbeat, not a snapshot — a monthly refresh that both recalculates and escalates. The loop below shows the refresh path and the alert thresholds that turn a dashboard into a decision engine, so a slipping engagement raises its own hand before the renewal meeting.

The merge-by-action-ID step is where vendor consolidation either helps or hurts you: fold Outreach and Salesloft into one feed and Power Query's de-duplication earns its keep; skip it and every sequence gets counted twice. The 3x and 1x gates come from published Bessemer Venture Partners benchmarks for fractional executive ROI, so the escalation isn't arbitrary — it's tied to an external standard a board already respects. Wire the red-alert branch to a Power Automate flow that emails the CEO the decomposition-tree drill path after each refresh, and the dashboard stops being a passive report and starts being an accountability mechanism. For the thresholds behind renewal decisions, see What benchmarks should trigger renewing a fractional CRO contract?.
Which Power BI visuals communicate fractional ROI to a board?
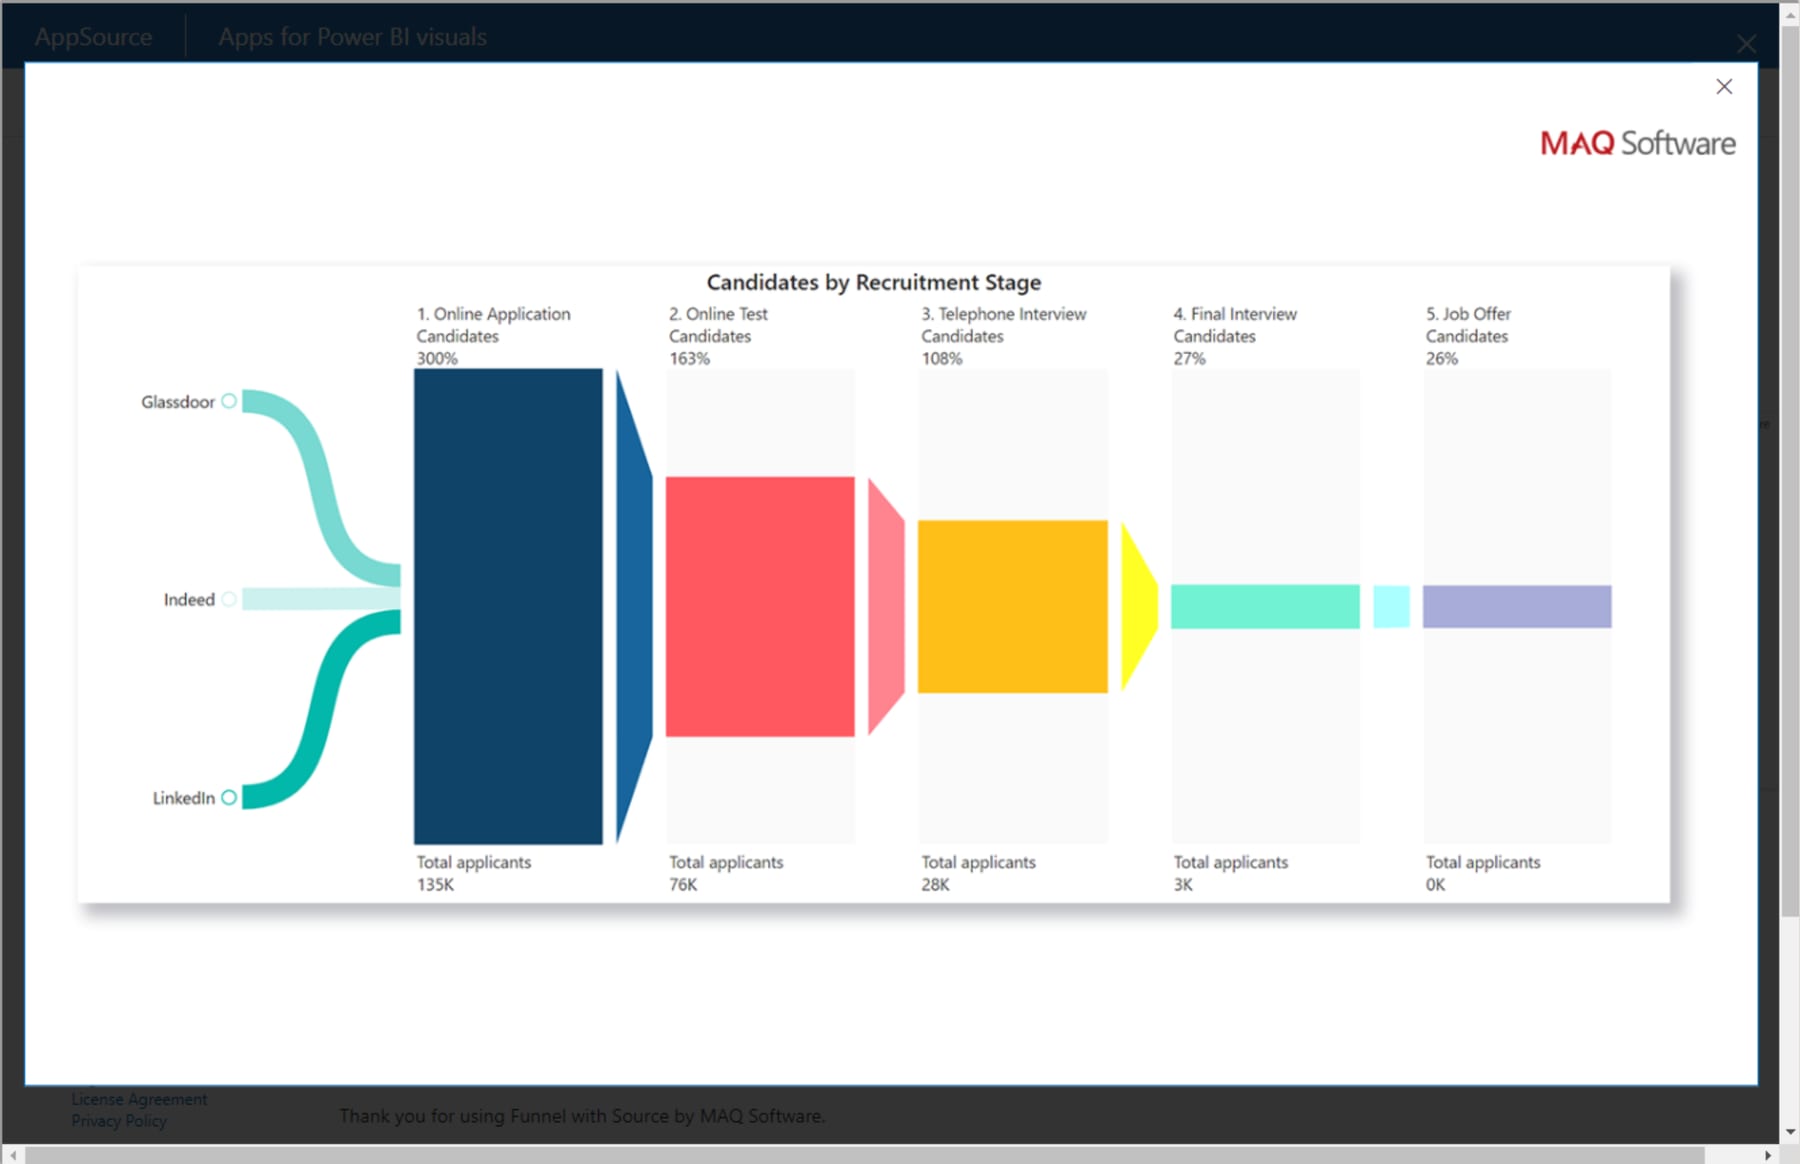
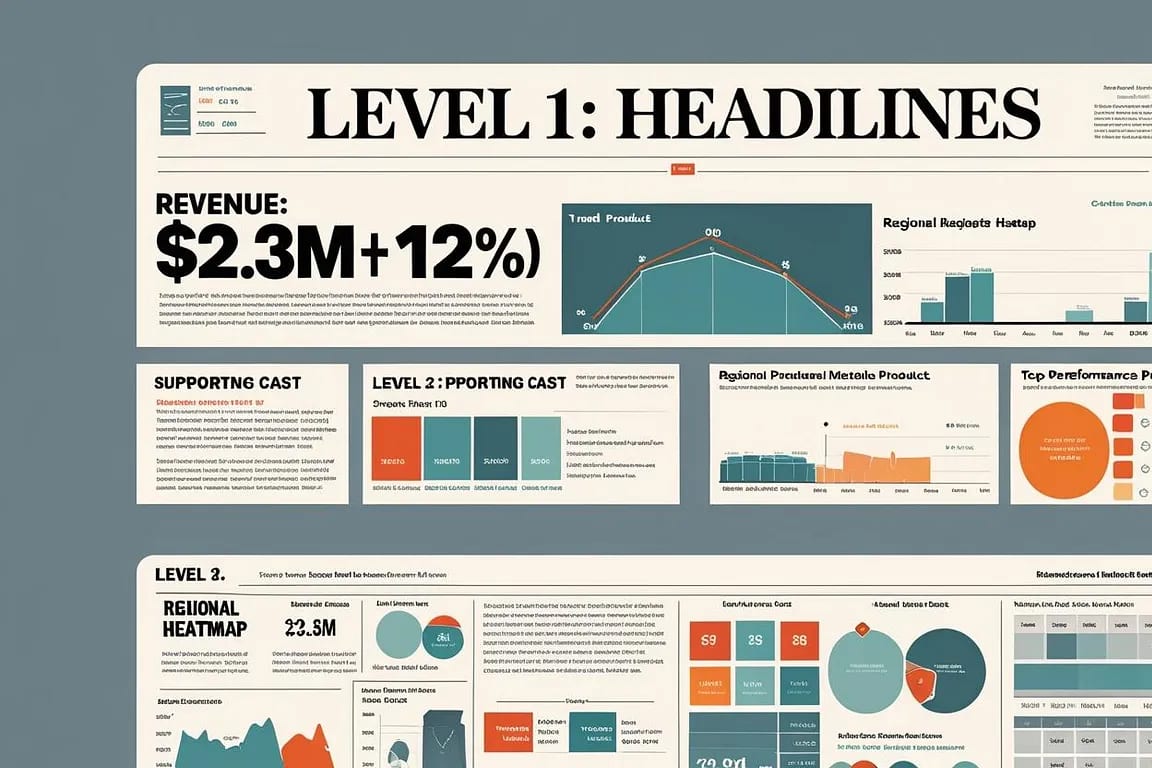
A board does not want a bar chart; it wants a decision. Lead with a custom KPI matrix that lines up cost per influenced pipeline, velocity (first touch to close), and win-rate lift beside fractional ROI for each channel — one glance, four judgments. Rows are the CRO Action — "Pricing restructure," "Sales playbook rewrite," "Territory reassignment" — and columns are the source feeds (Salesforce, Gong, Clari). For 2027, bolt on an AI Attribution Factor column sourced from Gong's AI-generated deal timeline: if Gong's model says the CRO's pricing change touched most of a deal's momentum, that share flows straight into the ROI weight and, crucially, caps what the AI tooling can separately claim, closing the double-counting loophole at the metric level rather than after the fact.
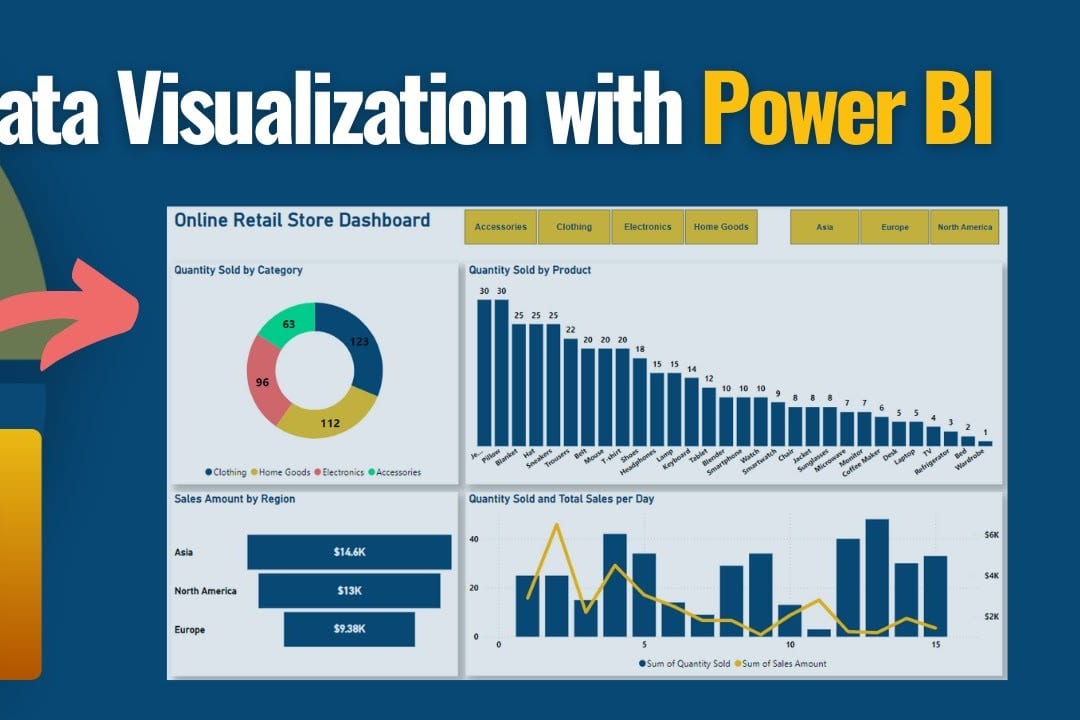
Behind the matrix, Power BI's decomposition tree is the workhorse precisely because it refuses to give you a single headline number and stop. Anchor the root at Fractional_CRO_ROI and let a skeptic expand it down whichever branch they distrust most — source system (Salesforce vs. Gong vs. Clari), campaign type (ABM via HubSpot vs. outbound via Salesloft), deal stage (Prospecting → Demo → Negotiation → Closed Won), or CRO action (process redesign vs. pricing change vs. team coaching). Add one split most dashboards forget — an AI_Flag isolating deals where an AI SDR set the meeting — because that branch is exactly where inflated ROI hides. For the time story, a line-and-clustered-column chart plots incremental revenue as bars against cumulative cost as a line across the attribution window, so the "when did this pay off?" question answers itself. Wire in slicers for MEDDIC criteria — "Economic Buyer Identified," "Decision Criteria Met" — and the fractional CRO can show ROI on qualified pipeline rather than hopeful pipeline, which is the number that actually renews a contract.
How do you handle buying committees, long cycles, and data quality?
Buying committees now run large, per Gartner's 2026 research, which quietly punishes fractional leaders in any simplistic model — more hands on a deal means each hand looks less decisive. Visualize the tangle with a Sankey diagram flowing each committee member's touchpoints into the CRO's actions, driven by a Committee_Size column on Revenue_Events, then correct for it with a deliberate multiplier: the harder it is to isolate one leader's influence in a crowded room, the more credit that leader deserves for still moving the deal.

Committee_Adjusted_ROI = VAR BaseROI = [Fractional_CRO_ROI] VAR CommitteeFactor = 1 + (AVERAGE(Revenue_Events[Committee_Size]) - 5) * 0.05 RETURN BaseROI * CommitteeFactor
Pair it with a "Last 12 calendar months" relative-date slicer so a nine-month cycle never gets judged against a stale, half-populated window, and use time-intelligence measures with flexible attribution windows so revenue is credited across the whole cycle rather than dumped on the closing month.
Multi-source data is messy in predictable ways, and each mess has a Power Query answer. Use merge and append to collapse duplicate records — matching Gong's AI deal timelines to Clari's forecast rows on deal ID or account name before either can double-count. Add conditional columns that flag deals missing MEDDIC fields ("No Economic Buyer Identified") and exclude them from ROI math, because an un-qualified deal in the numerator inflates every downstream metric. Run data profiling in the Power Query Editor to surface null costs and outliers from marketing automation before they poison an average. And for AI-influenced touches, compute a calculated column that assigns explicit fractional weights so the model states its assumptions out loud. The payoff is a dashboard that reflects real fractional ROI rather than the artifacts of unreconciled feeds — and in a market defined by AI-influenced funnels and vendor consolidation, the differentiator is not a prettier chart but a defensible one, with every weight, exclusion, and threshold written down where a board can inspect it.
Related questions
How do you separate a fractional CRO's impact from AI-driven automation in the funnel?
Create an AI_Flag column on each revenue event and split the decomposition tree by that flag. Weight the CRO's actions separately from AI-triggered touches using a dimension table that caps what each system can claim, preventing double-counting.
Which attribution model fits a long enterprise sales cycle with a large buying committee?
Time-decay attribution, with a committee-adjusted DAX multiplier that increases credit as committee size grows. This prevents long-cycle, multi-stakeholder deals from under-crediting early-stage CRO interventions like qualification-framework repairs.
What benchmarks should trigger renewing or ending a fractional CRO contract?
Use the 3x ROI gate for automatic renewal, the 1x–3x band for attribution-model review, and below 1x for escalation to the CEO. These thresholds align with published Bessemer Venture Partners fractional-executive benchmarks.
How do you prevent double-counting when Outreach and Salesloft data are consolidated?
Merge both feeds in Power Query on deal ID or account name before loading into the star schema. Apply a deduplication step that keeps the earliest or highest-fidelity record, then flag any merged rows for manual review.
What Power BI visuals communicate fractional ROI most clearly to a board?
A decomposition tree for drill-down from headline ROI to individual contributors, and a custom KPI matrix lining up cost per influenced pipeline, velocity, and win-rate lift beside ROI. Together they answer both "what's the number" and "why should I believe it."
FAQ
How do I connect multiple RevOps sources like Salesforce and HubSpot in Power BI? Connect each source individually through Power Query, then merge and reshape everything into one star-schema model rather than reporting off ten live connectors. Consolidating first is what lets CRM, revenue-intelligence, and marketing-automation data be analyzed side by side without duplicating the same deal under two different field names.
What is the formula for fractional CRO ROI in Power BI? Fractional ROI is (Incremental Revenue Attributed − Total Cost) / Total Cost. In DAX you build it as measures that sum attributed revenue and total cost across a campaign- or account-level dimension, apply the weighting factor from your attribution-rules table, and divide the difference by cost — keeping the weight in a table so the credit stays auditable.
How do I handle long enterprise sales cycles in Power BI time intelligence? Build a proper date table and DAX measures with flexible attribution windows — commonly 6 to 12 months for enterprise deals — so revenue is credited across the whole cycle. A rolling 12-month window and a "Last 12 calendar months" relative-date slicer stop a nine-month deal from being judged against a stale, half-empty period.
Can Power BI visualize AI-influenced touchpoints from tools like Gong? Yes. Import Gong's AI-generated deal timelines or influence scores into the model, then create measures that weight each fractional contribution and, critically, cap what the AI tooling can separately claim. Surface it in a decomposition tree or a KPI matrix column so the human-versus-algorithm split is visible instead of averaged away.
How do I avoid double-counting fractional contributions across sources? Create one source of truth by consolidating overlapping feeds — merging Outreach and Salesloft activity logs, for instance — before anything loads into Power BI, and match records on deal or account ID during the merge. Distinct attribution rules and DAX filters then guarantee each revenue event is credited exactly once, which is the failure mode vendor consolidation makes most common.
What visualizations work best for showing fractional CRO ROI to executives? A decomposition tree for drill-down from headline ROI to individual contributors, and a custom KPI matrix lining up cost per influenced pipeline, velocity, and win-rate lift beside ROI. Together they answer both "what's the number" and "why should I believe it," which is exactly what a board needs to renew or end an engagement.
How do I set up automated alerts for fractional CRO performance in Power BI? Use Power Automate flows triggered by DAX measure thresholds — for example, when Fractional_CRO_ROI drops below 1x, send an email to the CEO with the decomposition-tree drill path attached. Schedule the flow to run after each monthly data refresh to ensure timely escalation.
What is the minimum data history needed to start measuring fractional CRO ROI? At least six months of clean, reconciled data across all source systems. Anything shorter produces unreliable baseline comparisons for win-rate lift and velocity change, and the attribution model will lack enough revenue events to calculate meaningful weighted averages.
Sources
- Gartner: 2026 B2B Buying Cycle Report
- Forrester: Attribution Models for Fractional Executives
- Gong Labs: AI Influence on Deal Velocity
- Bessemer Venture Partners: Cloud Benchmarks
- SaaStr: Vendor Consolidation in RevOps
- Microsoft Power BI: Decomposition Tree Documentation
- Clari: Forecasting with AI and Fractional Leadership
- Salesforce: MEDDIC Framework for Enterprise Sales
- HubSpot: Multi-Touch Attribution in Power BI
- Microsoft: Power Automate Alerts and Flows
Related on PULSE
- How do I measure fractional CRO ROI in the first quarter in 2027?
- What ROI Should I Expect From a Fractional CRO in 2027?
- What is the ROI of a fractional CRO in 2027?
- How to align fractional CRO compensation tracking with RevOps commission tools in 2027
- How to build a closed-loop reporting system between a fractional CRO and your RevOps tools in 2027
- What metrics should a fractional CRO track in a RevOps tool like Clari or Gong in 2027
This page will be disappearing soon. Save it to your device for $1 — or read it free while it is here.
@Kory-White- · if Venmo asks, the last 4 of my number are 2012
This page is gone.
This one is off the shelf now. $1 keeps it on your phone for good — the whole page, pictures and diagrams included.
 pulse-toolsHow to configure Salesforce Opportunity Stages for fractional CRO engagement milestones in 2027
 pulse-toolsWhere do I find a fractional CRO in Connecticut in 2027?
 tlHow Many Membership Sales Reps Do I Need to Hire for My Gym in 2027?
 pulse-toolsHow Do I Build a Forecast Dashboard in ZoomInfo in 2027?
 pulse-toolsHow to audit your existing tech stack for gaps before implementing a RevOps tool in 2027
 pulse-toolsHow to build a closed-loop reporting system between a fractional CRO and your RevOps tools in 2027
 pulse-toolsHow Do I Configure Sequences Without Burning Your Domain in Apollo in 2027?
 pulse-toolsHow to set up automated lead scoring rules in a CRM without a dedicated RevOps team in 2027
 pulse-toolsHow to set up multi-touch attribution models in a RevOps tool for fractional executive analysis in 2027
 tlHow do I benchmark fractional CRO performance against industry KPIs in 2027?