


What Is the Average Home Price in a Suburb in 2027?
Quality
Certified
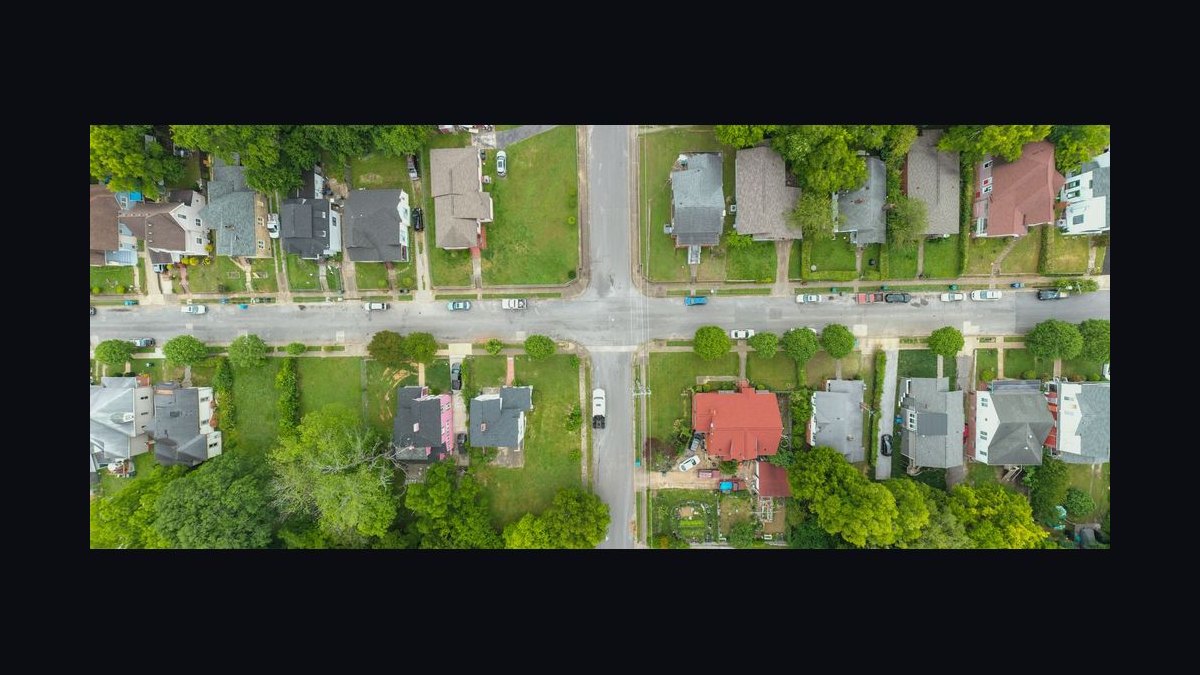
There is no single Average Home Price for a Suburb in 2027, because 2027 data does not exist and "suburb" is not a tracked national category. The best current anchor is the U.S. median existing-home sale Price, recently in the low-to-mid $400,000s, but suburban submarkets range from roughly $250,000 to over $1.5 million.
A household deciding whether to leave the city
Picture a two-earner household grossing $165,000 a year, currently renting a two-bedroom apartment near a downtown core for $2,600 a month. They have $70,000 saved and want a three-bedroom house with a yard. They type "average home price in a suburb" into a search bar, get a national number in the $400,000s, and assume that is roughly their budget. It is not, in either direction.
Run the same household through three real suburban archetypes. In a first-ring Suburb of a Midwest metro like Columbus or Kansas City, a 1,800-square-foot three-bedroom built in the 1990s commonly lists between $300,000 and $390,000. At 6.5% on a 30-year loan with 10% down, principal and interest lands near $1,900–$2,450 a month. Add property tax around $400 and insurance around $150, and total housing cost sits near $2,500–$3,000 — roughly 18–22% of gross income, comfortably inside conventional underwriting limits.
Move the same household to a close-in Suburb of Boston, Seattle, or the Bay Area peninsula and the identical house — same square footage, same vintage, arguably a smaller lot — prices between $900,000 and $1,600,000. Principal and interest alone at 6.5% on a $1,000,000 loan runs about $6,300 a month. That is $75,600 a year in mortgage payments before taxes and insurance, against $165,000 of gross income. The household is priced out of the house entirely, not marginally.
Now the third case: an outer-ring Suburb forty-five minutes further out in that same expensive metro. The house drops to $650,000–$800,000. It becomes theoretically reachable, but the payment still consumes roughly 35–40% of gross income, and the commute adds ninety minutes a day. The household has to decide whether the trade is worth it.
The point of this scenario is that the national Average is useless to all three versions of this household. What they actually need is a local median, a payment calculation, and a bracket of plausible 2027 outcomes. Everything below builds that.
How a suburban Price actually gets assembled
A suburban Home Price is not transmitted down from a national index. It is built locally from a stack of inputs, and each input moves on its own schedule. Understanding the stack lets you forecast your own market far better than any headline.
Start with land. In most suburbs the lot is a meaningful and often dominant share of value — heavily so in supply-constrained coastal metros, much less so where raw land is abundant. Land value is set by the intersection of commute access, school district boundaries, and how much surrounding area is legally permitted to be developed. Two identical houses on opposite sides of a school district line can differ by six figures for that reason alone.
Then replacement cost: lumber, concrete, labor, and permits. New construction sets a soft ceiling on resale wherever builders can actually build. If a builder can deliver a comparable new Home for $410,000 in the exurb ten minutes further out, a twenty-five-year-old resale in the closer Suburb has to price against that alternative, adjusting for lot quality, commute, and school access.
Layer on financing cost, the fastest-moving input. Mortgage rates translate almost mechanically into purchasing power. At a fixed monthly payment, roughly every one-percentage-point move in the 30-year rate shifts affordable loan size on the order of ten percent. Rates rise, the payment-constrained buyer's budget shrinks, and either prices soften or transaction volume collapses. In practice sellers resist nominal price cuts, so the first thing that breaks is volume, not Price.
Then inventory and turnover. The lock-in effect matters enormously: homeowners holding sub-4% mortgages face a real economic penalty for selling and re-borrowing at 6–7%, so they stay put. That suppresses listings, keeps months-of-supply low, and props up prices even when demand is weak. It is one reason the 2022–2025 rate shock produced far smaller price declines than a naive affordability model predicted.
Finally carrying costs — property tax, insurance, HOA dues. Buyers shop by monthly payment, so a Suburb with a 2.3% effective property tax rate will clear at a lower sale Price than an otherwise identical Suburb at 0.8%, because the tax eats budget that would otherwise service the mortgage. Insurance has become a live variable in wildfire, hurricane, and hail-exposed regions, where premiums have moved enough to visibly dent what buyers will pay.
Real numbers, ranges, and benchmarks
Here is what is genuinely knowable, stated as ranges rather than false precision.
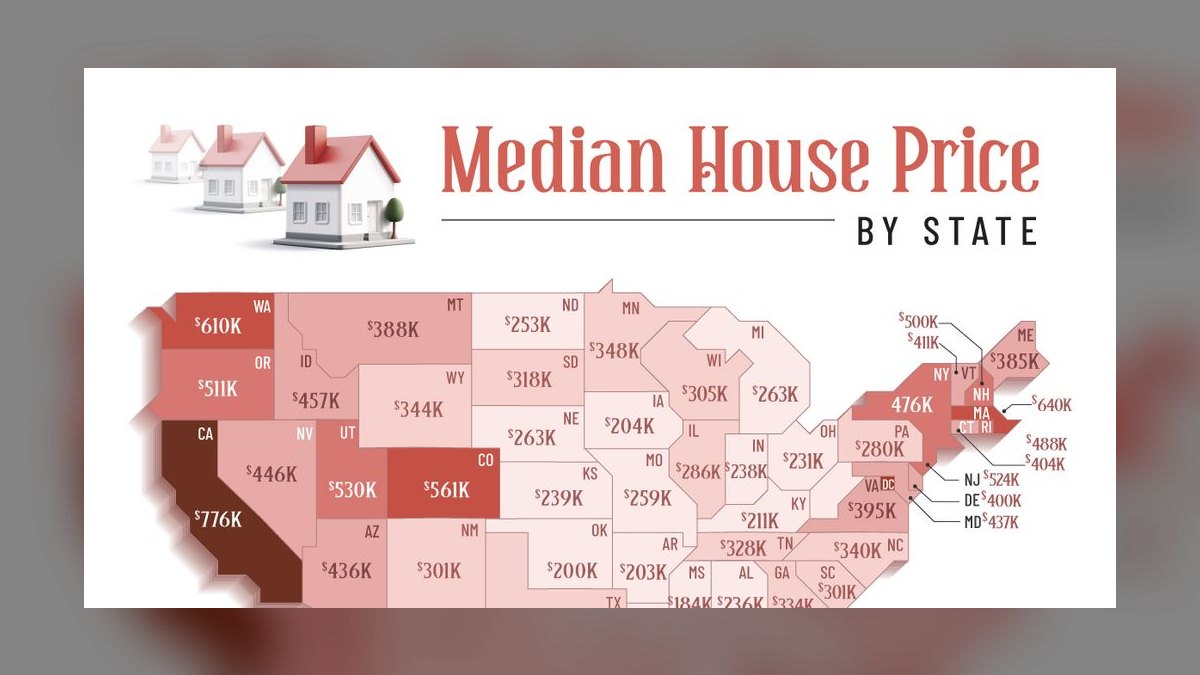
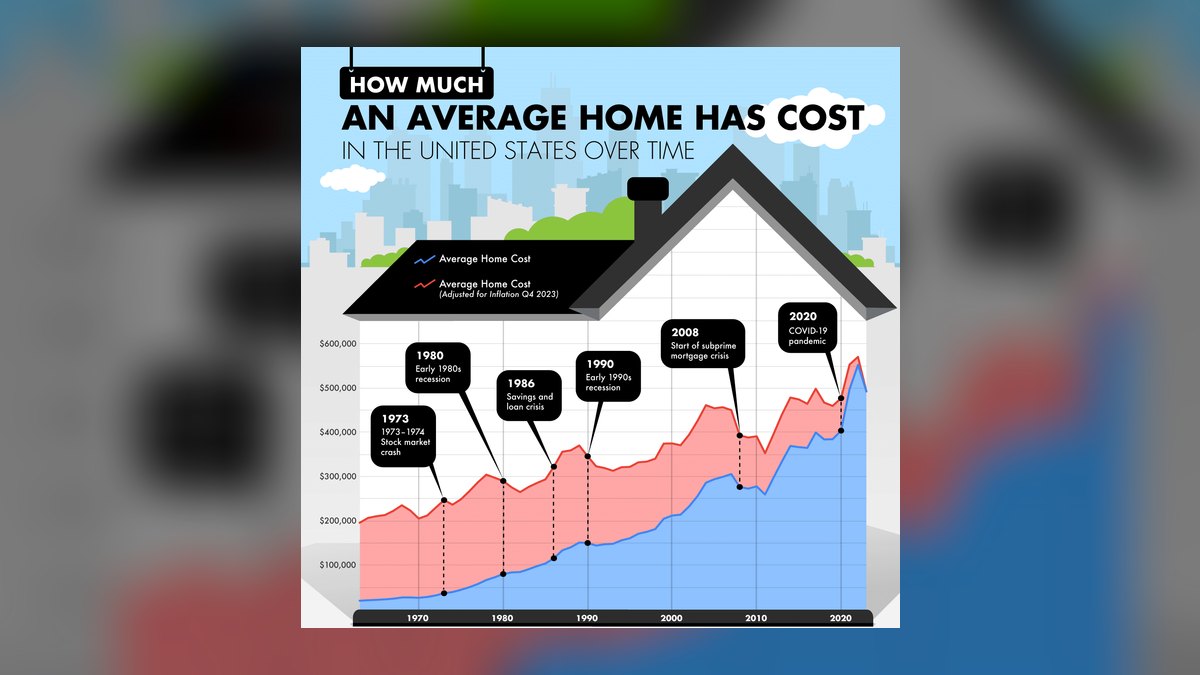
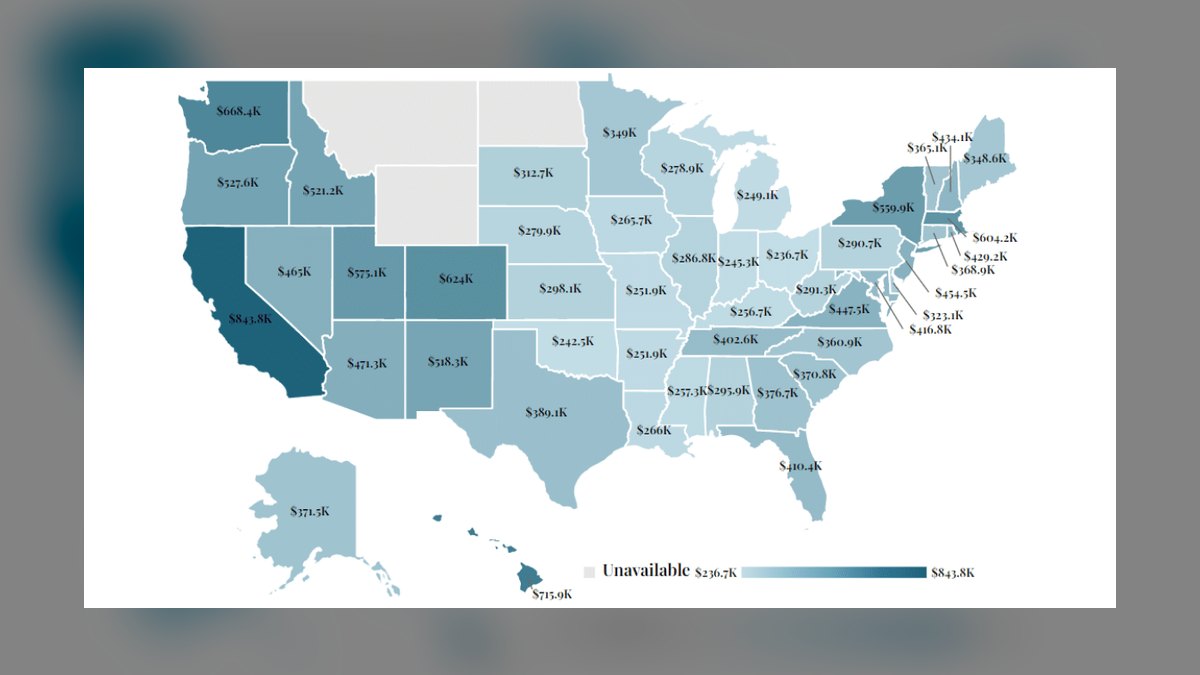
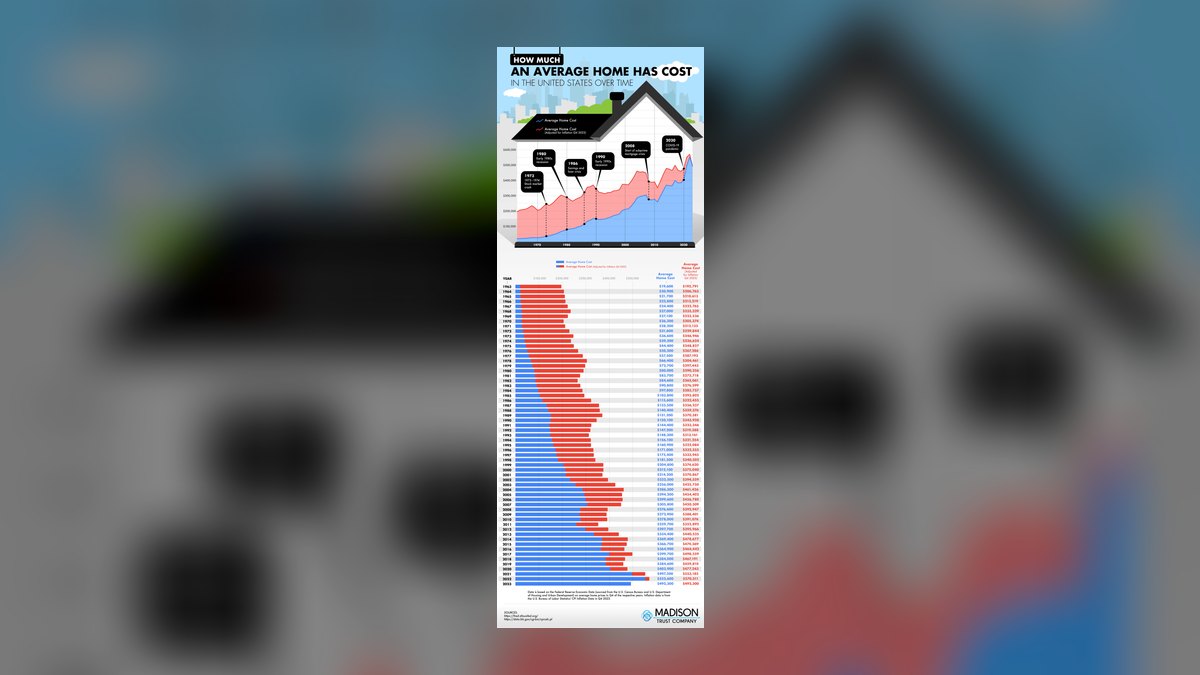
National medians. The U.S. median existing-Home sale Price, as tracked by the National Association of Realtors, has been running in the low-to-mid $400,000s in recent reporting. The Census Bureau's median new-Home sale Price runs somewhat higher in most periods, because new construction skews larger and better-equipped. Neither is a suburban number specifically — NAR's national series blends urban, suburban, and rural sales.
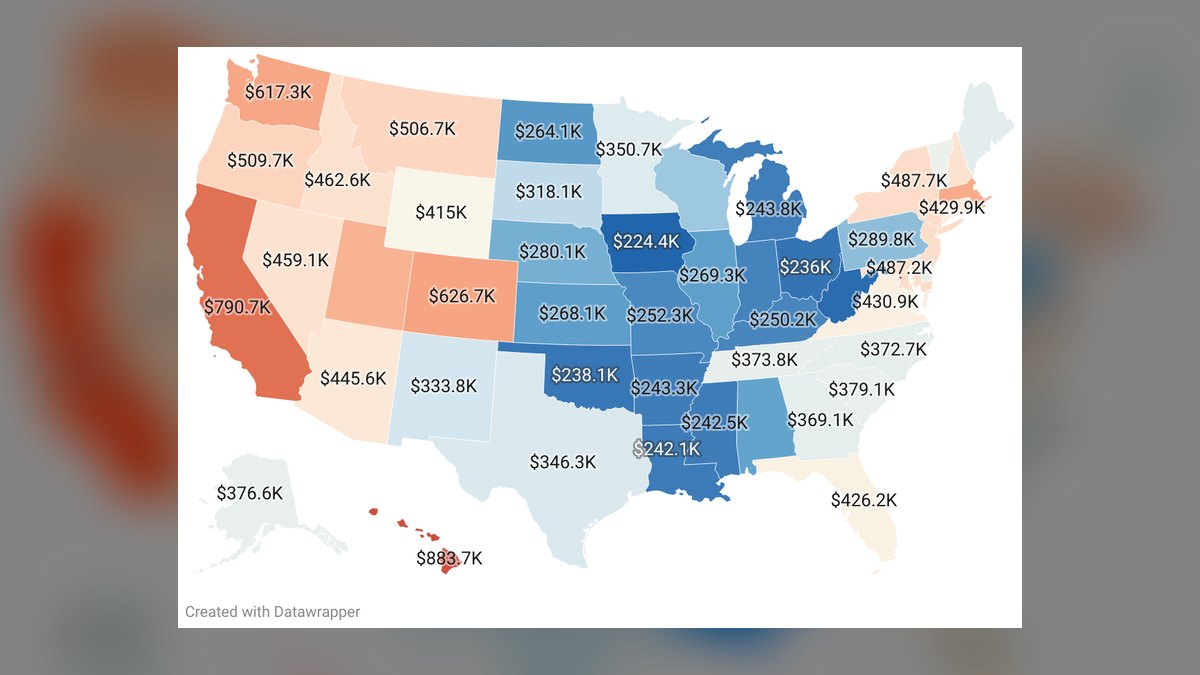
Metro dispersion is the whole story. Across large U.S. metros, median sale prices span roughly from the $200,000s in parts of the industrial Midwest and interior South to well over $1 million in the most expensive California and Northeast markets. That is a five-to-one spread. Any national Average sits in a band that describes almost nobody.
Within-metro dispersion. Inside a single metro, suburban submarkets typically spread two-to-one or wider from the cheapest outer-ring community to the priciest inner-ring one. School district reputation, commute time, and lot size drive most of that. A fifteen-minute difference in drive time to the primary job center is frequently worth 10–20% of Home value in the same metro.
How to build your own local number in about twenty minutes. Pull sold comps — not listings — for your target Suburb over the trailing 90 days, filtered to your property type and a bedroom and square-foot band around what you want. Take the median of the sold prices, not the mean. Then compute Price per square foot for those same sales and check whether your target property's asking price per foot sits inside the interquartile range. If it is above the 75th percentile, you need a specific, defensible reason. Cross-check with the county assessor's recorded sale prices, which are public and are actual transaction records rather than estimates.
Reading a forecast honestly. Credible housing forecasts — from Fannie Mae's Economic and Strategic Research group, the Mortgage Bankers Association, NAR, and the major index providers — typically project national price growth in low single digits over a one-to-two year horizon, and they revise those projections quarterly. Treat any specific 2027 number as a scenario, not a prediction. The useful move is to bracket: run your affordability math at a pessimistic case (prices flat, rates a point higher than today), a base case (low-single-digit appreciation, rates roughly flat), and an optimistic case. If the pessimistic case still works for you, the forecast question stops mattering.
Payment math you can do on a napkin. At roughly 6.5%, each $100,000 of 30-year mortgage principal costs about $630 a month in principal and interest. At 7.0% it is about $665. At 6.0% it is about $600. Add property tax (divide the annual assessment by twelve — often $200–$700 a month on a suburban Home depending on the state), insurance (commonly $100–$300 a month, considerably more in catastrophe-exposed areas), and any HOA. Lenders generally want total housing cost under roughly 28% of gross income and total debt under about 36–43%, though loan programs vary. Work backward from your income to the payment, then to the loan, then to the Price. That number — not a national Average — is your actual answer.
A worked example. Household gross income $165,000. At 28% front-end, maximum housing cost is $3,850 a month. Subtract $500 tax, $200 insurance, and $75 HOA, leaving $3,075 for principal and interest. At 6.5%, that supports a loan of roughly $487,000. Add a 10% down payment of about $54,000 and the household can shop to roughly $540,000. That is the real budget — and it is a number no national statistic will hand them.
Trade-offs and alternatives
Every household framing this question is really choosing among four options, and the right one depends on time horizon more than on price forecasting.
Buy now at a higher rate. You lock the Price and start building equity and principal amortization immediately. If rates fall later, you refinance — the Price is fixed, the rate is not. The risk is buying near a local peak and then needing to sell inside five years, when transaction costs (typically 6–9% round trip once you count agent commissions, transfer taxes, and closing costs) eat any modest appreciation.
Wait for rates to drop. The intuitive move, and often the wrong one. Lower rates expand every buyer's budget simultaneously, which in a supply-constrained Suburb tends to push prices up and revive bidding competition. You may trade a high rate on a lower Price for a lower rate on a higher Price and a worse negotiating position. Waiting genuinely pays when you are also using the time to enlarge the down payment, repair credit, or when local inventory is visibly building.
Keep renting. Underrated when the price-to-rent ratio in your target Suburb is high. Compute it: annual rent for a comparable Home divided into the purchase Price. Below roughly 15, buying tends to look strong; above roughly 21, renting and investing the difference often wins on a five-year horizon. This calculation is Suburb-specific and flips across a metro.

Widen the radius. Often the highest-leverage move. Going one ring further out, or crossing into an adjacent county, can cut the Price by 15–30% for a comparable house. The costs are real and should be priced honestly: additional commute time, higher fuel and vehicle expense, sometimes a weaker school district, and thinner resale liquidity. Convert the commute into dollars — extra minutes per day times working days times your effective hourly value — and compare it against the Price gap before deciding.
Two adjacent options deserve mention. House hacking — buying a duplex or a Home with a legal accessory dwelling unit — changes the math substantially in suburbs where zoning permits it, since rental income offsets the payment and some loan programs let you count projected rent toward qualifying. And new construction incentives: builders sitting on standing inventory frequently offer rate buydowns worth more in monthly terms than an equivalent Price cut, because a permanent buydown of one to two points reshapes the payment for the life of the loan.
Common pitfalls and how to avoid them
Confusing list Price with sale Price. Listing data is what sellers hope for. Sold data is what buyers paid. In cooling markets the gap widens; in hot ones homes clear above ask. Always anchor on recorded sales.
Treating an automated valuation as an appraisal. Consumer AVM estimates are useful for ballparking and terrible for negotiating. Their published error rates are meaningful, and they degrade badly on atypical properties, recently renovated homes, and thin-transaction neighborhoods. An appraiser walking the property will produce a different number, and the lender only cares about the appraiser's.

Ignoring the tax reassessment on transfer. In many jurisdictions the property is reassessed at sale Price, so the seller's current tax bill is not the one you will pay. People routinely underwrite a purchase against the listing's stated taxes and then get a bill 30–60% higher the following year. Check your county's reassessment rules before you write the offer.
Underpricing insurance. In wildfire, hurricane, hail, and flood-exposed regions, premiums have moved sharply and some carriers have withdrawn entirely. Get an actual quote — bound, in writing — during your inspection period, not after closing. A Suburb that looks affordable on Price can fail on insurability.
Forgetting deferred maintenance. Roof, HVAC, water heater, sewer lateral, and windows are the big-ticket items. A twenty-year-old suburban Home with original systems carries a realistic five-year capital budget in the tens of thousands. Budget roughly 1–2% of Home value annually for maintenance and reserves; older housing stock skews higher.
Assuming HOA dues are static. They rise, and special assessments arrive without warning — most painfully for roofs, private roads, and amenity replacement. Request the association's reserve study and recent minutes. Underfunded reserves are a leading indicator of a future assessment.
Extrapolating a single year. One year of local price movement is noise, especially in a small Suburb with a few hundred annual transactions. Look at five and ten year trends, and look at inventory and days-on-market, which turn before Price does. Rising months-of-supply and lengthening days-on-market are the earliest reliable signal that prices are about to soften.
Believing a specific future number. Anyone quoting a precise Average suburban Home Price for 2027 is extrapolating, not reporting. Ranges and scenarios are honest; point estimates about the future are not.
Related questions
Is the median or the mean the better measure for Home prices?
The median. Housing prices have a long right tail, so a few very expensive sales pull the mean well above what a typical buyer pays. Nearly all reputable housing series — NAR, Census, and most local MLS reports — publish medians for this reason.
Why do suburbs in the same metro differ so much in Price?
School district boundaries, commute time to job centers, lot size, and how much new construction local zoning permits. Crossing a district line or adding fifteen minutes of drive time routinely shifts value by ten to twenty percent for an otherwise identical house.
Does a lower mortgage rate always make buying cheaper?
No. Lower rates expand every buyer's budget at once, which in supply-constrained suburbs bids prices up. You may pay less interest on a larger loan against a higher Price, with less negotiating leverage. The Price is permanent; the rate can be refinanced.
What price-to-rent ratio favors buying?
As a rough heuristic, below about 15 favors buying, above about 21 favors renting and investing the difference, with the middle range depending on how long you will stay and how much you value stability. Compute it with local comparable rents, not national figures.
How far out should I look before the savings stop being worth it?
Price the commute. Multiply extra daily minutes by working days and your effective hourly value, add fuel and vehicle wear, and compare that annual figure against the Price gap amortized over your expected tenure. Savings often stop justifying the drive past roughly 45–60 minutes each way.
FAQ
What is the Average Home Price in a Suburb in the United States?
There is no reliable single figure, because federal and industry statistics do not break out "suburban" as a category nationally. The closest available anchor is the national median existing-Home sale Price, which has been running in the low-to-mid $400,000s in recent reporting, blending urban, suburban, and rural transactions. Suburban submarkets in high-cost coastal metros commonly run two to four times the median of Midwest and interior-South suburbs, so the national number describes very few actual buyers.
Can anyone accurately predict what a Suburb will cost in 2027?
No, and you should distrust anyone offering a precise figure. Reputable forecasters — Fannie Mae's research group, the Mortgage Bankers Association, NAR — publish national projections that they revise quarterly, typically in low single digits of annual growth, and those are scenarios rather than predictions. For your own planning, bracket three cases and confirm the pessimistic one still works financially.
Where can I find a trustworthy Price for one specific Suburb?
Three sources, cross-checked. Your county assessor or recorder publishes actual recorded sale prices, which are transaction facts rather than estimates. Your local Realtor association typically publishes monthly median sale Price and days-on-market by community. FHFA's house price index gives repeat-sales appreciation at the metro level, which is resistant to the mix-shift distortions that move medians.
Why did the median in my Suburb jump when nothing seemed to change?
Almost certainly mix shift. Median sale Price reflects what sold, not what homes are worth. If entry-level buyers drop out because rates rose, the remaining transactions skew toward larger and more expensive properties and the median climbs even though no individual Home appreciated. A repeat-sales index tracking the same properties over time is the correct cross-check.
How much should I budget beyond the purchase Price?
Plan on closing costs of roughly 2–5% of the Price for a buyer, then ongoing property tax, insurance, and about 1–2% of Home value per year for maintenance and reserves, skewing higher for housing stock over twenty years old. If there is an HOA, request the reserve study — underfunded reserves reliably precede special assessments.
Does buying in a cheaper outer Suburb actually save money overall?
Frequently yes, but less than the sticker gap suggests. A ring further out can cut the Price 15–30%, while adding commute time, fuel, vehicle depreciation, and sometimes weaker schools and thinner resale liquidity. Convert those into an annual dollar figure and compare against the Price difference amortized over how long you actually plan to stay.
Sources
- https://www.nar.realtor/research-and-statistics/housing-statistics/existing-home-sales
- https://www.census.gov/construction/nrs/index.html
- https://www.fhfa.gov/data/hpi
- https://www.spglobal.com/spdji/en/index-family/indicators/sp-corelogic-case-shiller/
- https://www.consumerfinance.gov/owning-a-home/
- https://www.freddiemac.com/pmms
- https://www.fanniemae.com/research-and-insights/forecast
- https://www.mba.org/news-and-research/forecasts-and-commentary
- https://www.jchs.harvard.edu/state-nations-housing-2024
- https://www.hud.gov/topics/buying_a_home
Related on PULSE
- How to read a comparative market analysis before making an offer
- Price-to-rent ratio: when renting beats buying in your metro
- How mortgage rates translate into purchasing power
- Property tax reassessment at sale: what buyers get wrong
- Homeowners insurance in catastrophe-exposed markets
- Deferred maintenance budgeting for older suburban housing stock
This page will be disappearing soon. Save it to your device for $1 — or read it free while it is here.
@Kory-White- · if Venmo asks, the last 4 of my number are 2012
This page is gone.
This one is off the shelf now. $1 keeps it on your phone for good — the whole page, pictures and diagrams included.
 pulse-recentHow Much Does It Cost to Buy a Home in a Small Town in 2027?
 pulse-townsBest Sun Belt Cities for Young Professionals in 2027
 pulse-recentTop 10 Retirement Towns in Ohio in 2027
 pulse-townsTop 10 Best Suburbs of Dallas in 2027
 pulse-recentTop 10 Retirement Towns in Minnesota in 2026
 pulse-townsTop 10 Best Suburbs of Columbus in 2027
 pulse-townsTop 10 Best Towns to Live in Iowa in 2027
 pulse-recentTop 10 Best Towns to Live in the Northeast in 2027
 pulse-townsThe 10 Best Suburbs Near Chicago, Illinois in 2027
 pulse-townsHow Much Does It Cost to Live in a Small Town in 2027?