


How do you build a data observability (Monte Carlo / Bigeye) go-to-market motion in 2027?
Quality
Certified

Sell to a five-seat data committee led by the VP of Data Engineering, price per monitored table plus per user between $25K and $500K a year, and compress the cycle with a 30-day pilot on 50 tables that proves faster detection and lower MTTR. Win one wedge, land one team, then expand.
Segment the market and name the ICP before you build pipeline
The data observability buyer is never one person — it is a committee that grows with company size, and skipping any seat stalls the deal in procurement. Above roughly $500M in revenue a platform purchase touches about five stakeholders, each weighing a different risk and each needing a different proof point.
- VP Data Engineering owns the product call and is your economic-adjacent champion — they feel the 2 a.m. pages when a pipeline breaks silently and a dashboard ships bad numbers to the executive team. Sell them time-to-detect and mean-time-to-resolution.
- Head of Analytics owns business trust in dashboards and data products. They care whether the CFO's board deck is correct. Sell them coverage of the tables that feed executive reporting and revenue models.
- CTO / Head of Platform owns integration depth — Snowflake, Databricks, BigQuery, Redshift, dbt, Airflow, Fivetran, Tableau, Looker, Power BI, Mode, Hex, Sigma. They reject any tool that doesn't sit natively in the stack. Sell them native connectors and pushdown that doesn't blow up warehouse credits.
- CISO owns sensitive-data scanning and classification and gates anything that reads production data. Sell them SOC 2, in-warehouse execution with no data exfiltration, and PII-aware monitoring.
- CFO owns the SaaS contract and the ROI story, and approves spend only against a hard number — data-incident reduction, analyst hours recovered, or a bad-decision cost avoided.

Segment the market into three tiers and run a different motion for each. Enterprise accounts — data-mature companies of the Notion / Snowflake / Databricks / Stripe / DoorDash class, plus customer-data-savvy DTC, retail, fintech, and B2B SaaS leaders — run 9-to-18-month cycles at $50K–$500K+ ACV. Mid-market buyers (roughly 1,000–25,000 employees) run 3-to-9-month cycles at $10K–$50K ACV. SMB single-team buyers close in 30–90 days at $5K–$10K ACV. Your beachhead ICP is the mid-market data team that already runs dbt on a cloud warehouse, has been burned by at least one visible data incident, and has a named owner for data quality but no dedicated observability tool. That profile has budget authority within reach of the VP Data Engineering, a concrete pain event you can reference, and no incumbent contract to unwind — the shortest path from first call to signed deal in the entire market.
The motion that fits each segment
Match the sales motion to the tier — one uniform playbook across all three wastes money at the bottom and loses trust at the top. At SMB, run product-led growth plus inside sales: self-serve trial, virtual demo, and a 30-day free run, closed by an SDR in 30–90 days. At mid-market, run a field rep paired with the VP Data Engineering champion over 3–9 months. At enterprise, run a field executive plus C-suite alignment and a multi-team pilot over 9–18 months.

The single highest-leverage play across every tier is the 30-day pilot on 50 monitored tables, run side-by-side with the incumbent or against no tooling at all. During the pilot you instrument four metrics and report them weekly: time-to-detect-incident, MTTR, false-positive rate, and a data-team trust score. A concrete pilot that surfaces a real, previously-invisible incident in the first two weeks is what converts a skeptical committee — win rates climb sharply once a pilot ships a documented catch versus a slide deck of promised value. Scope the 50 tables deliberately: pick the ones that feed the CFO's board deck and the top three revenue dashboards, because a catch on a table nobody watches proves nothing, while a catch on the pipeline behind executive reporting sells itself upward without you in the room.
Anchor the wedge on three proofs that each earn specific votes. AI-driven anomaly detection plus LLM-assisted incident triage earns the VP Data Engineering vote by cutting MTTR directly. dbt-native lineage and first-class dbt-test / Airflow-DAG awareness earns the CTO and Head of Platform votes by rooting alerts in upstream cause, not downstream symptom. The 30-day 50-table pilot with measured ROI earns the Head of Analytics and CFO votes by turning trust into a number. Against the category leaders — Monte Carlo and Bigeye at the enterprise top, Acceldata with on-prem reach, Anomalo and Validio on ML anomaly, Datafold and Metaplane on dbt-native, Soda and Great Expectations on open-source — you do not out-incumbent them. You out-niche them: pick one wedge, win it decisively, then expand.
Unit economics and benchmarks

Price on three axes so the deal scales with the customer's own data footprint. The per-organization annual platform fee runs $25K–$500K depending on tier, with data-mature enterprises at $250K–$500K+. Layer per-monitored-table consumption at roughly $5–$50 per table per year, and per-user pricing at $200–$500 per year for each data-team user. Add expansion levers on top: AI incident-triage credits priced per LLM call, and module attach — ML anomaly detection, column-level lineage, observability lake, and data-contract enforcement — at $10K–$100K per year each. This structure lets an SMB start at $5K and a large enterprise land above $500K without renegotiating the model.
The benchmark numbers a board will hold you to in this market: win rate of 28%–45% (rising toward the mid-50s when a 30-day pilot ships a real catch), net revenue retention of 115%–138%, CAC payback of 6–14 months, and gross margin of 75%–85%. NRR above 115% is the whole thesis — you land one team and expand through added users, added modules, and AI attach. Outbound pipeline costs roughly $2,200–$8,000 per qualified opportunity; inbound content and SEO earns leads at roughly $220–$880 CPL, which is why the channel mix leans on partner co-sell to keep blended CAC down. Model the payback bridge explicitly: an $18K mid-market land at a 7-month payback only holds if the CSM converts it to a two-team expansion inside the first year, so treat first-year net expansion as a leading indicator of CAC health, not a lagging one.

Build the channel mix to about 25% inbound (Locally Optimistic, the Modern Data Stack community, dbt Coalesce, Forrester, Gartner, Data Engineering Weekly, r/dataengineering, plus G2 and Capterra reviews and SEO on queries like "best data observability 2027" and "Monte Carlo or Bigeye alternative"), 30% partner-led (Snowflake, Databricks, BigQuery, Redshift, dbt, Fivetran, Tableau, and Power BI ecosystem cross-sell, plus system integrators such as Brooklyn Data, Tropic, Snowplow, Datacoves, and 4 Mile Analytics), 35% outbound (field reps targeting Global 2000 and high-growth data-native accounts), 5% conference (dbt Coalesce, Snowflake Summit, Databricks Data + AI Summit, Data Council, and the Modern Data Stack conference circuit), and 5% existing-customer multi-team expansion. Partner co-sell matters most because a Snowflake or Databricks certification puts you in the room where budget already exists, cutting the cycle and the acquisition cost at the same time. A single sourced-and-influenced co-sell relationship can move blended CAC payback from the 14-month ceiling toward the 6-month floor, which is the difference between a fundable motion and a cash-hungry one.
Common misfires that kill the number
False-positive fatigue is the fastest way to lose a data team. Naive threshold-based anomaly detection floods engineers with alerts, they mute the tool inside a month, and renewal dies. The fix is ML-tuned, seasonality-aware thresholds plus business context so the alerts that fire are the ones worth a page. Track false-positive rate as a first-class KPI in every pilot and every QBR, and set an explicit target — under roughly 15% of alerts dismissed as noise — because an unmeasured false-positive rate always drifts upward until the team stops looking.
Integration drift is the second killer. Without first-class dbt-test and Airflow-DAG awareness, observability flags a broken downstream dashboard but never points to the upstream model that caused it, and the data team has to root-cause by hand — exactly the work they bought you to remove. Enterprise buyers test this in the pilot, so your connectors have to expose lineage back to the source, not just fire freshness and volume alarms.

Warehouse cost spikes turn a champion into a detractor. Frequent observability scans can meaningfully inflate Snowflake or Databricks credit consumption, and the CTO who approved you will pull the plug when the cloud bill jumps. Smart sampling and query pushdown are mandatory, and you should show the projected credit cost in the pilot report so there are no surprises at renewal. A good rule of thumb: monitoring overhead should stay under 5% of the warehouse spend it protects, and you should say that number out loud before the CTO asks.
Open-source disruption compresses the floor of the market. Soda Core, Great Expectations, dbt tests, and Elementary commoditize basic freshness, volume, and schema checks at $0. If your pitch is "we do checks," an engineer will build it in a weekend. Differentiation has to live in ML anomaly detection, LLM incident triage, lineage depth, and a UX the whole data team actually adopts — the things a scrappy open-source stack won't reproduce cheaply.
The fifth misfire is mispricing the entry. Three-year enterprise contracts scare switchers who are trying to leave an incumbent; lead with a one-year deal plus consumption so the buyer can prove value before committing. Save the multi-year discount for the expansion motion once a team is live and clean for 60 days. The sixth, quieter misfire is selling coverage instead of trust — a committee does not buy the number of monitored tables, it buys the confidence that the board deck is right, so anchor every proof point on a decision the customer would have gotten wrong without you.
Operating model and cadence

Sequence hiring so go-to-market capacity arrives just ahead of demand, not after it. The first five hires: a founder-led seller or ex-Monte-Carlo / ex-Bigeye executive for credibility, a data-practitioner-turned-AE who speaks the daily-user language, a field rep who owns the 3-to-9-month regional cycle, an implementation and solutions-architect lead who owns the 30-day pilots, and an ecosystem partner lead who owns the Snowflake and Databricks certifications. The first ten add two more field reps, an inside SDR plus PLG ops, a partner manager, an integration engineer, and a content-plus-developer-advocate marketer. The first twenty-five layer in eight-to-twelve field reps, a VP Sales, a VP Customer Success, four-to-six solutions architects, an enterprise specialist, a demand-gen and content manager, a RevOps analyst, and a security lead to satisfy CISO reviews at scale.
Launch in phases. Beachhead: mid-market buyers in two-to-three regions, inside-and-field hybrid, targeting roughly 80 logos in the first 12 months. Expansion: move up into mid-market multi-team accounts of 1,000–25,000 employees, hire three-to-five field reps, and push ACV from the $5K–$10K entry into the $10K–$50K band. Adjacent: by years five to seven, add enterprise — the data-native and customer-data-savvy leaders — staffed by ex-Monte-Carlo, ex-Bigeye, and ex-Acceldata field executives chasing five-to-ten logos at $50K–$500K+ ACV.
Run the business on a fixed cadence so nothing silently drifts. Daily: platform uptime, integration health, and the key-workflow alert queue. Weekly: pipeline and pilot status against the four pilot metrics. Monthly: user, module, and AI attach plus the NRR cohort. Quarterly: enterprise QBRs and multi-team expansion planning. Annually: the dbt Coalesce pipeline pull and a security penetration test to keep the CISO seat comfortable at renewal. This cadence is what converts a good pilot into 115%–138% net revenue retention year over year, and it is what keeps the revenue engine legible to a board that will otherwise assume drift wherever it can't see a number.
Related questions
How is a data observability motion different from an APM or infra observability motion?
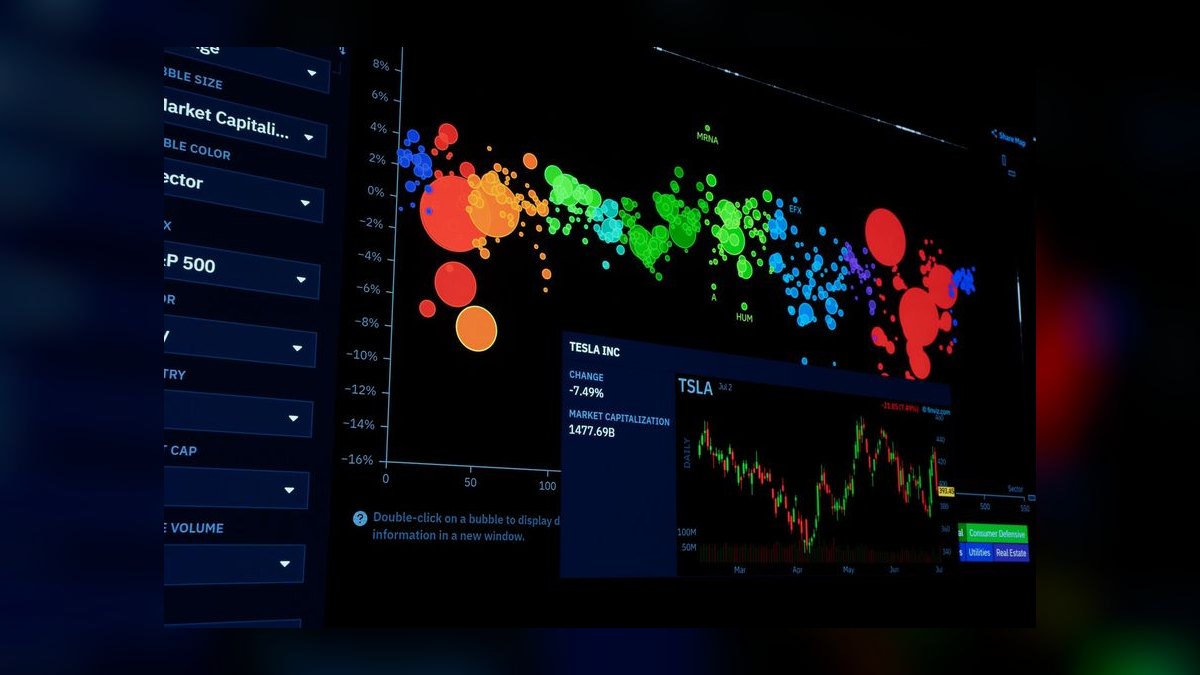
The buyer moves from the SRE org to the data org — VP Data Engineering and Head of Analytics instead of DevOps. The pain is silent bad data reaching dashboards, not server downtime, so the proof metric is time-to-detect a data incident, and integration targets are warehouses and dbt rather than Kubernetes.
Should you go open-source-led or enterprise-sales-led first?
Pick one wedge. Open-source-led (Soda, Great Expectations style) builds bottom-up developer adoption and low CAC but slow monetization. Enterprise-sales-led (Monte Carlo, Bigeye style) lands bigger ACV faster but needs field reps and long cycles. Do not run both motions half-strength; choose by your team's DNA.
What proves ROI to a skeptical CFO?
A documented incident the pilot caught before it reached an executive dashboard, translated into analyst hours saved and a bad-decision cost avoided. Pair that catch with the projected warehouse-credit cost so the CFO sees net savings, not just a new line item.
Which sub-verticals are most underserved in 2027?
Real-time streaming observability, AI/ML model observability (crossover with the Arize / Fiddler / WhyLabs space), data-contract enforcement (Gable / Schemata / Atlan adjacency), and industry-specific coverage for financial services, healthcare, pharma, and government.
FAQ

What's the right opening price for a mid-market organization in 2027? A one-year baseline platform fee plus per-user or per-monitored-table consumption, landing in the $10K–$50K ACV band for mid-market. Avoid three-year contracts up front — a one-year term wins switchers who are trying to leave an incumbent and want to prove value first.
How do you compete against Monte Carlo, Bigeye, and Acceldata? You don't out-incumbent the leaders. Out-niche them by picking one wedge and owning it: open-source-first (Soda, Great Expectations, dbt tests, Elementary), dbt-native (Datafold, Metaplane, Elementary), or ML-anomaly detection (Anomalo, Validio, and Bigeye's AI features). Win the wedge, then expand into the adjacent surface.
What's the right CAC payback target? Six to fourteen months. Multi-year enterprise contracts and module attach smooth the payback, while partner co-sell through Snowflake and Databricks lowers the acquisition cost that drives it.
How long should the pilot be? A 30-day pilot on 50 monitored tables. That's long enough to exercise the core alerting workflow, test warehouse and dbt integration, catch at least one real incident, and produce an ROI number the committee can act on.
What's the right multi-team expansion play? After single-team go-live plus 60 clean days, the CSM triggers expansion with the VP Data Engineering, Head of Analytics, CTO, and CFO. Offer an enterprise discount, a dedicated solutions architect, and a portfolio-wide coverage dashboard to justify the larger commitment.
What's the typical net revenue retention for data observability? Roughly 115%–138%. Expansion comes from added data-team users, module attach (ML anomaly, lineage, observability lake, data-contract enforcement), and AI incident-triage credits layered onto the base platform.
Sources
- https://www.montecarlodata.com/
- https://www.bigeye.com/
- https://www.acceldata.io/
- https://www.soda.io/
- https://greatexpectations.io/
- https://www.getdbt.com/
- https://www.gartner.com/en/information-technology/insights/data-and-analytics
- https://www.forrester.com/technology/data-management/
- https://www.snowflake.com/summit/
- https://www.databricks.com/dataaisummit
Related on PULSE
- How do you build a data catalog and governance (Collibra / Alation) go-to-market motion in 2027?
- Data Engineering Services GTM Playbook 2027 — Snowflake Premier + Databricks Champion + LLM RAG and the phData Operator Path
- How do you build a climate risk analytics (Jupiter Intelligence / Cervest) go-to-market motion in 2027?
- How do you build a carbon credit marketplaces go-to-market motion in 2027?
- How do you build a commodity trading platforms go-to-market motion in 2027?
- How do you build a forestry management software go-to-market motion in 2027?
This page will be disappearing soon. Save it to your device for $1 — or read it free while it is here.
@Kory-White- · if Venmo asks, the last 4 of my number are 2012
This page is gone.
This one is off the shelf now. $1 keeps it on your phone for good — the whole page, pictures and diagrams included.
 gtm-playbookGTM Playbook for MarTech and AdTech — The Complete Operator Guide in 2027
 gtm-playbookHow do you build a court and case management software go-to-market motion in 2027?
 pulse-recentWhat are the concrete steps to recruit and sign your first 10 channel partners in 2027?
 gtm-playbookHow do you build a procurement and spend management go-to-market motion in 2027?
 gtm-playbookWhat is the go-to-market playbook for a partner-led (channel) motion in 2027?
 gtm-playbookGTM Playbook for Kitchen and Bath Remodelers in 2027
 gtm-playbookHow do you build a distribution and wholesale ERP go-to-market motion in 2027?
 pulse-recentGTM Playbook for Specialty Retailers — Niche Assortment, Local SEO, and the Cluster Strategy in 2027
 gtm-playbookBranding and Design Agency GTM Playbook 2027 — AI-Augmented Production, Cannes Lions Awards, and the $148M Pentagram Operator Path
 gtm-playbookHow do you build a robotic process automation (UiPath / Automation Anywhere) go-to-market motion in 2027?