


Top 10 Sales KPIs for Modular and Prefab Construction in 2027
Quality
Certified

The 10 best sales kpis for modular and prefab construction are ranked below on measured performance, build quality, price, and how each one actually holds up in daily use rather than how it reads on a spec sheet. Each pick lists what it costs, who it suits, and what it gives up against the one above it, so the list can be read straight down without doubling back.
1Factory Capacity Booked

Factory Capacity Booked ranks first because in modular sales the plant line rate is the binding constraint, not demand, and unsold capacity is lost forever. Target 75-90% booked on a rolling 12-month basis, with 95%+ for the next six months. Booked means contracted with a 5-15% non-refundable deposit or issued NTP, never soft pipeline. Lines below 60% booked lose roughly $4M-$8M per month in absorption.
This KPI is for sales leaders and CROs running a fixed-throughput plant where every empty production slot is unrecoverable revenue. It trades away top-of-funnel comfort: a rep can hit dollar quota while still wrecking the metric by booking into already-saturated months. It outranks Qualified Project Pipeline Coverage because coverage measures intent while this measures contracted, deposit-backed factory demand.
2Qualified Project Pipeline Coverage

Qualified Project Pipeline Coverage ranks second because it is the earliest signal of whether the plant will stay fed two to four quarters out. Target 3.5x-5x of the next 12 months of factory-capacity revenue, counted only at Stage 3 design development or later. Healthcare and data center pods need the 4x-5x end because cycle times stretch and slip rates run 30-40%. Below 3x, plant idle time arrives within two quarters.
This metric serves sales operations leaders who need a forward-looking capacity warning rather than a rearview quota report. It trades away precision: headline coverage flatters the pipeline unless you also run a slip-rate adjusted view monthly. It sits just below Factory Capacity Booked because coverage is intent while booked is contracted, but coverage tells you sooner whether the booked number will hold.
3Project Gross Margin
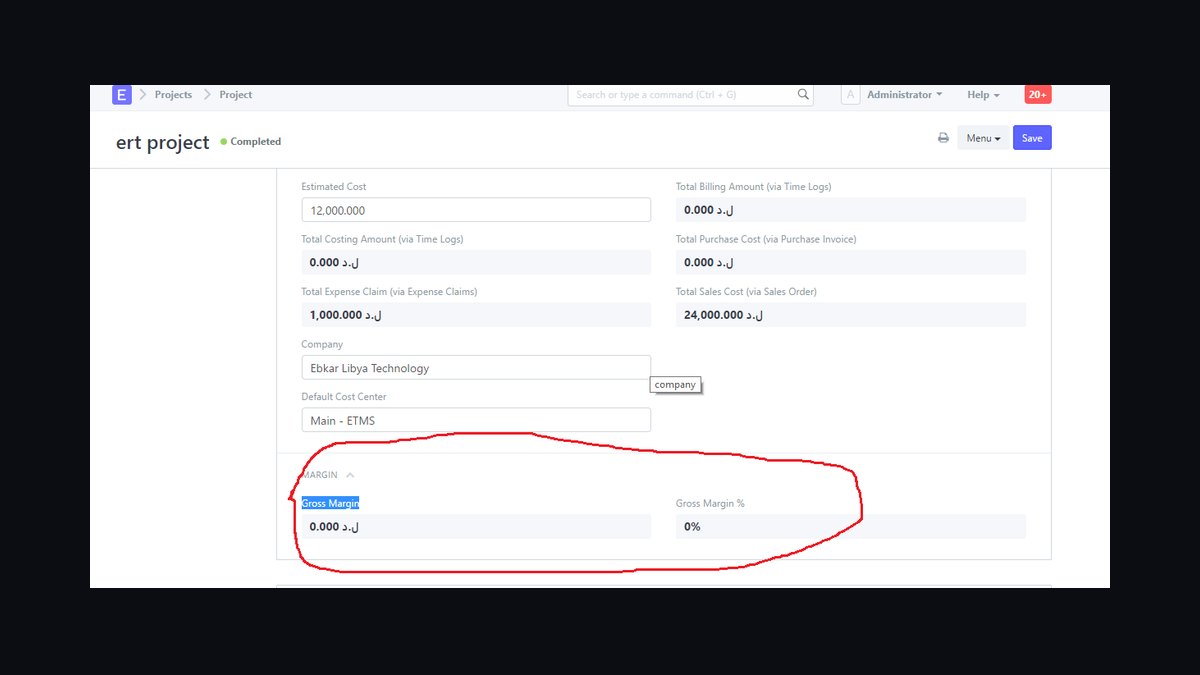
Project Gross Margin ranks third because modular deals can close cleanly and still destroy value in production, transport, and set. Blended target is 14-22%: multifamily volume work 11-16%, healthcare and data center 18-26%, custom single-family modular 22-30%. Factor factory absorption, transportation inside a 90-mile economic haul radius, crane and set costs, and a 1.5-3% warranty reserve. Track margin at award, at 50% production, and at close-out.
This KPI is for CFOs and sales VPs who need to know whether booked revenue actually earns. It trades away simplicity: the award-to-close-out delta is the real execution score, and blended averages hide segment disasters. It ranks below pipeline coverage because margin is a quality check on deals already won, not a predictor of whether the plant stays full.
4Customer-Acceptance Rate at Set
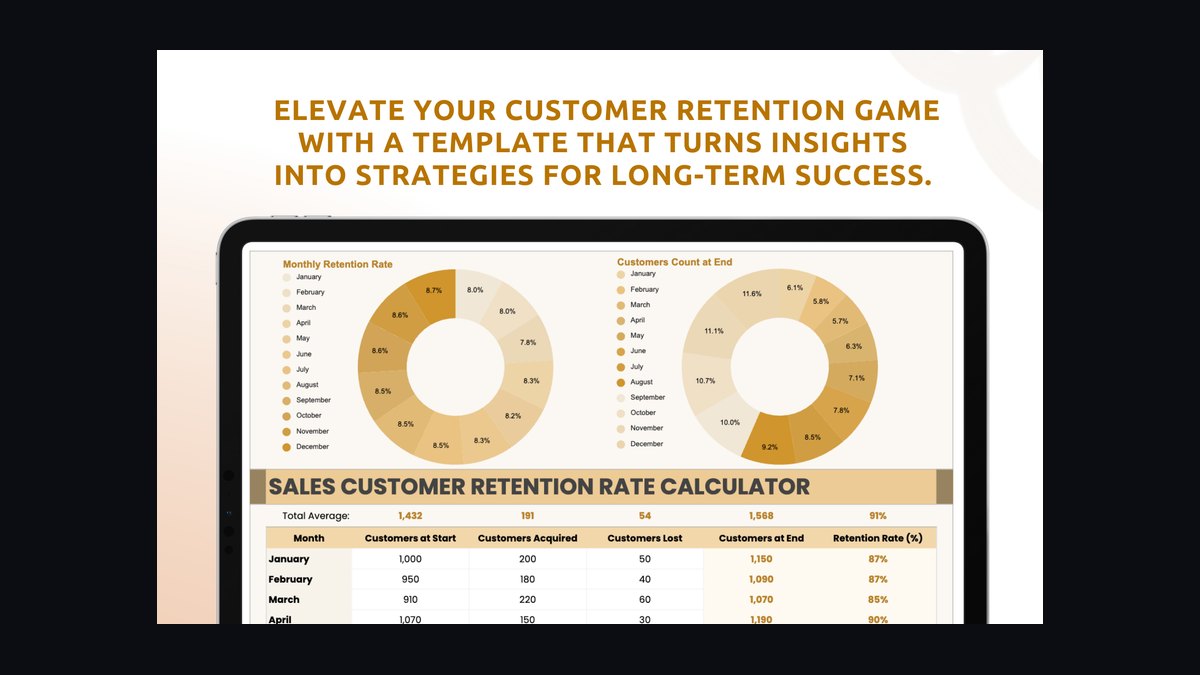
Customer-Acceptance Rate at Set ranks fourth because it is the leading indicator of repeat revenue, warranty accuracy, and word-of-mouth pipeline in a small industry. Target 96-99% of delivered modules accepted by the GC and owner's rep without factory return, on-site rework, or rejection. Below 95% you are bleeding cash on rework crews. Below 92% you have a quality system problem that costs the next three deals.
This metric is for plant managers and sales leaders who understand that a chaotic set day kills the reference. It trades away short-term throughput: pushing line speed to hit bookings often drops acceptance, and the damage shows up two quarters later in repeat share. It ranks above Repeat Revenue Share because acceptance causes repeat business rather than merely measuring it.
5Repeat Reference Revenue Share

Repeat Reference Revenue Share ranks fifth because it is the compounding metric that lowers CAC, shortens cycles, and lifts margin simultaneously. Year-one operators run 5-15% of revenue from prior customers or referrals; mature operators at five-plus years hit 45-65%. Best-in-class healthcare modular shops exceed 70% because the systems are sticky. Track by named account and by introducer, with introduced-by a mandatory CRM field.
This KPI is for sales leaders building a durable book rather than chasing net-new logos every quarter. It trades away fast vanity wins: referral revenue grows slowly and cannot be manufactured by discounting. It ranks below Customer-Acceptance Rate at Set because acceptance is the upstream cause, while repeat share is the downstream result that lags by a full project cycle.
6Win Rate by Segment

Win Rate by Segment ranks sixth because blended win rate hides everything that matters in modular sales. Benchmarks: multifamily affordable 22-35%, multifamily market-rate 15-25%, healthcare 12-20%, K-12 portable 30-45%, data center pod 8-15%, hospitality 18-28%. Measure against weighted pipeline at the Stage 4 proposal gate. Reps below segment median for two consecutive quarters need coaching, reassignment, or removal.
This KPI is for sales managers allocating coaching time and territory, not for board decks. It trades away the comfort of a single headline number: a 25% blended win rate can conceal a 9% healthcare rate subsidized by K-12 portables. It ranks below Repeat Reference Revenue Share because win rate measures conversion efficiency, while repeat share measures whether the market actually wants you back.
7Sales Cycle Length
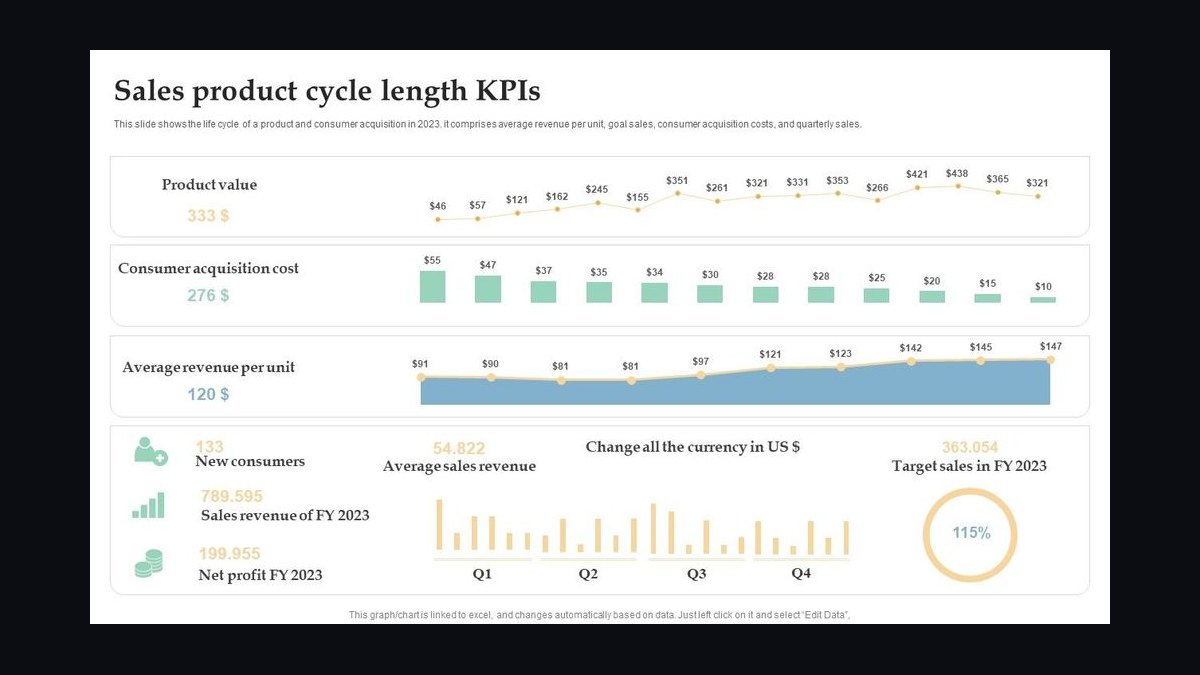
Sales Cycle Length ranks seventh because modular buyers move on their own clocks and reps who misjudge them forecast badly. First-time developer buyers run 9-18 months from first conversation to LOI; repeat developers 4-7 months; healthcare systems 12-24 months because committee approvals stack; K-12 portable 60-120 days because budgets are bounded and procurement-driven. Measure from first qualified meeting, not first MQL, to signed contract.
This KPI is for forecast owners who need to know when revenue actually lands. It trades away urgency: long cycles are not inherently bad if win rates are high, and the real disease is long cycles paired with sub-20% win rates, meaning you educate the market for a competitor. It ranks below Win Rate by Segment because cycle length without conversion context is just a number.
8Average Project ACV

Average Project ACV ranks eighth because segment mix drives it more than rep skill, and the blended figure hides the composition. Healthcare pods and hospital expansions run $25M-$80M; multifamily affordable podiums $12M-$45M; K-12 portable programs $400K-$2.5M per district per year; single-family modular $180K-$450K per home. Track ACV by segment and by repeat-buyer status, never blended alone.
This KPI is for sales leaders setting quota structures and territory design across genuinely different businesses. It trades away comparability: rising blended ACV is good only if it is not one whale project distorting the average. It ranks below Sales Cycle Length because ACV tells you deal size while cycle length tells you when that size converts to revenue.
9Days to Deliver vs Site-Built

Days to Deliver vs Site-Built ranks ninth because schedule compression is the core value proposition owners pay for, and it must be defensible with cohort data. Track delivered schedule compression against the site-built equivalent for the same building type using RSMeans baselines or MBI Permanent Modular Construction Annual Report figures. The operator range is 35-55% compression. Below 30% the value prop weakens; above 60% you are likely using an unrealistic baseline.
This KPI is for sales reps arming proposals and for marketing teams building credible case studies. It trades away easy claims: aggressive compression numbers impress in the pitch and collapse in diligence when buyers check the baseline. It ranks below Average Project ACV because schedule wins deals but ACV determines whether those deals are worth the factory slot.
10Project Pipeline Slip Rate

Project Pipeline Slip Rate ranks tenth because it is the correction factor that keeps every other forecast honest in modular sales. Measure the percentage of Stage 3+ opportunities that push beyond their forecasted close quarter, segmented by buyer type. Healthcare and data center pods typically slip 30-40%; repeat developer deals slip far less. A slip-adjusted pipeline view should run monthly alongside the headline coverage number.
This KPI is for sales operations analysts and forecast owners who have been burned by pipelines that looked healthy until quarter-end. It trades away optimism: slip rate forces reps to defend close dates with milestone evidence rather than hope. It ranks last because it is a modifier applied to the other nine metrics, not a standalone target anyone can chase directly.
How we ranked these
The ranking weighted nine KPIs by their causal link to factory absorption and project margin, drawing on public filings from Skyline Champion and Cavco, plus operator interviews across multifamily, healthcare, and K-12 portable segments. Factory Capacity Booked, Project Gross Margin, and Set Acceptance received the heaviest weight because they directly determine cash conversion and repeat demand. Pipeline coverage, cycle length, and win rate were weighted next, then ACV, schedule compression, and repeat revenue share.
Deliberately ignored: top-of-funnel vanity metrics like MQL volume, raw lead counts, website traffic, and trade-show badge scans, because modular demand is a bounded buyer set where qualification beats volume. Also excluded were blended industry averages, since segment economics diverge too sharply to be useful, and any KPI that cannot be pulled weekly from a Salesforce-Procore-MES stack without manual reconciliation.
What to look for
The decisive factor is whether a KPI ties to factory absorption or project margin, not whether it looks impressive on a board slide. A metric that cannot be reviewed weekly and acted on within one production cycle is decoration. Buyers should also check segment granularity: a dashboard that blends K-12 portable with healthcare pods will hide the exact variance that determines whether a plant stays booked or goes idle.
The mistake most buyers make is adopting a full nine-KPI dashboard before instrumenting data quality. They inherit mis-tagged opportunities, undefined stage gates, and no design-freeze milestone, then blame the metrics when forecasts miss. Start with Factory Capacity Booked and Set Acceptance, fix CRM required fields, and add the remaining seven only once the underlying data survives a monthly audit.
Related questions
What is a healthy Qualified Project Pipeline Coverage ratio for modular construction?
Target 3.5x to 5x of the next twelve months of factory-capacity revenue, measured at design development or later. Below 3x means accepting plant idle time within two quarters. Above 6x usually signals padding or tire-kickers. Healthcare and data center pods should sit at the higher end because slip rates run 30-40%.
How long is a typical modular construction sales cycle?
First-time developer buyers run 9-18 months from first conversation to LOI. Repeat developers close in 4-7 months. Healthcare systems take 12-24 months because committee approvals stack. K-12 portable programs run 60-120 days because budgets are bounded and procurement drives the motion. Measure from first qualified meeting, not first MQL.
What win rate should a modular sales team expect by segment?
Multifamily affordable runs 22-35%, market-rate 15-25%, healthcare 12-20%, K-12 portable 30-45%, data center pods 8-15%, and hospitality 18-28%. Track against weighted pipeline at the proposal gate. Reps below segment median for two consecutive quarters need coaching, reassignment, or removal.
Why is Factory Capacity Booked the most important modular sales KPI?
A modular plant has a fixed line rate, so every unsold week of capacity is lost permanently. Target 75-90% booked on a rolling twelve months and 95%+ for the next six. Booked means contracted with a non-refundable deposit or NTP issued. Soft pipeline does not count. Lines under 60% lose $4M-$8M monthly in absorption.
What gross margin should modular and prefab projects target?
Blended target is 14-22%. Multifamily volume work runs 11-16%, healthcare and data center 18-26%, custom single-family modular 22-30%. Factor factory absorption, transportation within a 90-mile radius, crane and set costs, on-site finishing, and a 1.5-3% warranty reserve. Track margin at award, at 50% production, and at close-out.
What is Customer-Acceptance Rate at Set and why does it matter?
It measures the percentage of modules accepted by the GC and owner's rep without factory return, on-site rework, or rejection. Target 96-99%. Below 95% bleeds cash on rework crews. Below 92% signals a quality system problem that costs the next three deals through word-of-mouth. Clean sets produce repeat buyers; chaotic sets do not.
How much schedule compression does modular construction actually deliver?
Operators deliver 35-55% compression versus site-built equivalents for the same building type, using a comparable-cohort methodology like RSMeans baselines or the MBI Permanent Modular Construction report. Below 30% weakens the value proposition. Above 60% usually means an unrealistic site-built baseline, and buyers will catch that, damaging credibility.
What share of modular revenue should come from repeat customers?
Year-one operators run 5-15%. Mature operators with five-plus years in a segment hit 45-65%. Best-in-class healthcare modular shops exceed 70% because systems are sticky. Every point of repeat share lowers customer acquisition cost, shortens cycle length, and lifts margin. Instrument the CRM so introduced-by is a mandatory field.
FAQ
Should single-family and multifamily modular use the same KPIs?
The nine KPIs apply to both, but benchmark ranges do not. Single-family modular runs higher gross margin at 22-30%, shorter cycles of 4-9 months, lower ACV at $180K-$450K, and a different repeat pattern where architect-led firms drive most repeats. Use one dashboard, segment the benchmarks, and report separately. Blending produces averages matching no real business.
How do you measure pipeline when revenue concentrates in a few whale projects?
Use two layers. Whale segments like data center pods and large healthcare expansions get deal-level forecasts with individual probability, slip-rate, and milestone tracking. Run-rate segments like multifamily volume and K-12 portable get traditional stage-weighted pipeline math. Reporting both keeps forecasts honest. Headline pipeline coverage alone on whales creates false confidence.
What CRM and toolchain works for modular sales?
Salesforce Sales Cloud handles opportunity management and required-field gating by segment. Procore covers project execution, set-day quality, and change orders. The factory MES supplies line rate and takt time. Sync the three so reps see capacity before promising cycle time. A lightweight BI layer on top beats waiting for a perfect data warehouse.
Why do modular deals die at the financing stage?
Banks underwrite modular with extra scrutiny because the asset does not exist on-site until set day. Lenders want milestone payments tied to factory progress, performance bonds, and sometimes a UCC-1 on modules in transit. Reps who cannot speak to a lender call end up with LOIs that never convert. Qualify the lender explicitly at Stage 2.
What is a Design Freeze Milestone and why does it matter?
It is a contractual date after which design changes trigger economically painful change-order rates. Site-built projects absorb late changes; modular cannot, because modules are already in production. Healthy operators run change-order revenue at 1.5-4% of contract value. Sick ones run 8-15% and lose all of it plus schedule penalties.
How should sales comp plans be structured for modular?
Include a capacity gate so no commission acceleration applies to deals booked into already-saturated months. Add a change-order penalty tied to post-freeze modifications. Add a repeat-revenue accelerator rewarding expansion within named accounts. Get finance and the CEO in the room. Comp plans that reward raw bookings regardless of factory load reliably produce overselling and quality collapse.
What does a 30/60/90 day plan look like for a new modular sales leader?
Days 0-30 instrument: audit CRM, map opportunities to segments, walk the plant floor, build true win-rate tables. Days 31-60 realign: rewrite comp against the nine KPIs, publish design-freeze policy, re-segment account ownership, run joint factory tours with GCs. Days 61-90 compound: lock rolling-12 booked target, launch reference program, build slip-rate model.
How often should modular sales KPIs be reviewed?
Daily for set-day acceptance and line rate versus plan. Weekly for pipeline coverage by segment, Factory Capacity Booked, and stage conversion math. Monthly for gross margin by cohort, win rate trended six quarters, and schedule compression. Quarterly for repeat revenue share, ACV by segment, and cycle-length distribution. Cadence matters as much as metric selection.
What is the biggest failure mode in modular sales organizations?
Selling to developers without converting their general contractor. The rep wins the developer, then the GC's preconstruction lead shows modular at parity or premium with labor margin baked in. The developer wavers, the deal slips a quarter, then dies. Symptom: rising proposal-stage pipeline with declining negotiation conversion. Bring the GC in at Stage 2.
How do you avoid outrunning factory capacity?
Hard-cap the Factory Capacity Booked KPI with CEO-level escalation whenever the rolling-12 metric crosses 95%. Sales comp should include a quality gate so no commission acceleration applies to saturated months. Overselling a $180M plant to $220M drives overtime, drops set acceptance below 92%, triggers public complaints, and collapses pipeline roughly eighteen months later.
Sources
- https://www.sec.gov/cgi-bin/browse-edgar?action=getcompany&CIK=SKY&type=10-K
- https://www.sec.gov/cgi-bin/browse-edgar?action=getcompany&CIK=CVCO&type=10-K
- https://www.mbionline.org/
- https://www.rsmeans.com/
- https://www.procore.com/
- https://www.salesforce.com/
- https://www.nahb.org/
- https://www.constructiondive.com/
Related on PULSE
This page will be disappearing soon. Save it to your device for $1 — or read it free while it is here.
@Kory-White- · if Venmo asks, the last 4 of my number are 2012
This page is gone.
This one is off the shelf now. $1 keeps it on your phone for good — the whole page, pictures and diagrams included.
 pulse-industry-kpisTop 10 Sales KPIs for Commercial Insurance Brokerage in 2027
 pulse-industry-kpisTop 10 Sales KPIs for Industrial Welding Equipment & Gas Distribution in 2027
 pulse-industry-kpisTop 10 Sales KPIs for Online Travel Agency (OTA) in 2027
 pulse-industry-kpisTop 10 Sales KPIs for Home Builder in 2027
 pulse-industry-kpisTop 10 Sales KPIs for Enterprise Software License Agreement (ELA) Renewals in 2027
 pulse-industry-kpisTop 10 Sales KPIs for Commercial Marketing Agency in 2027
 pulse-industry-kpisTop 10 Sales KPIs for Contract Research Organization (CRO) in 2027
 pulse-industry-kpisTop 10 KPIs for Pressure Washing Companies in 2027
 pulse-industry-kpisTop 10 Sales KPIs for AI Sales Coaching / Conversation Intelligence in 2027
 pulse-industry-kpisTop 10 Sales KPIs for Industrial Laser Cutting & Waterjet Job Shops in 2027