


Top 10 Sales KPIs for Sports Field Lighting Installation in 2027
Quality
Certified

The key sales KPIs for the Sports Field Lighting Installation industry in 2027 are qualified pipeline coverage, bid win rate, average project value, sales-cycle length, LED retrofit conversion rate, service and controls attach rate, energy-savings sell-through, and referral revenue. Together they track a budget-driven, project-based, seasonally constrained capital-sales motion.
What these KPIs are and why they matter
Sports field lighting is bought by institutions on budgets: school districts, municipalities, universities, and parks departments. Purchases tie to capital-budget cycles, bond measures, board approvals, and grant funding, which means demand is forecastable if the sales team tracks those cycles and invisible if it does not. The work is project-based and competitively bid — engineered, proposed, and frequently awarded through a formal procurement process. Each bid carries real engineering and photometric-design cost, so win rate and bid selectivity directly affect profitability. Because of this structure, the KPIs that matter are not generic SaaS metrics; they measure pipeline that maps to funding availability, bid economics on expensive proposals, and the conversion of one-time installs into recurring service relationships.
The revenue stream in this industry is uniquely lumpy. Unlike subscription businesses, a single large project — lighting a new 10,000-seat high school stadium — can represent 40% of a smaller contractor's annual revenue. Missing one key bid can crater a quarter; winning an unexpected project can create a capacity crunch. That is why each KPI below exists to answer a specific management question. Qualified pipeline coverage asks whether enough budget-backed work is in flight ahead of need. Bid win rate asks whether the team is bidding the right projects and pricing them correctly. Average project value asks whether the firm is winning substantive work or nickel-and-dime jobs. Sales-cycle length calibrates forecasting against slow institutional buying. LED retrofit conversion rate, service and controls attach rate, and energy-savings sell-through measure the ability to sell total cost of ownership and turn installs into annuities. Referral and repeat-institution revenue measures reputation and delivery quality. Each is a distinct metric, and a firm that manages all nine sees the whole picture — pipeline health, bid discipline, mix, cycle timing, retrofit momentum, recurring attach, financial-argument strength, and organic growth.

A strong Sports lighting sales operation also treats seasonality as a first-class variable. In northern climates, construction windows compress into roughly May through October, so a contract signed in November may not generate installation revenue until the following spring. That lag between contract close and revenue recognition forces firms to separate "time to contract" from "time to first revenue" and to build milestone-based billing into every forecast. Layer on regulatory tailwinds — state energy codes mandating LED adoption in new public construction, and utility rebate programs that subsidize roughly 15% to 30% of a retrofit's cost — and the Installation business becomes a game of weaving financial incentives into proposals rather than competing on price alone.
The step-by-step process for tracking pipeline through a budget-driven cycle
Building these KPIs into a working sales operation follows a repeatable sequence. Start by qualifying every opportunity against a funding stage, not just interest. Tag each deal as "No Budget Identified," "Budget Requested," "Budget Approved," or "Grant Awarded," and record the specific budget-cycle dates — bond election, capital-request deadline, board-approval meeting — so the pipeline maps to when money actually becomes available. A contractor targeting $5 million in annual revenue needs a qualified pipeline of at least $15 million, because only 25% to 35% of qualified opportunities convert, and that coverage must be timed to budget seasons rather than to whenever an RFP happens to drop.
Next, run a disciplined bid/no-bid decision on every qualified opportunity. Preparing a single bid — site visit, photometric modeling, energy-savings calculation, proposal document — costs $1,500 for a simple single-field retrofit and can exceed $10,000 for a multi-field stadium complex. Score each pursuit on budget certainty, relationship strength, competitive landscape, and project complexity; advance the high scorers to proposal and deliberately no-bid the rest to protect engineering capacity. Once a proposal is submitted, track its aging: a bid outstanding for 60 days without a decision should trigger a follow-up strategy or a withdrawal. Deals sitting in "Budget Requested" for more than 90 days should trigger a facilities-director call. The diagram below shows how a single opportunity moves through the funding-gated stages that these KPIs measure.
Finally, close the loop after award. Record whether controls and a service agreement were attached, capture the documented reason for the win in a win-loss field, and tag the source — new cold bid, repeat institution, new department, or named referral — so the attach, energy-savings sell-through, and referral KPIs become reportable rather than anecdotal. This is the operational spine that turns raw CRM data into the nine metrics that run the business.
Costs, timelines, and typical ranges for each metric

Concrete benchmarks make these KPIs actionable. Qualified pipeline coverage should run roughly 3x against target given long cycles and competitive loss rates, with the best teams weighting each deal by funding stage rather than counting raw dollars. Bid win rate in the top quartile reaches 35% to 50%, achieved through selectivity rather than volume; public school and municipal bids typically land at 20% to 35% because they are awarded on lowest qualified price, while private clubs and collegiate design-build projects reach 40% to 55% when relationships drive the award.
Average project value spans a wide band. Small municipal park upgrades average $30,000 to $60,000; large institutional projects average $200,000 to $500,000, and full stadiums can exceed $500,000. The median project sits between $150,000 and $300,000, and a healthy mix targets at least 40% of revenue from projects over $150,000 so the firm is not over-reliant on low-margin work. Sales-cycle length varies dramatically by buyer: a private golf club may sign in 3 to 4 months, while a public school district retrofit runs 12 to 18 months through a facilities assessment, a capital request filed six months ahead of the fiscal year, board approval, a 60-to-90-day RFP, and a ratification vote. Municipal projects fall around 9 to 15 months and universities around 6 to 12. Installation then adds another 2 to 6 months before the first revenue milestone.
LED retrofit conversion rate among active prospects runs 15% to 30% per year, climbing to 35% to 45% in states like California, New York, and Massachusetts with stricter energy codes and generous rebates. A clean one-page case — a $12,000 annual electricity reduction, a four-year payback, a 30% utility rebate, and a signed energy-cost validation — pushes conversion to 30% to 40%, while vague "energy savings" claims drop it below 15%. Service and controls attach carries hard price tags: a basic controls package (smartphone scheduler, dimming, photocell) adds $8,000 to $15,000; advanced packages with remote monitoring and fault detection add $15,000 to $30,000; annual maintenance contracts run 5% to 10% of installed value, or roughly $1,200 to $4,800 per field. Firms hitting a 70%-plus controls attach and 60%-plus service attach report 25% to 40% higher customer lifetime value.

Energy-savings sell-through — the share of retrofit wins where documented payback was the primary reason for the decision — should sit at 60% to 80% for top firms; below 40% signals weak total-cost-of-ownership modeling. Referral and repeat-institution revenue reaches 35% to 55% of annual revenue for mature contractors and 10% to 25% for newer firms, and it is 5 to 10 times cheaper to win than a cold competitive bid. Sales velocity ties several of these together: multiply average deal value by win rate, divide by average cycle length in days, and 2027 benchmarks land around $2,500 to $4,500 per sales day. Trade-show leads (for example, from the NRPA conference) may run $3,200 per sales day at a five-month cycle and 35% win rate, while cold email to facilities directors runs closer to $1,100 per day at an eleven-month cycle and 18% win rate — data that justifies concentrating effort on high-velocity sources.
Customer lifetime value deserves its own range because it reframes what the industry is selling. A single institutional client — a district with five fields — might generate $120,000 on an initial two-field retrofit, $10,800 across a three-year service contract, $25,000 for a controls upgrade, $110,000 on a phase-two retrofit, more service revenue, and a $90,000 referral, totaling roughly $366,600 over seven years against a first-project value of $120,000. A strong CLV in this sector runs $45,000 to $120,000 per account versus a one-time field value of $25,000 to $75,000, and firms that optimize it see 20% to 35% higher margins on their installed base within three years.
Where teams get these KPIs wrong
The most common failure is confusing pipeline quantity with pipeline quality. A firm can report 5x coverage that is actually a graveyard of stalled, no-budget projects. The fix is weighted coverage — assigning each deal a probability based on funding stage and relationship strength, then dividing the weighted total by the revenue target — so the number reflects deals that can actually close. A related mistake is treating win rate as a single figure. Blending a 20% public-bid win rate with a 55% private-relationship rate hides the truth; segmenting win rate by customer type reveals whether the engineering investment in each bid class is justified and whether the firm should keep chasing lowest-price public work at all.
The "nickel-and-dime" trap is pervasive. Teams chase high volumes of small $30,000 to $60,000 park upgrades because they are easy to win and close fast, but each consumes nearly the same overhead — site visit, photometric design, permits, project management — as a project five times larger. Twenty small jobs at $50,000 can produce lower net margin than five stadium projects at $200,000 because of the disproportionate cost of managing twenty separate installations. This is why average project value must be read alongside a project-size-distribution metric, not in isolation. Firms also mis-track sales-cycle length by measuring only to contract signature; because seasonal windows and installation add 2 to 6 months, the meaningful figure for cash flow is time to first revenue.

Energy-savings sell-through is frequently gamed. Sales reps mark it as achieved because savings were "mentioned" in the deck, when the KPI only counts if the documented win-loss field shows payback was the primary reason for the decision. A district that chose the lowest upfront price does not count even if savings appeared in the proposal. When this rate slips below 50%, the honest response is refresher training on total-cost-of-ownership modeling — maintenance labor savings, reduced downtime, better light quality — not relabeling losses. Finally, many teams never systematically tag deal source, so the referral KPI is guessed rather than measured; without a "source" field distinguishing cold bid, same-institution repeat, new-department repeat, and named referral, the cheapest revenue channel in the business stays invisible and underinvested. Each of these errors is a measurement error first and a strategy error second — the metric misleads, so the decision follows it off a cliff.
Decision framework: when to prioritize which metric
No firm optimizes all nine KPIs at once, so the practical question is which metric leads given the firm's stage and project mix. Segment the proposal-to-close ratio by project type first, because that reveals where the sales process is strongest and where it leaks. A top-quartile firm might close 55% to 70% of new-construction proposals but only 30% to 45% of municipal park upgrades, or close partial retrofits at 55% to 70% on a three-to-five-month cycle while stadium new-builds close at 25% with a fourteen-month cycle. Overlay average proposal value and cycle length on each segment, and the resource-allocation answer becomes obvious: pour sales time into high-close-rate, short-cycle segments, and either hire a specialist or decline the low-close-rate, long-cycle ones. The industry's blended sweet spot is a 45% to 60% proposal-to-close ratio, with at least 50% targeted on retrofits over $50,000.
Stage of the business dictates emphasis too. A newer contractor should lead with bid win rate and average project value to build a profitable base, while targeting a modest 15% to 25% referral share and obsessing over clean project handoffs to seed future organic growth. An established firm with a strong delivery reputation should shift its attention to attach rate, energy-savings sell-through, and CLV, because the marginal dollar is cheaper to earn from an existing relationship than from a new cold bid. Regional energy economics is the tiebreaker on retrofit strategy: where electricity runs $0.15 to $0.30 per kWh, payback compresses to two to four years and energy savings should be the primary close; where it runs $0.08 to $0.12 per kWh, payback stretches to five to seven years and the team must lead with light quality, controllability, and maintenance savings instead. The framework below maps close rate and cycle length to the resourcing decision.
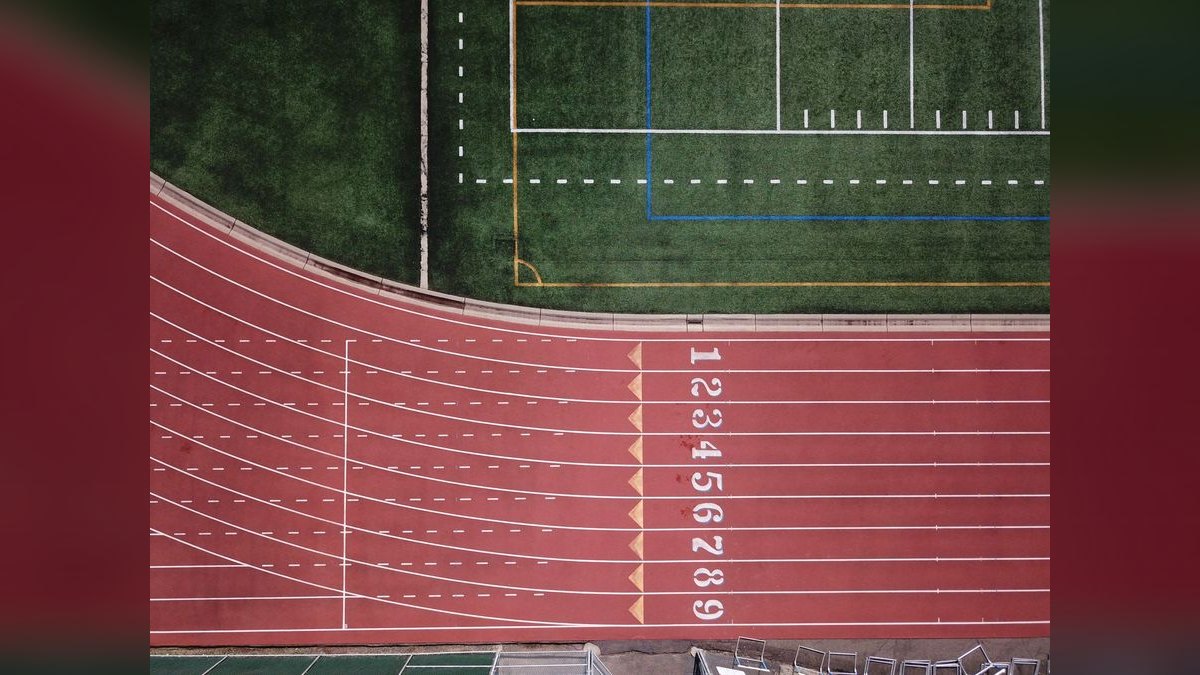
Used together, these decision rules keep the sales team pointed at the highest-return work while the nine KPIs supply the evidence. The framework is not static; leading firms review the segmented analysis monthly and reallocate their scarcest resource — engineering and selling time — toward whichever project type and funding source currently delivers the best velocity.
Related questions
How do bond measures and school board approval timelines affect forecasting?
Bond measures create predictable funding windows that compress cycles by guaranteeing budget availability, but they add dependency on voter approval. Track bond election dates and align proposals to post-approval procurement, forecasting a three-to-six-month lag between bond passage and contract award so pipeline timing matches when money is actually released.
What is the optimal ratio of retrofit to new-construction proposals?
A balanced pipeline is roughly 60% to 70% retrofit proposals — faster cycle, higher close rate — and 30% to 40% new construction, which carries higher value and longer cycles. This mix delivers steady cash flow from retrofits while still pursuing the larger revenue opportunities that new stadium and multi-field builds provide.
How can energy rebate programs shorten sales cycles?
Rebate programs give third-party validation of the financial case and cut upfront cost by 15% to 30%, which accelerates budget approval. Pre-qualify prospects for available rebates and fold the rebate application into the proposal timeline; done well, this can shorten the decision cycle by two to three months on municipal projects.
What sales compensation structure works best for project-based teams?
Combine a base salary with commission on gross margin, plus bonuses for hitting controls and service attach-rate targets. This rewards deal value and post-installation recurring revenue simultaneously, aligning rep behavior with long-term profitability rather than with chasing low-margin volume that inflates top-line revenue without protecting margin.
How do regional energy costs change the retrofit financial case?
Higher regional rates of $0.15 to $0.30 per kWh shorten payback from five-to-seven years down to two-to-four, making the financial argument far stronger. Teams in high-cost regions should lead with energy savings; those in low-cost regions of $0.08 to $0.12 must emphasize light quality, controllability, and maintenance savings instead.
FAQ

What is a healthy qualified pipeline coverage ratio in 2027? A ratio of 3:1 to 5:1 of pipeline value to sales target is typical, but quality outranks the raw number. A 3:1 pipeline of budget-approved, high-fit opportunities beats a 5:1 pipeline of early-stage leads with no funding. Leading firms weight each deal by funding stage and relationship strength, then divide the weighted total by target for a truer read.
How does bid win rate differ for public versus private projects? Public school and municipal bids typically win at 20% to 35% because they are awarded on lowest qualified price, compressing margins. Private clubs and collegiate design-build work reaches 40% to 55% when relationships and design expertise drive the award. The practical response is a bid/no-bid scorecard for public work and heavy relationship investment for private pursuits.
What is the typical average project value range? Projects run from roughly $50,000 for small municipal fields to over $500,000 for stadiums and multi-field complexes, with a median between $150,000 and $300,000 depending on field size, lighting class, and controls complexity. The 2027 trend pushes average value up 15% to 25% year over year as buyers demand integrated controls, remote monitoring, and broadcast-quality light.
How long is the average sales-cycle length? Most cycles run 6 to 18 months from inquiry to signature. School districts take longest because of budget-approval calendars, while private facilities can close in 3 to 6 months with pre-approved financing. Remember that the cycle effectively extends through a 2-to-6-month installation, so track time to first revenue separately from time to contract close.
How much revenue can service and controls attach add? Attaching maintenance, remote monitoring, or smart controls adds roughly 10% to 25% to initial project value. On a $200,000 install, a 20% controls attach adds $40,000, and a five-year service contract at $8,000 per year adds another $40,000 — growing total revenue to $280,000. Firms above 70% controls and 60% service attach see CLV exceed three times the initial project value.
How do I calculate customer acquisition cost for a project? Divide total sales and marketing spend — salaries, travel, photometric design, proposal prep — by closed-won projects in the period. A healthy CAC is 8% to 15% of average project value, but segment it: a $500,000 stadium may cost $50,000 to win (10%), while a $50,000 park retrofit costs $3,000 (6%). Tracking CAC by project type shows which segments are most cost-effective to pursue.
Sources
- Sports & Fitness Industry Association — market reports and participation data relevant to sports facility construction and lighting demand.
- U.S. Department of Energy — LED efficiency guidance, energy codes, and total-cost-of-ownership framing for lighting retrofits.
- ENERGY STAR — efficiency standards and utility rebate program background for commercial and municipal lighting.
- Illuminating Engineering Society — photometric design standards and recommended practice for sports and recreational field lighting.
- National Recreation and Park Association — municipal parks capital-planning and facility-development context.
- U.S. Census Bureau Construction Spending — public construction and institutional capital-spending trends.
- Database of State Incentives for Renewables & Efficiency (DSIRE) — state-by-state energy incentive and rebate program data.
- ASHRAE — building energy standards and efficiency codes affecting new public construction.
Related on PULSE
- What are the key sales KPIs for the Athletic Field & Sports Turf Construction industry in 2027?
- What are the key sales KPIs for the Architectural Terrazzo Flooring Installation industry in 2027?
- What are the key sales KPIs for the Geothermal Heating & Cooling Installation industry in 2027?
- What are the key sales KPIs for the Stage Lighting & Production Equipment Rental industry in 2027?
- What are the key sales KPIs for the Commercial EV Charging Infrastructure Installation industry in 2027?
- What are the key sales KPIs for the Architectural Lighting Design & Specification industry in 2027?
This page will be disappearing soon. Save it to your device for $1 — or read it free while it is here.
@Kory-White- · if Venmo asks, the last 4 of my number are 2012
This page is gone.
This one is off the shelf now. $1 keeps it on your phone for good — the whole page, pictures and diagrams included.
 pulse-industry-kpisTop 10 Sales KPIs for Commercial Janitorial and Cleaning Services in 2027
 pulse-industry-kpisTop 10 Sales KPIs for Industrial Welding Equipment & Gas Distribution in 2027
 pulse-industry-kpisTop 10 Sales KPIs for Commercial HVAC Distribution in 2027
 pulse-industry-kpisTop 10 Sales KPIs for Commercial Greenhouse Produce Marketing & Brokerage in 2027
 pulse-industry-kpisTop 10 KPIs for Roofing Contractors in 2027
 pulse-industry-kpisTop 10 Sales KPIs for Clinical Trial Site Network in 2027
 pulse-industry-kpisTop 10 Sales KPIs for Industrial Robotics OEM in 2027
 pulse-industry-kpisTop 10 Sales KPIs for Commercial Industrial Coatings in 2027
 pulse-industry-kpisTop 10 Sales KPIs for Commercial Tree Care & Arboriculture in 2027
 pulse-industry-kpisTop 10 KPIs for Barbershops in 2027