


Top 10 Sales KPIs for Commercial Elevator Modernization Contracting in 2027
Quality
Certified

The key sales KPIs for Commercial Elevator Modernization Contracting in 2027 are booking velocity, service-contract attach rate on closed modernizations, service ARPU per elevator, first-time-fix rate, modernization gross margin, sales cycle length, top-account retention, independent take-back rate, and days sales outstanding. Together they reveal whether you convert turnover, lock the service annuity, and collect cash.
The outcome you should expect
Run this KPI stack with discipline and the business behaves like an annuity wearing a capital-expense costume. The visible transaction is a $25K–$650K-per-car modernization, but the durable value is the multi-year service contract that ships behind it at $1,800–$8,500 per elevator per year at 38–55% gross margin. When your metrics are healthy, roughly 80–95% of every closed modernization carries an attached service contract signed at handover, and that annuity compounds across a 25–35 year equipment life.
The single number that predicts whether a Commercial Elevator Modernization shop thrives is service-contract attach rate on closed jobs. A modernization sold without service attached is a one-time payment that funds a competitor's 25-year revenue stream — the building owner will price-shop maintenance around day 90 once the warranty softens. So the outcome you should expect from disciplined measurement is not "more bookings," it is more bookings that convert into retained, escalating service revenue with cash landing inside 75 days.
Expect the metrics to move in a specific sequence. Booking velocity and attach rate are leading indicators that surface first; ARPU growth and top-account retention are lagging indicators that confirm the annuity is real 12–24 months later; DSO and gross-margin variance are the control metrics that decide whether the whole thing is actually profitable. A Contracting shop that books aggressively but ignores DSO can be growing and insolvent at the same time — a $25M-revenue business sitting at 85-day DSO is carrying roughly $5.8M in receivables, a working-capital drag that quietly eats the margin on dozens of cars. The correct expectation is balance: velocity feeding attach, attach feeding retention, and cash discipline protecting all of it. A shop that treats these nine numbers as a single system, rather than a scorecard the sales team stares at once a quarter, is the one that turns Elevator turnover into compounding profit.

What drives that outcome
Four structural mechanics drive every metric on this page, and understanding them tells you which lever to pull when a number slips.
The modernization is a Trojan horse for the service annuity. The headline $50K–$250K traction job or $25K–$85K hydraulic job is the entry ticket, not the prize. The prize is the 5–10 year service contract on the new controller — locked in by proprietary diagnostics, parts catalogs, and ASME A17.1 documentation the installing contractor controls. Otis ONE, KONE 24/7 Connected Services, Schindler Ahead, and TK Elevator MAX function as switching-cost moats, not IoT toys. That is why attach rate is the metric that governs lifetime value: whoever installs the controller usually owns the service revenue for the next two decades.
The Big-4-versus-independent take-back game is structural. Otis, KONE, Schindler, and TK Elevator hold roughly 60–72% of the US installed base, but independents recapture 8–15% of that base every year as owners revolt against OEM service pricing that runs 2–3x independent rates. Modernization is the wedge: swap the OEM controller for a non-proprietary platform (Motion Control Engineering, GAL, Smartrise) and the OEM is permanently locked out of that car's service revenue. Take-back rate is therefore a growth metric, not a vanity metric — it is the only durable way an independent grows against entrenched controller lock-in.
Code and ESG mandates create non-discretionary demand windows. ASME A17.1 revisions, ADA upgrades on pre-1990 buildings, NYC Local Law 126, and IRA Section 179D energy credits create a calendar of forced modernization windows. Regenerative drives attach on 35–65% of jobs because the 30–50% elevator energy savings qualify for 179D deductions. These aren't features — they are billable line items that lift modernization ASP 15–25% per car and shorten the sales cycle whenever a compliance deadline is real and dated.
The cash-conversion cycle punishes the unprepared. Milestone billing tied to engineering approval, equipment delivery, install phases, and inspector sign-off means cash lands in stages over 12–26 weeks per car. REITs and hospital networks drag accounts payable to 75–90 days as standard practice, which is exactly why DSO is a weekly metric, not a quarterly one.
Benchmarks and realistic ranges

Each metric has an industry-anchored range you can hold reps and routes against.
Modernization booking velocity. Signed contracts in dollars and car count per rep per quarter. Top-quartile Big-4 reps book $4–8M ARR per territory per year (modernization plus attached service); top independent reps run $2–5M with higher modernization concentration. Multi-car portfolio deals (REIT, hospital network, university, transit authority) carry $5M–$50M lifetime value and warrant a dedicated National Accounts team. A rep pacing under $3M ARR for two straight quarters is undertrained or misterritoried.
Service attach rate on closed modernizations. Big-4 OEMs run 85–95% because controller diagnostics are proprietary and owners have no realistic third-party option for 18–24 months post-install. Independents on non-proprietary controllers run 60–75% — lower, but with a higher long-term take-back floor. Below 70% on any Contracting shop is the danger zone: every un-attached job is a future customer of someone else's service truck.
Service ARPU per elevator. $1,800–$3,500 for basic maintenance, $3,500–$5,500 for full-coverage (parts, labor, emergency), $5,500–$8,500 for IoT-connected predictive tiers. Big-4 ARPU runs 30–50% higher than independents on equivalent equipment. Healthy shops grow ARPU 4–8% per year through contractual escalators, IoT upsell, and full-coverage conversion.
First-time-fix rate. Percentage of service calls resolved on the first visit with no callback inside 30 days. Benchmark is 80–92%. IoT-equipped Big-4 routes hit 88–92% because faults are pre-diagnosed and the tech arrives with the correct part; independents without IoT run 80–86%. Below 80% the cost-to-serve doubles; the biggest lever is "right part on first truck" percentage, not tech skill.
Modernization gross margin. 22–35% after equipment, IUEC labor ($85K–$135K loaded), permits, engineering, and inspection — lower than service's 38–55%, higher than new-install's 12–22%. Variance drivers are IUEC escalators (3–5% annual), controller lead times (16–26 weeks for Big-4, 8–14 for commodity components), and change orders.
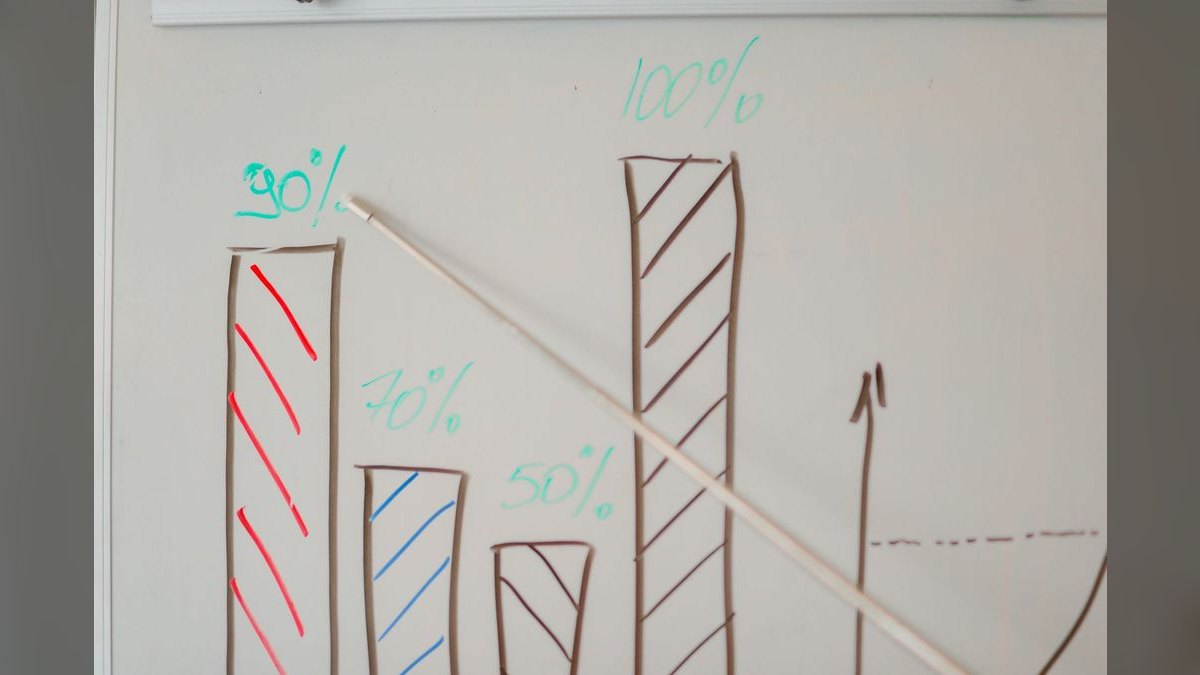
Sales cycle length. Commercial single-car runs 4–12 months; multi-car portfolios run 12–24 months, gated by capital-budget cycles. Referral and existing-account jobs close 30–50% faster than cold or RFP-driven deals. This metric is best tracked by lead source so you can see which channel actually compounds.
Top-100 account retention. 90–96% on Big-4 (controller lock-in), 82–90% on independents. The top 100 accounts generate 55–75% of service revenue, and one top-10 REIT or hospital network can hold 200–800 cars, so losing one is a 3–8% revenue hit that takes 18–36 months to replace.
Independent take-back rate. 8–15% annually on a properly built renewal-cliff pipeline; top performers hit 12–18% in targeted metros using a 25–40% service price differential plus owner-choice messaging. Below 8% means the team is fishing in new construction instead of mature OEM portfolios.
Days sales outstanding. Commercial B2B benchmark is 60–90 days; target a blended 65–75. Hold slow-pay REITs and hospital systems with milestone billing tied to inspection sign-offs, retainage release at substantial completion, and 1–2% net-15 ACH incentives.
Risks, edge cases, and failure modes
Selling modernization without attaching service. The most expensive mistake in the industry. A job closed without a co-executed service contract is a one-time transaction that funds a rival's 25-year annuity. Attach below 70% signals a process gap — either the rep can't package service into the quote, or the contract isn't signed at the same table. Fix by mandating service co-execution at modernization signing, with no "we'll figure out service later" handshakes.
Ignoring DSO until quarter-close. At 85-day DSO on $25M revenue and an 8% cost of capital, roughly $464K a year in interest expense wipes out the gross margin on about 50 cars. Slow-pay customers train your billing team to be patient, and working-capital draws compound silently. Move DSO to a weekly close, segment AR by customer type, and tie the controller's bonus to blended DSO under 75 days.
Letting first-time-fix slip below 80%. Each point below 80% costs 2–3 points of service gross margin through doubled truck rolls and confidence erosion that drives churn. The root cause is almost always parts-on-truck completeness or route density, not tech skill — a journeyman with the wrong relay in a central warehouse still fails the call. Track "right part on first truck," escalate below 85%, and re-density routes to 80–150 elevators per metro tech.

Missing the OEM renewal cliff. Independents who don't track the 5-year contract renewal date for every Big-4 account in their metro forfeit the entire take-back opportunity. The edge case that wins: build a renewal-cliff database from building permits, ASME inspection records, and public REIT/hospital/university capital filings, then run a 90-day pre-renewal campaign that converts 15–25% of engaged accounts.
Under-quoting IUEC labor on long-dated projects. IUEC wages escalate 3–5% annually, with benefits pushing total loaded cost up 5–7%. A job quoted today but installed 150 days out can close 4+ points under quoted margin if you didn't build in a labor-escalator clause. Any modernization closing more than 4 points below quote should trigger a post-mortem on labor estimation and change-order control — otherwise a healthy-looking bookings number hides a bleeding P&L.
A practical rollout plan
Days 1–30 — instrument the truth. Stand up the nine-metric dashboard on real numbers, not budgeted ones. Pull booking velocity by rep for the trailing eight quarters, attach rate on every job closed in 24 months (by rep, controller platform, customer type), first-time-fix by tech and route for 12 months, AR aging segmented by customer type, and top-100 scorecards with revenue, car count, renewal date, and complaint history. Force-rank the bottom 10% on each metric with the sales, service, operations, and finance leads. Change no policy yet — the goal is a single shared reality.
Days 31–60 — fix attach and the renewal cliff. Require service co-execution at modernization signing: write the policy, train reps in one 90-minute session, build a co-sign template into the CRM, and audit every job closed in the window. Attach should move to 80%+ inside 60 days. In parallel, build the OEM renewal-cliff prospect database for your top three metros and assign a dedicated take-back rep armed with the price differential and owner-choice pitch.
Days 61–90 — lock cash and routes. Move DSO to a weekly close, re-segment AR, and assign a senior analyst to each top-10 slow-pay account. Re-milestone active projects into 4–6 billing stages tied to inspection sign-offs, and negotiate net-15 ACH incentives with the top 25 customers. On operations, re-density routes, audit parts-on-truck completeness, and push first-time-fix to 85%+. Exit day 90 with attach at 80%+, take-back pipeline funded, DSO under 80 days, and first-time-fix at 85%+.
Related questions

How many KPIs should a modernization shop actually track weekly?
Focus the weekly cadence on the leading and control metrics: booking velocity, attach rate on that week's closed jobs, first-time-fix by route, AR aging by customer type, and take-back pipeline against the renewal-cliff calendar. Reserve ARPU, gross-margin variance, and retention scorecards for the monthly review.
Is attach rate or booking velocity the more important metric?
Attach rate. A closed modernization with a service contract attached generates 4–8x its own revenue in lifetime service gross profit; the same job without attach generates only the one-time margin. Booking velocity without attach is one-time revenue; velocity with 85%+ attach is the annuity engine.
What DSO should a Commercial Elevator contractor target?
A blended 65–75 days. The B2B benchmark runs 60–90, and REITs, hospital networks, and universities structurally drag to 75–90. Hold them with milestone billing tied to inspection sign-offs, retainage release at substantial completion rather than final, and net-15 ACH incentives.
How do independents grow if Big-4 OEMs control the controllers?
Through the take-back rate. Modernization lets an independent swap the OEM controller for a non-proprietary platform, permanently removing the OEM's diagnostic lock-in. Target Big-4 accounts at their 5-year renewal cliff with a 25–40% service price differential and owner-choice messaging.
FAQ
Why is service attach rate more important than booking velocity? Because lifetime value lives in the annuity. A $150K traction modernization with a 7-year service contract at $5,500/year and 38% gross margin throws off roughly $14,600/year in service gross profit — over $100K in service GP plus the original job margin. Without attach, the owner price-shops maintenance on day 91 and you keep only the one-time margin. Velocity with high attach is the compounding engine; velocity without it is a treadmill.
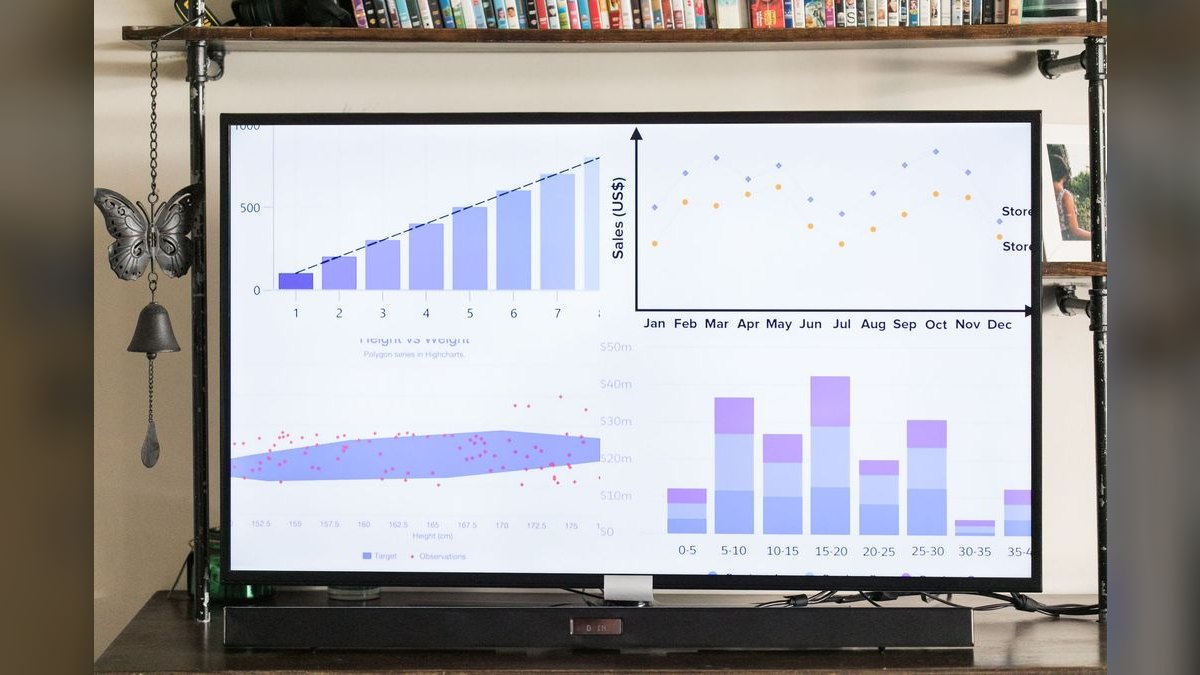
What take-back rate should an independent realistically target? 8–15% annually on a properly built renewal-cliff pipeline, with top performers reaching 12–18% in targeted metros. Identify Big-4 accounts hitting 5-year renewal in the next 12 months (often 60–150 buildings in a mid-size metro), engage 90 days before renewal with a 25–40% price differential, and convert 15–25% of engaged accounts. Below 8% usually signals a pipeline problem, not a close-rate problem.
How do regenerative drives and IoT change modernization economics? Regenerative drives lift ASP by $8K–$25K per car and qualify the owner for IRA Section 179D deductions worth $2.50–$5.00 per square foot. IoT-connected diagnostics lift ASP by $3K–$12K per car and add $1,500–$3,000/year to service ARPU through bundled tiers. Attach both on 35–65% of jobs and blended modernization gross margin rises 4–7 points while service ARPU climbs 20–35% over five years.
What is the right rep quota for a modernization territory in 2027? $3–8M ARR per territory, blended across modernization and attached service. Top-quartile Big-4 reps hit $6–8M; top independents hit $4–6M. Mix should run 60–70% modernization revenue and 30–40% attached service ARR. A rep pacing under $3M for two consecutive quarters gets coached or rotated.
How should we plan for IUEC labor escalation? IUEC contracts negotiate 3–5% annual wage escalators, with benefits pushing total loaded labor cost up 5–7% per year. Build a 6% labor-inflation assumption into any quote extending beyond 90 days and add a labor-escalator clause for installs starting more than 120 days out. Tech retention runs 85–95% on high union pay, but training a journeyman takes five years, so plan capacity around productivity, not hiring speed.
Which metric best predicts whether the P&L is healthy? Attach rate paired with first-time-fix. Attach guarantees the annuity exists; first-time-fix protects its margin. If attach holds above 80% and first-time-fix above 85%, the service book compounds profitably. If either slips — attach below 70% or first-time-fix below 80% — the service P&L can collapse inside two quarters even while bookings look strong.
Sources
- https://www.otis.com
- https://www.kone.com
- https://www.schindler.com
- https://www.tkelevator.com
- https://www.asme.org
- https://www.naec.org
- https://www.bls.gov/ooh/construction-and-extraction/elevator-installers-and-repairers.htm
- https://www.energy.gov
- https://www.nyc.gov/site/buildings/index.page
Related on PULSE
- What are the key sales KPIs for the Commercial Elevator Cab Interior Manufacturing industry in 2027?
- What are the key sales KPIs for the Elevator and Escalator Service industry in 2027?
- What are the key sales KPIs for the Grain Elevator & Bulk Grain Handling industry in 2027?
- What are the key sales KPIs for the Commercial HVAC Service Contracting industry in 2027?
- What are the key sales KPIs for the Commercial Plumbing Contracting industry in 2027?
- What are the key sales KPIs for the Commercial Roofing Contracting industry in 2027?
This page will be disappearing soon. Save it to your device for $1 — or read it free while it is here.
@Kory-White- · if Venmo asks, the last 4 of my number are 2012
This page is gone.
This one is off the shelf now. $1 keeps it on your phone for good — the whole page, pictures and diagrams included.
 pulse-industry-kpisTop 10 KPIs for Junk Removal Companies in 2027
 pulse-industry-kpisTop 10 Sales KPIs for Commercial Janitorial and Cleaning Services in 2027
 pulse-industry-kpisTop 10 Sales KPIs for Commercial Industrial Coatings in 2027
 pulse-industry-kpisTop 10 Sales KPIs for Commercial Sign Maintenance & Electrical Service in 2027
 pulse-industry-kpisTop 10 KPIs for HVAC Contractors in 2027
 pulse-industry-kpisTop 10 Sales KPIs for Fast Fashion Apparel in 2027
 pulse-industry-kpisTop 10 Sales KPIs for Commercial Print Services in 2027
 pulse-industry-kpisTop 10 Sales KPIs for Commercial Chiropractic Practice in 2027
 pulse-industry-kpisTop 10 Sales KPIs for Commercial Glass and Glazing Contracting in 2027
 pulse-industry-kpisTop 10 Sales KPIs for Commercial RV Dealership in 2027