


Top 10 Sales KPIs for Equine Boarding & Training Facilities in 2027
Quality
Certified

The core sales KPIs for equine boarding and training facilities in 2027 are stall occupancy (target 90–95%), revenue per available stall, service attach rate (40–60% of boarders), annual client retention (85–92%), and stall refill time (under 14 days). Occupancy and attach rate drive revenue; retention and refill time protect it.
Two competing scorecards: the occupancy scorecard versus the yield scorecard
Nearly every equine boarding operation eventually lands on one of two philosophies for measuring sales performance, and the choice shapes pricing, staffing, and marketing for years. Understanding both is the prerequisite to picking the right metric set for your barn.
The occupancy scorecard treats the stall as the unit of sale. Its headline number is Stall Occupancy % — filled stalls divided by available stalls — supported by Stall Turnover Refill Time, Waitlist Depth, and New Boarder Acquisition Cost. The logic is straightforward: the barn's cost base is largely fixed. Mortgage or lease, insurance, property taxes, arena maintenance, and a baseline of labor do not shrink when a stall empties. An empty stall is perishable inventory — the night it sits vacant is revenue that can never be recovered. Under this model, the sales job is simple and legible: keep every stall full, refill vacancies fast, and maintain a waitlist so the refill is instant. A barn manager can run this scorecard on a whiteboard.
The yield scorecard treats the *horse* as the unit of sale and asks how much total revenue each one produces. Its headline number is Revenue per Available Stall (RevPAS) — total revenue including board, training, lessons, and ancillary services, divided by *all* stalls whether occupied or not. Supporting metrics are Service Attach Rate %, Service Revenue Mix %, and Lesson & Training Hours Sold. The logic here is margin-driven: board revenue carries roughly 20–35% gross margin after bedding, feed, labor, and facility cost, while training and lessons commonly run 40–60% because the trainer's time is a semi-fixed cost already on the payroll. A barn at 85% occupancy with a 60% attach rate can out-earn a barn at 98% occupancy with a 15% attach rate — and it does so with fewer horses, less manure, less labor, and less wear on the property.
The trade-off is real and it is not a false choice dressed up for symmetry. The occupancy scorecard is easier to run, easier to explain to staff, and correct when the facility is new, underfilled, or in a market with abundant competing barns. It is also the scorecard that quietly rewards underpricing — the fastest way to hit 98% occupancy is to be the cheapest barn in the county, which locks in a low-margin, high-labor clientele that is difficult to unwind later. The yield scorecard produces better economics but requires infrastructure the occupancy scorecard does not: a training program with capacity, a trainer or two whose time can be sold, an arena that is not already saturated, and enough clientele sophistication that lessons and show prep are wanted rather than upsold.

Most facilities that plateau are running the occupancy scorecard past the point of usefulness. They hit 92% occupancy, congratulate themselves, and then wonder why profit is flat for three straight years — because occupancy stopped being the constraint somewhere around year two and nobody changed the metric.
Choosing the scorecard that fits your facility
The decision is not permanent, and it is not a matter of taste. It follows from three observable conditions in your own operation: where occupancy currently sits, whether trainer capacity is available, and how the local market prices board.
Start with occupancy. If you are below roughly 85%, the occupancy scorecard is correct and the yield conversation is premature. Empty stalls are the binding constraint, and every hour spent designing a training-package attach strategy is an hour not spent refilling stalls that are bleeding fixed cost. At 85% in a 30-stall barn, four to five stalls sit empty; at a $900 average board rate that is roughly $4,000 in monthly revenue evaporating with no corresponding cost reduction. Fix that first.
Once occupancy stabilizes above 90%, the constraint moves. Adding boarders now requires capital — building stalls, buying land, expanding turnout — while adding service revenue requires only scheduling. That is the moment to shift the primary metric from Stall Occupancy % to RevPAS, and to make Service Attach Rate % the number the team is actually managed against.
The second gate is trainer capacity. Lesson and training hours are only high-margin if the trainer's time is already a fixed cost that is currently underused. If your trainer is booked forty hours a week and turning away requests, "increase attach rate" means "hire a second trainer" — which is a capacity decision with real payroll consequences, not a sales optimization. Audit the arena schedule before setting an attach-rate target: if the indoor sits empty from 8 a.m. to 2 p.m. every weekday, you have obvious headroom for group lessons, adult beginner programs, or leasing arena time to independent trainers.
The third gate is local board pricing. In a market where the going rate is $400–$600 full board, service revenue is often the only path to a viable margin, and the yield scorecard is mandatory regardless of occupancy. In a $1,200–$1,800 market, board alone can carry the facility and the yield scorecard becomes an accelerant rather than a survival requirement.
The numbers behind the occupancy scorecard

Four metrics carry the occupancy model. Each has a defensible 2027 target range and a specific failure mode when it drifts.
Stall Occupancy % — filled stalls divided by available stalls, measured on the same day each month. Target 90–95%. Do not chase 100%: a barn with zero slack has no room to accept a high-value client who calls in March, and no buffer for a horse that needs to be moved for medical isolation. Below 80% most small facilities are at or under breakeven, because the fixed base — mortgage, insurance, property tax, baseline labor — typically consumes the first 70–80% of stalls' revenue.
Stall Turnover Refill Time — days between a horse leaving and a new one arriving. Target under 14 days with a functioning waitlist; 14–45 days is the common range without one. The arithmetic is direct: at $900 board, 30 vacant days costs $900, and if a 30-stall barn turns over six stalls a year at 30 days each, that is roughly $5,400 in annual revenue lost to friction alone — recoverable almost entirely by maintaining a warm list.
Waitlist Depth — named prospects who have said yes to the next opening. A depth of 5–20 is healthy for an in-demand facility. Under 5 means your next vacancy will sit. Consistently over 25–30 is a pricing signal: the market is telling you board is underpriced, and a 5–10% increase at renewal will likely cost you fewer clients than you fear.
Lead-to-Stall Conversion Rate — inquiries (calls, web forms, tour requests) that become boarded horses. Target 25–35% for a mid-market barn; well-run operations reach 40–50% through same-day response, a scheduled tour rather than a drop-in, and published pricing. Below 20% the problem is almost always one of three things: price misaligned with the local market, facility presentation (untidy aisle, poor lighting, visible disrepair on the tour route), or response lag past 24 hours. The cost of the gap is easy to size — at $1,000 board, one unclosed lead is $12,000 in annual revenue foregone.
New Boarder Acquisition Cost — total sales and marketing spend divided by new boarders signed. Honest ranges run roughly $150–$600. Referral-driven barns sit at the low end; paid social, event sponsorship, and open-house programs push it higher. Pair it with conversion rate before judging it: spending $500 per lead at 15% conversion means $3,333 per acquired client, which only pencils if average tenure clears roughly 2.5 years.
The numbers behind the yield scorecard

Revenue per Available Stall (RevPAS) — total monthly revenue from every source divided by *total* stalls, occupied or not. This is the equine analogue of hotel RevPAR, and it is deliberately unforgiving because it refuses to let you hide an empty stall. Mid-market facilities should target roughly $1,800–$2,800 per stall per month; premium operations with deep training programs reach $3,500–$5,000. Read it against occupancy: RevPAS flat while occupancy climbs means you filled stalls by discounting. RevPAS climbing while occupancy falls means you are pricing out the core clientele and the trend will reverse painfully.
Service Attach Rate % — the share of boarders who also buy training, lessons, or premium care. Target 40–60%; strong operators clear 50%. This is the single highest-leverage number above raw occupancy, because it converts a $900 board client into a $1,600 total-revenue client using the trainer hours you are already paying for.
Revenue per Stall (occupied) — board plus attached services on filled stalls. The 2027 benchmark is board plus 30–60% in service revenue. A $900 board stall generating $1,170–$1,440 total is performing; one generating $920 is a boarder you have never actually sold anything to.
Service Revenue Mix % — revenue split across boarding, training, lessons, and ancillary services (blanketing, farrier and vet coordination, show prep, hauling). A facility at 80%+ boarding revenue is fragile: boarders can move to a cheaper barn in a weekend, and there is nothing else holding them. Target 55–65% boarding, with training at 15–25%, lessons at 10–15%, and ancillary at 5–10%. Shifting five points of revenue from board to services typically moves facility profit margin three to five points, because you are trading 20–35% margin dollars for 40–60% margin dollars on infrastructure you already own.
Lesson & Training Hours Sold — billable instruction hours per month, trended against trainer capacity rather than against an absolute target. The useful ratio is hours sold divided by hours available. Below 60% you have a marketing problem; above 85% you have a hiring decision.
Client Retention Rate % — boarding clients retained year over year. Target 85–92%. Horse owners move barns reluctantly — the horse is settled, the trainer relationship is real, the trailer logistics are a genuine burden — which means churn in this industry is a loud signal, not background noise. Every lost client costs the board revenue, the attached service revenue, the acquisition cost of a replacement, and the vacant days in between.
Average Client Tenure — target 3+ years. Tenure is what makes acquisition cost tolerable: a $500 acquisition cost against a client generating $1,400 monthly for 36 months is trivial; against an 8-month client it is a loss.
Sequencing the rollout without stalling the barn
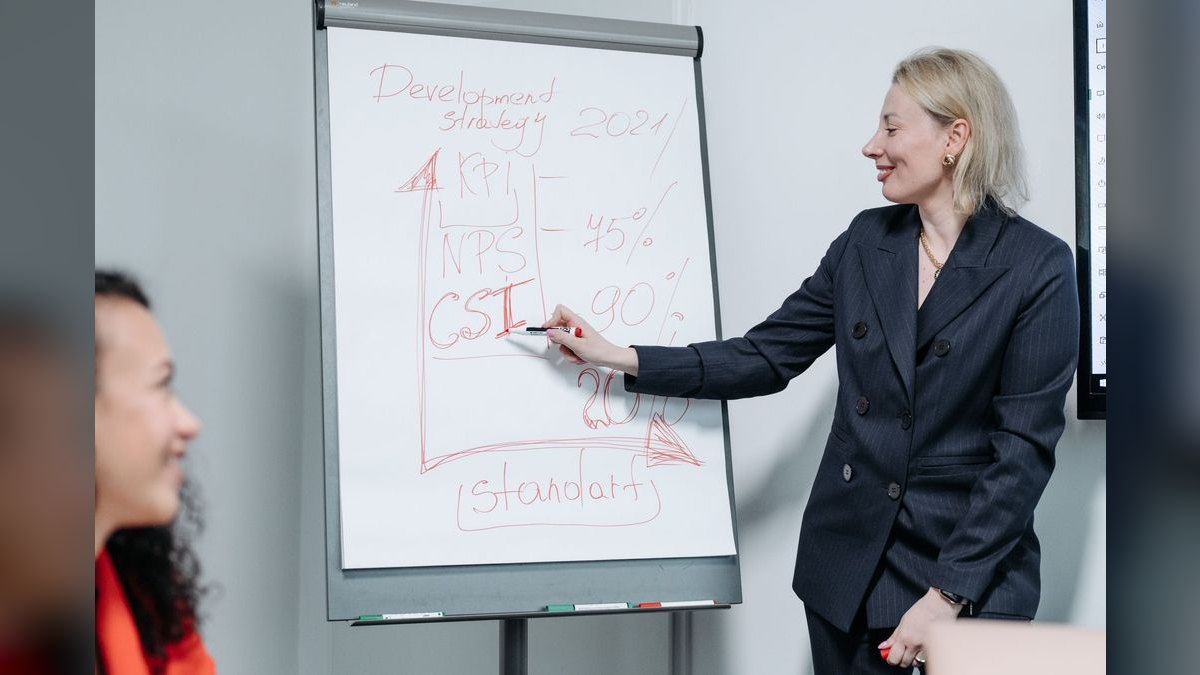
The failure mode is not choosing the wrong metric — it is building a nine-metric dashboard in one weekend, watching it go stale by week three, and concluding that KPIs do not work for a horse operation. Sequence the rollout instead.
Weeks 1–2: define and instrument three metrics only. Pick Stall Occupancy %, Lead-to-Stall Conversion Rate, and Client Retention Rate. Write the exact formula and named data source for each in a single document. Ambiguous definitions — does a stall held for a horse arriving next month count as occupied? — are the most common reason a dashboard gets quietly abandoned. Decide once, in writing.
Weeks 3–6: fix the lead capture. Most barns lose conversion data before they lose the lead. Log every inquiry with date, source, horse discipline, and outcome, even in a spreadsheet. Facilities that start tracking source and outcome commonly see conversion improve substantially within a quarter for a mundane reason: the act of logging forces same-day follow-up.
Weeks 7–12: automate the feed. Pull board revenue from the accounting system, lesson and training hours from the scheduling tool, and occupancy from the stall chart. Any number that depends on a person remembering to update a cell will silently stop being true. Assign one named owner per metric — a dashboard everyone watches and nobody owns changes no behavior.
Month 4 onward: layer in the yield metrics. Add RevPAS, Service Attach Rate %, and Service Revenue Mix % only after the occupancy metrics are stable and trusted. Set the cadence by metric type: occupancy, refill time, and conversion get reviewed weekly with the barn team; retention, tenure, RevPAS, and mix get reviewed monthly with ownership. Match the cadence to how fast the number can actually move — reviewing annual retention weekly trains everyone to ignore the dashboard.
Benchmark against your own trailing twelve months before you benchmark against the ranges above. A metric moving the right direction month over month is worth more than hitting a generic industry figure once. The targets here are starting points for a facility that does not yet have its own history — replace them with your own the moment you have twelve months of clean data.
Where the two scorecards conflict in practice
Running both sets of metrics surfaces genuine tensions that a single-scorecard barn never has to resolve, and they are worth naming before they arrive as arguments.
Discount pricing to fill a stall. The occupancy metric says take the $650 boarder to fill the empty stall today. The yield metric says a $650 client who buys nothing drags RevPAS down permanently and anchors your pricing for the next prospect who tours the barn and hears the rate from a current client. The practical resolution: offer a *time-limited* introductory rate that steps to standard within 90 days, or trade the discount for a service commitment — reduced board with a six-lesson package attached.

The difficult long-tenure client. Retention says keep them; margin says the daily blanket changes, the special feed, the constant schedule exceptions, and the friction with other boarders make them a net loss. Price the exceptions explicitly as ancillary services rather than absorbing them into board. Either the revenue arrives or the behavior changes; both outcomes are acceptable.
Waitlist versus rate increase. A deep waitlist tempts you to raise board immediately. Occupancy says do not disturb a full barn. The measured play is a 5–8% increase at annual renewal applied to everyone, paired with a visible facility improvement — resurfaced arena footing, upgraded turnout, added fans — so the increase reads as investment rather than extraction.
Trainer time allocation. Lesson hours to outside clients carry excellent margin but consume arena time and trainer attention that boarded clients believe they are paying for. Cap outside-client hours as a fixed percentage of trainer capacity, and publish the arena schedule so boarders can plan around it. The KPI to watch is retention among boarders in the discipline most affected — if it drops, the outside-lesson revenue was borrowed from your recurring base.
Related questions
Which single metric should a new facility track first?
Stall Occupancy %. Until you are consistently above 85%, empty stalls are the binding constraint and every other metric is noise. Add Lead-to-Stall Conversion Rate second, because it tells you whether low occupancy is a demand problem or a sales-process problem.
How is RevPAS different from revenue per stall?
Revenue per stall divides revenue by *occupied* stalls; RevPAS divides by *all* stalls. RevPAS therefore penalizes vacancy and underpricing simultaneously, which makes it the harder and more honest number for a facility at stable occupancy.
What attach rate is realistic for a boarding-only barn?
If you have no trainer on site, attach revenue comes from ancillary care — blanketing, holding for farrier and vet, clipping, hauling. That realistically reaches 20–30% of boarders rather than 40–60%. The higher band assumes a training and lesson program.
How often should these KPIs be reviewed?
Occupancy, refill time, and lead conversion weekly with the barn team. Retention, tenure, RevPAS, and service revenue mix monthly with ownership. Reviewing a slow-moving annual metric weekly teaches the team the dashboard is theater.
Does seasonality distort these numbers?

Yes. Lesson hours and show-prep revenue swing heavily by season in most regions, and occupancy can dip in winter. Compare each metric to the same month last year rather than to last month, and use trailing-twelve-month figures for retention and tenure.
FAQ
What is the most important sales KPI for an equine boarding facility?
Stall Occupancy % when the barn is underfilled, RevPAS once it is not. Revenue is capacity-constrained, so occupancy dominates early — a healthy range is 90–95%, and below 80% most small facilities are at or below breakeven against a largely fixed cost base. Once occupancy is stable, the constraint shifts to yield per stall.
How quickly should a facility refill an empty stall?
Under 14 days if you maintain a waitlist. Without one, 14–45 days is typical. Each vacant day is unrecoverable recurring revenue, so a warm list of five to twenty named prospects is the cheapest revenue protection available to a boarding operation.
Why does Client Retention Rate matter more than new boarder acquisition?
Because tenure compounds. A retained client generates board plus attached service revenue for years, while a departure costs the board revenue, the service revenue, the acquisition cost of a replacement, and the vacant days between. Target 85–92% annual retention and 3+ years average tenure.
What is a realistic new boarder acquisition cost?
Roughly $150–$600 per boarder, depending on channel mix. Referral-driven barns land at the low end; paid advertising and event-based marketing at the high end. Judge it against conversion rate and tenure — a $500 cost is fine against a three-year client and poor against an eight-month one.
How much service revenue should each boarded horse generate?
Board plus 30–60% in attached services on an occupied stall, with 40–60% of boarders buying something beyond board. Training and lessons carry roughly 40–60% gross margin versus 20–35% on board, which is why attach rate moves profit faster than occupancy once the barn is full.
What does a healthy service revenue mix look like?
Roughly 55–65% boarding, 15–25% training, 10–15% lessons, and 5–10% ancillary services. Above 80% boarding revenue the facility is fragile, because boarders can relocate quickly and nothing else anchors the relationship or the margin.
Sources
- https://www.horsecouncil.org/ — American Horse Council, national equine industry economic impact data
- https://www.ibisworld.com/ — market research and financial benchmarks for equine boarding and training operations
- https://thehorse.com/ — The Horse, equine business and facility management coverage
- https://www.sba.gov/ — U.S. Small Business Administration, KPI and financial management guidance for small service businesses
- https://www.statista.com/ — aggregated equine industry revenue and operating statistics
- https://extension.psu.edu/ — Penn State Extension, equine facility business management resources
- https://www.uky.edu/Ag/AnimalSciences/pubs/ — University of Kentucky Ag Equine Programs, boarding operation economics
- https://www.ers.usda.gov/ — USDA Economic Research Service, agricultural service business data
Related on PULSE
This page will be disappearing soon. Save it to your device for $1 — or read it free while it is here.
@Kory-White- · if Venmo asks, the last 4 of my number are 2012
This page is gone.
This one is off the shelf now. $1 keeps it on your phone for good — the whole page, pictures and diagrams included.
 pulse-industry-kpisTop 10 Sales KPIs for Commercial Heavy Truck Dealership in 2027
 pulse-industry-kpisTop 10 KPIs for Chiropractic Practices in 2027
 pulse-industry-kpisTop 10 Sales KPIs for Medical Billing and Revenue Cycle Management in 2027
 pulse-industry-kpisTop 10 Sales KPIs for Industrial Laser Cutting & Waterjet Job Shops in 2027
 pulse-industry-kpisTop 10 Sales KPIs for Commercial Solar Carport Construction in 2027
 pulse-industry-kpisTop 10 Sales KPIs for Commercial Crane Rental in 2027
 pulse-industry-kpisTop 10 Sales KPIs for Architectural Hardware Specification Consulting in 2027
 pulse-industry-kpisTop 10 Sales KPIs for Clinical Trial Site Network in 2027
 pulse-industry-kpisTop 10 Sales KPIs for Commercial Electrical Contracting in 2027
 pulse-industry-kpisTop 10 Sales KPIs for Marine Sail & Rigging Loft Services in 2027