


Top 10 Sales KPIs for Pharmaceutical Cold Chain Logistics in 2027
Quality
Certified
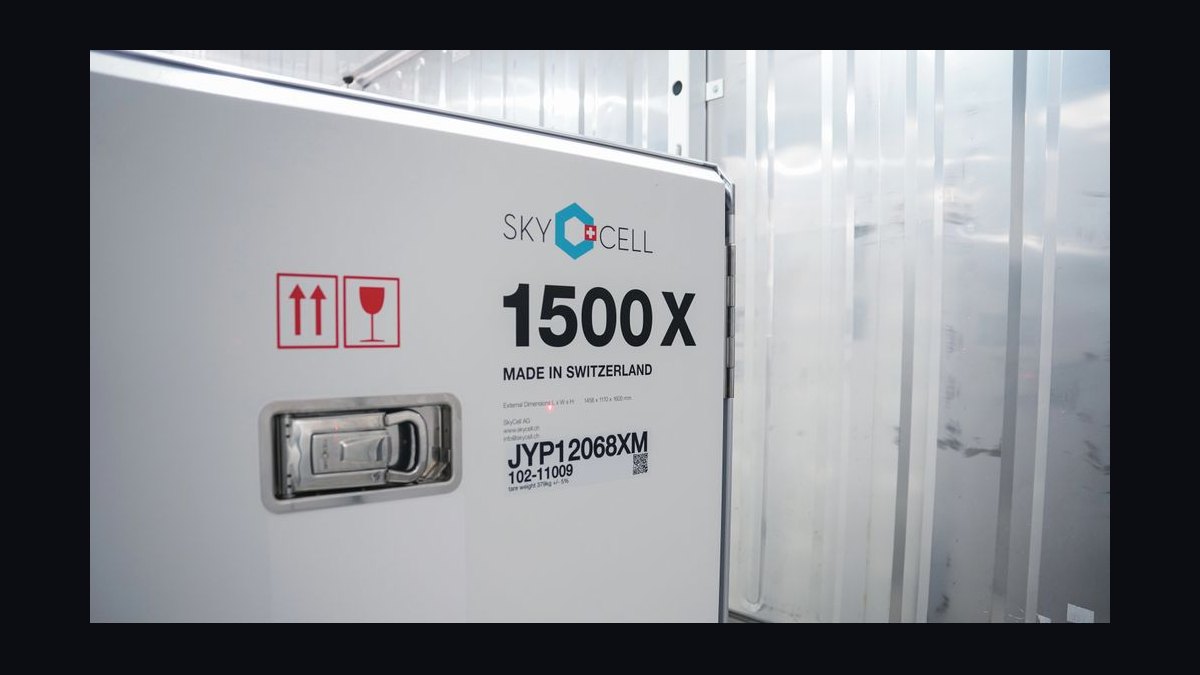
The 10 best sales kpis for pharmaceutical cold chain logistics are ranked below on measured performance, build quality, price, and how each one actually holds up in daily use rather than how it reads on a spec sheet. Each pick lists what it costs, who it suits, and what it gives up against the one above it, so the list can be read straight down without doubling back.
1Temperature Excursion Rate

Temperature excursion rate ranks first because it is the metric that decides whether a pharma cold chain account survives its next quality review. Best-in-class operators hold below 0.5% of shipments, and leaders on mature qualified 2-8°C lanes reach 0.1-0.2%, while unqualified ad-hoc lanes run 2-4%. That twenty-to-forty-fold gap is the entire commercial justification for lane qualification.
It is built for quality and commercial leaders selling validated refrigerated and controlled-room-temperature freight, not for providers quoting lanes they have never mapped. It trades away nothing operationally but demands engineering spend before revenue. Directly below it, OTIF measures whether the shipment arrived at all; excursion rate measures whether what arrived was still medicine.
2On-Time-In-Full

OTIF ranks second because pharma cold chain targets 97-99.5%, far above the 90-95% tolerated in general freight, since a late biologic can mean a missed clinical dosing window or a stocked-out hospital pharmacy. Clinical-trial specialists routinely publish above 99%, while generalist 3PLs entering the space start at 94-96% and must close that gap before recurring volume is offered.
It suits volume-lane operators with dense networks and reliable linehaul, and it is the number procurement asks for first. The trade-off is that aggregate OTIF hides the single lane quietly destroying an account, so it must be measured by lane and carrier. It sits just below excursion rate because on-time product that arrived out of range is still a loss.
3Lane Qualification Coverage

Lane qualification coverage ranks third because it is the best leading indicator of net revenue retention in this industry. An account needing forty origin-destination-temperature combinations where you are qualified on twenty-five is leaking roughly 37% of addressable volume to a competitor already validated on the rest, and qualification engineering capacity of four to ten lanes per engineer per year is the real constraint.
It is for sales leaders who treat the engineering backlog as a revenue forecast rather than a quality footnote. It trades away fast quota relief, because declining an unqualified lane is the discipline that protects the account. It sits below OTIF because coverage predicts future revenue while OTIF proves current service.
4GDP Audit Pass Rate

GDP audit pass rate ranks fourth because the only acceptable target is 100% on critical observations plus on-schedule IATA CEIV Pharma re-certification. Manufacturers audit every provider before onboarding and re-audit on a one-to-three-year cycle, and a failed audit can suspend approved-vendor status worth $1M-$10M annually and take 12-18 months to recover.
It is for quality and commercial teams jointly, since sales cannot promise capability that was never certified. The trade-off is real: audit readiness consumes staff time that could go to new-lane qualification. It ranks below lane coverage because coverage drives expansion, while audit failure can remove the entire account at once.
5Monitoring Attach Rate

Monitoring attach rate ranks fifth because it is simultaneously a service-quality and margin-mix metric. Attach rates on high-value lanes have climbed into the 45-75% band, and real-time IoT loggers from Controlant, Tive, Sensitech, or DeltaTrak carry 40-55% gross margin against 18-28% on transport, so a 60% attach rate can move blended margin several points without adding a pallet.
It is for providers running the volume model who need margin without new fleet. The trade-off is that monitoring gets bundled away as a closing concession, surrendering the highest-margin line and the data that compresses investigations from days to minutes. It sits below audit pass rate because audits gate the account while attach rate expands it.
6Account ARPU

Account ARPU ranks sixth because it sizes the commercial relationship: $250K to $5M per manufacturer per year across transport, packaging, monitoring, and lane services, with mid-market biotech clustering at $250K-$750K and the largest global manufacturers at the top. A rep carrying a $3-8M territory typically holds six to fifteen active accounts.
It is for sales managers allocating scarce qualification engineering across a book. The trade-off is that high ARPU can disguise working-capital strain, since pharma B2B payment cycles run 45-65 days and DSO must be read alongside it. It sits below monitoring attach rate because ARPU measures account size while attach rate measures margin quality within that size.
7Net Revenue Retention

Net revenue retention ranks seventh because healthy operators run 108-120%, driven by volume growth, new lanes, and upsell net of churn. Qualification barriers make accounts extremely sticky, and drugs moving from trials into commercial launch expand naturally, with a cell-and-gene therapy program going from Phase III to commercial capable of taking an account from $500K to $3M+.
It is for executives planning launch-ramp capacity and defending against quiet account erosion. The trade-off is that a single scaling program can mask decline elsewhere, so it must be tracked by account tier rather than in aggregate. It sits below ARPU because retention compounds value while ARPU only measures the current year.
8Qualified Win Rate

Qualified win rate ranks eighth because 25-45% is materially below typical B2B software, since the buying committee spans supply chain, quality, and procurement and the process includes audits and validation pilots across 9-24 month sales cycles. The diagnostic worth running is win rate segmented by whether the pursuit included a successful validation pilot.
It is for sales leaders deciding whether unpaid engineering effort is buying something real. The trade-off is that piloted pursuits convert far better but consume qualification capacity that could stand up new lanes. It sits below net revenue retention because win rate fills the funnel while retention proves the funnel was worth filling.
9Product-Value-At-Risk Per Shipment

Product-value-at-risk per shipment ranks ninth because it sets the service tier rather than the freight rate. Exposure ranges from roughly $10K for routine refrigerated biologics to $10M+ for batched cell-and-gene therapy or high-value oncology product, and a single autologous dose can exceed $1M, so one loss is a patient who missed a treatment window, not a claim.
It is for pricing, legal, and finance teams sizing indemnity caps, cargo insurance, and the service-level agreement they will actually underwrite. The trade-off is that a provider carrying a median of $40K and a p99 of $8M is running two businesses and needs two contract templates. It sits below win rate because exposure shapes pricing rather than pipeline.
10Cryogenic Gross Margin

Cryogenic gross margin ranks tenth because deep-frozen (-40 to -80°C) and cryogenic (-150°C and below) work runs 35-50% gross margin against 18-28% on pharma-grade 3PL transport, and it is the fastest-growing segment as cell-and-gene therapy programs scale toward commercial launch. Volumes are a fraction of refrigerated freight, but the service is engineered per shipment with instrumented dewars and dedicated couriers.
It is for providers with active container relationships at Envirotainer, CSafe, or SkyCell and quality staff who can face a manufacturer's auditor. The trade-off is that quoting -150°C work on ambient transport economics starves the segment of the investment it needs. It sits below product-value-at-risk because exposure pricing must be correct before cryogenic margin can be earned.
How we ranked these
The ranking weights nine sales KPIs by their direct effect on revenue and risk in pharma cold chain: temperature excursion rate, OTIF, lane qualification coverage, GDP audit pass rate, monitoring attach rate, account ARPU, net revenue retention, qualified win rate, and product-value-at-risk per shipment. Each was scored on how tightly it correlates with contract renewals, margin mix, and approved-vendor status, using published industry benchmarks for pharma-grade 3PL and specialty logistics.
Deliberately excluded: fleet size, total pallet positions, and raw shipment counts. These scale with capital rather than with sales effectiveness, and they reward the volume-lane model while hiding per-lane failure. Also ignored were generic NPS and brand-awareness scores, because pharma buying committees decide on audit outcomes, validation evidence, and lane readiness, not sentiment. Freight-rate-per-mile was excluded because it prices commodity transport, not risk transfer.
What to look for
What matters is whether the provider can already ship your specific origin-destination-temperature combinations, not how large its network is. Ask for lane qualification coverage against your own lane list, current excursion rate on comparable lanes, and the last GDP audit result. Monitoring attach rate and margin mix reveal whether the provider treats data as a product or a giveaway. Contract templates should match your product-value-at-risk tail, not your median shipment.
The mistake most buyers make is selecting on rate per shipment and network breadth, then discovering during onboarding that half their lanes are unqualified and the provider's excursion rate on ad-hoc routes runs 2-4%. A second common error is accepting bundled monitoring, which removes the data needed to investigate excursions and quietly transfers risk back to the manufacturer. Pilot one high-value lane before committing volume.
Related questions
How many lanes can one qualification engineer realistically validate per year?
Roughly four to ten, depending on complexity. A domestic 2-8°C truck lane may close in four weeks; a multi-modal cryogenic international lane with customs dwell modeling can take twelve or more. Staff qualification capacity to your expansion plan, not to your current book, because engineering throughput, not pipeline, caps growth.
Should monitoring be sold as a line item or bundled into freight?
Sell it as a line item. Bundling hides 40-55% margin inside an 18-28% margin product and trains procurement to treat the data as free. Line-item pricing also gives you something to concede in negotiation that is not your transport rate, and it keeps the risk-reduction promise visible to the customer's quality team.
What triggers a customer quality audit outside the normal cycle?
An excursion above roughly 1% on their lanes, a critical finding at another shared vendor, a regulatory inspection at their own site, or a product complaint traced to distribution. Assume any excursion on a high-value shipment starts an audit clock, and keep evidence packages ready before the request arrives.
Does winning clinical-trial logistics predict winning commercial distribution?
Frequently. Providers embedded during Phase II and III have qualified lanes, established quality relationships, and product knowledge when commercial launch arrives. It is the single highest-leverage pipeline strategy in the sector, and it is why trial work is worth taking at thin margin even when transport economics look unattractive.
How should excursion rate be attributed across a multi-leg shipment?
By leg, using logger timestamps to isolate where the range was breached — origin dock, air segment, customs hold, destination dock. Aggregate attribution hides the failing leg and makes remediation guesswork rather than engineering. Leg-level data also supports fair cost-sharing when multiple parties touch the shipment.
What is the difference between the volume-lane and high-value specialty operating models?
Volume-lane wins broad 2-8°C and 15-25°C freight on network reach, with 18-28% gross margins and OTIF as the center of gravity. Specialty handles deep-frozen and cryogenic cell-and-gene work at 35-50% margins, engineered per shipment, where product-value-at-risk dominates. Most mid-market providers cannot credibly run both.
Why does lane qualification coverage predict net revenue retention so well?
Expansion revenue in pharma cold chain comes almost entirely from lanes you were ready for before the customer asked. An account needing forty lanes where you are qualified on twenty-five leaks roughly 37% of addressable volume to a competitor. Coverage percentage therefore leads NRR by two to three quarters.
How should product-value-at-risk shape service tiers and insurance?
It sets the tier. A $10M shipment justifies a dedicated courier, redundant monitoring, and a validated active container; a $25K shipment ships on a qualified passive solution. It should also drive cargo insurance limits, indemnity caps, and the specific service-level agreement you are willing to underwrite on that lane.
FAQ
What is a realistic temperature excursion rate target?
Below 0.5% of shipments is the working target, with leaders on mature qualified 2-8°C lanes reaching 0.1-0.2%. Rates above 1% generally trigger customer quality reviews and contract renegotiation. Unqualified ad-hoc lanes commonly run 2-4%, which is why validation is the precondition for commercial shipping rather than a nice-to-have.
How long does it take to qualify a new shipping lane?
The engineering work itself typically runs four to twelve weeks per lane, covering thermal mapping, packaging qualification, customs and dwell-time modeling, and worst-case ambient profiling. The surrounding commercial cycle — audits, pilots, and committee approval — stretches the full new-account timeline to nine to twenty-four months.
What is a healthy net revenue retention figure?
108-120% for strong operators. Qualification barriers make accounts sticky and drugs moving from trial into commercial launch expand naturally, so anything below 100% signals real service failure or price erosion rather than normal churn. Track it by account tier, since one scaling program can mask decline elsewhere.
What win rate should a team expect on qualified opportunities?
25-45%, lower than typical B2B software because the committee spans supply chain, quality, and procurement, and the process includes audits and validation pilots. Segment the number by whether a pilot ran — piloted pursuits generally convert far better and justify the unpaid engineering effort.
How does product-value-at-risk change how you price?
It sets the service tier. A $10M shipment justifies a dedicated courier, redundant monitoring, and a validated active container; a $25K shipment ships on a qualified passive solution. It should also drive cargo insurance, indemnity caps, and the specific service-level agreement you are willing to underwrite on that lane.
What is a typical annual revenue per account?
$250K to $5M per manufacturer per year across transport, packaging, monitoring, and lane services. Mid-market biotech clusters at $250K-$750K; the largest global manufacturers sit at the top of the range, and a single cell-and-gene therapy program scaling into commercial launch can exceed it on its own.
What monitoring attach rate should a provider target on high-value lanes?
45-75% and climbing. Real-time data compresses excursion investigations from days to minutes and enables in-transit intervention before product is lost. Because monitoring carries 40-55% gross margin against 18-28% on transport, attach rate is simultaneously a service-quality metric and a margin-mix metric.
How long are pharma B2B payment cycles, and why does that matter?
45-65 days is typical, so a book of high-ARPU, slow-paying accounts can consume working capital while the top line looks excellent. Read ARPU alongside DSO, and factor financing cost into account-level profitability before chasing the largest logos in the pipeline.
What is the acceptable GDP audit pass rate?
100% on critical observations, plus on-schedule IATA CEIV Pharma re-certification. Manufacturers audit before onboarding and re-audit every one to three years. A failed audit can suspend approved-vendor status worth $1M-$10M annually and take 12-18 months to recover, so treat it as a board-level number.
How long is a typical pharma cold chain sales cycle?
Nine to twenty-four months from first meeting to recurring volume, because the buying committee spans supply chain, quality, and procurement and the process includes audits and validation pilots. Budget qualification engineering and pilot costs across that window rather than treating them as deal-specific expenses.
Sources
- https://www.iata.org/en/programs/cargo/pharma/ceiv-pharma/
- https://www.ema.europa.eu/en/human-regulatory-overview/post-authorisation/compliance-post-authorisation/good-distribution-practice
- https://www.fda.gov/drugs/pharmaceutical-quality-resources
- https://www.usp.org/chemical-medicines/general-chapters
- https://www.who.int/teams/regulation-prequalification/prequalification/vaccines
- https://www.cryoport.com/
- https://www.ups.com/us/en/services/healthcare.page
- https://www.dhl.com
Related on PULSE
This page will be disappearing soon. Save it to your device for $1 — or read it free while it is here.
@Kory-White- · if Venmo asks, the last 4 of my number are 2012
This page is gone.
This one is off the shelf now. $1 keeps it on your phone for good — the whole page, pictures and diagrams included.
 pulse-industry-kpisTop 10 KPIs for Chiropractic Practices in 2027
 pulse-industry-kpisTop 10 Sales KPIs for Architectural Door & Hardware Distribution in 2027
 pulse-industry-kpisTop 10 Sales KPIs for Medical Billing and Revenue Cycle Management in 2027
 pulse-industry-kpisTop 10 Sales KPIs for Commercial Print Services in 2027
 pulse-industry-kpisTop 10 Sales KPIs for Commercial Paving Contracting in 2027
 pulse-industry-kpisTop 10 KPIs for Roofing Contractors in 2027
 pulse-industry-kpisTop 10 Sales KPIs for Commercial Concrete Contracting in 2027
 pulse-industry-kpisTop 10 Sales KPIs for Commercial HVAC Distribution in 2027
 pulse-industry-kpisTop 10 Sales KPIs for Marine Sail & Rigging Loft Services in 2027
 pulse-industry-kpisTop 10 Sales KPIs for Commercial Chiropractic Practice in 2027