


Top 10 Sales KPIs for Convenience Store in 2027
Quality
Certified

The 10 best sales kpis for convenience store are ranked below on measured performance, build quality, price, and how each one actually holds up in daily use rather than how it reads on a spec sheet. Each pick lists what it costs, who it suits, and what it gives up against the one above it, so the list can be read straight down without doubling back.
1In-Store Sales per Store per Day
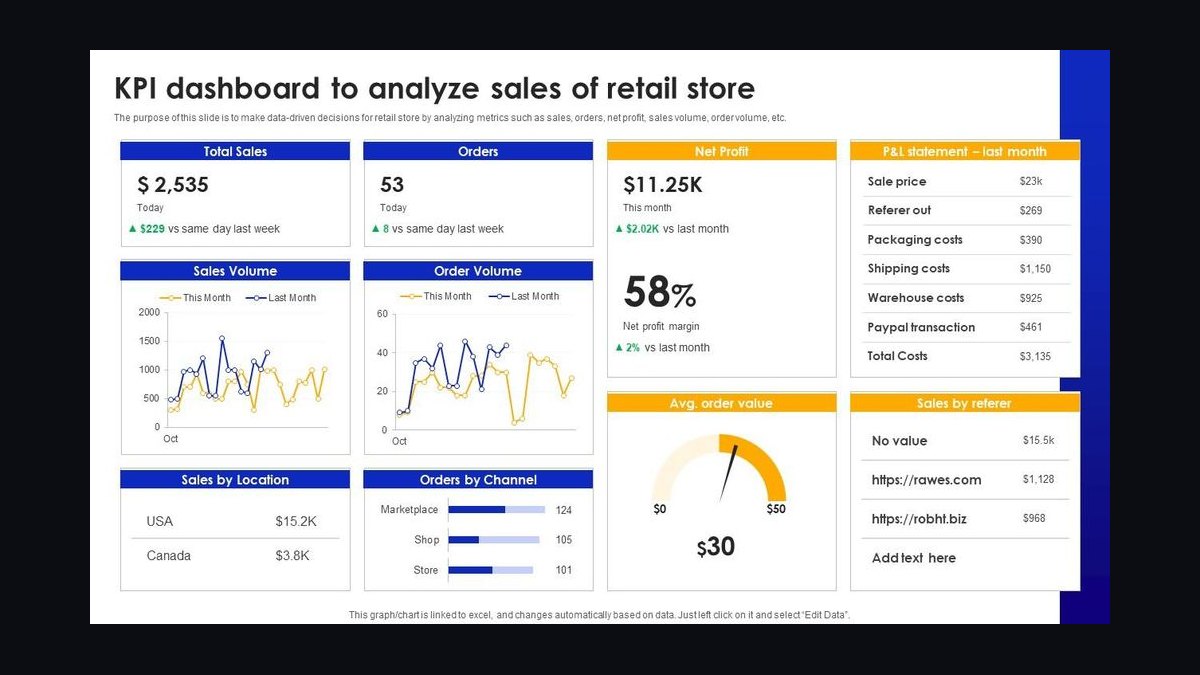
Ranks first because it is the single best four-wall productivity metric for any c-store. NACS State of the Industry 2026 pegs the industry average near $5,800-$6,200 per store per day, with QuikTrip and Wawa running $12,000-$18,000 and legacy 7-Eleven closer to $3,500. It captures merchandise plus prepared food in one number.
Built for chain operators and CFOs comparing stores across banners and regions. It trades away category-level detail, so it must be paired with food-service mix and beverage attach to explain why a store over- or under-performs. Ranked above Motor-Fuel Gallons because inside sales, not fuel volume, funds the building and carries the higher gross margin.
2Motor-Fuel Gallons per Store per Day
Second because fuel is the traffic engine that pulls customers onto the forecourt and into the store. Industry average runs roughly 4,000-4,500 gallons per store per day, while high-volume Pilot/Flying J truck stops do 25,000-plus. U.S. c-store channel gallons grew only 0.5% in 2025 per NACS, essentially flat.
Suited to fuel-anchored operators and real-estate teams evaluating site throughput. It trades away margin information, since a high-gallon store can still lose money at the pump. Ranked just below In-Store Sales because gallons generate traffic, but the inside ticket converts that traffic into the margin that actually pays rent.
3Fuel Margin in Cents per Gallon
Third because it is the headline volatility metric that determines whether the forecourt funds the land. Reported same-store fuel margins ran 40-48 cents in 2025-2026 at ARKO, Casey's, and the public chains. ARKO posted 48.0 cents per gallon in Q1 2026 versus 38.7 cents the prior year, a 24% swing driven mostly by crude.
Built for CFOs and fuel-pricing analysts who reconcile margin to OPIS rack movement every quarter. It trades away volume context, since a fat margin on collapsing gallons still shrinks total fuel profit. Ranked below Motor-Fuel Gallons because margin without volume is a pricing artifact, not an operating result.
4Food-Service Percent of In-Store Sales
Fourth because food service is the only real organic growth lever left in the c-store model. Casey's runs roughly one-third of inside sales through prepared food, and that mix carries 55-60% gross margin versus 30-32% on packaged goods. Casey's inside margin hit 42.4% in fiscal 2026 on pizza-led foodservice.
Built for operators building kitchens and multi-day-part menus, not packaged-goods retailers. It trades away simplicity, because kitchen labor, throw rates, and waste tracking all come with it. Ranked below Fuel Margin because food service takes 12-24 months to mature, while fuel margin moves the P&L this quarter.
5Packaged-Beverage Attach Rate
Fifth because beverages are the highest-frequency category and the gateway to combo offers inside the store. Best-in-class operators run packaged-beverage attach above 55% of inside transactions, with dispensed-beverage attach from fountain, coffee, and fresh-brewed iced tea layered on top. Circana c-store scan data tracks the category weekly.
Built for category managers and merchandising teams running planogram and combo-offer tests. It trades away basket-size context, since a high attach rate on low-ticket beverages can still leave the average ticket flat. Ranked below Food-Service Percent because attach is a frequency metric, while food-service mix is a margin metric.
6Tobacco and Nicotine-Pouch Category Share
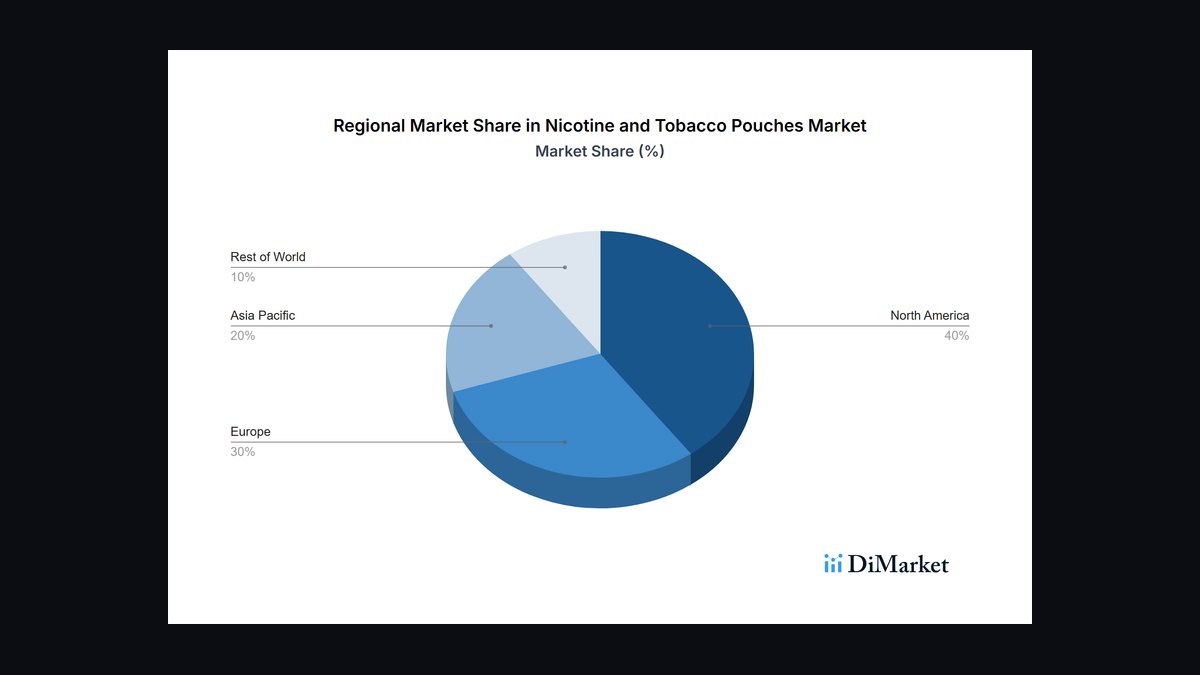
Sixth because tobacco still drives roughly 30% of inside dollar sales for most chains, even as cigarettes decline 5-7% per year in units. Nicotine pouches like Zyn, On!, and Velo grew 40%-plus year-over-year through 2025, carrying higher margin and lower regulatory friction than combustibles. The operating question is the mix shift, not the total.
Built for category managers and compliance teams managing age-gated SKUs and state regulatory exposure. It trades away growth potential, since the category is in secular decline and depends on a shrinking base of adult nicotine users. Ranked below Packaged-Beverage Attach because beverages grow with traffic, while tobacco shrinks with the population.
7Loyalty Member Active Rate
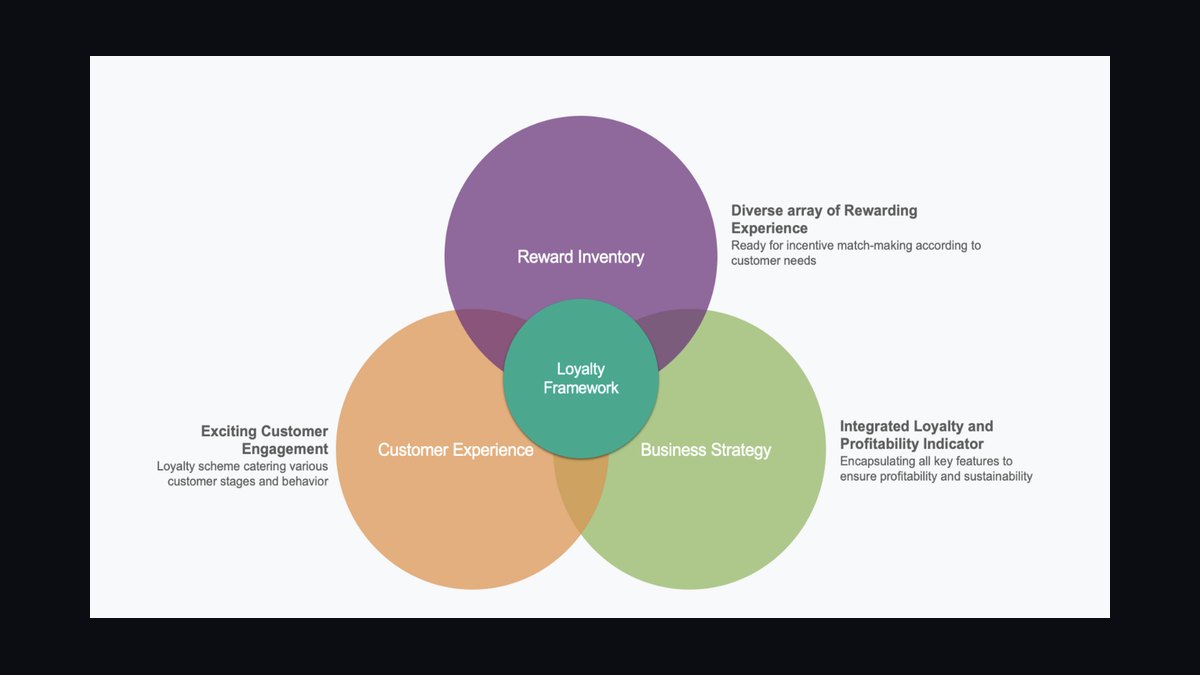
Seventh because it measures whether the loyalty program actually drives repeat visits, not just enrollment. 7Rewards crossed 100M members globally, Casey's Rewards is at 9M-plus active, and mature chains see 40-50% of inside transactions swiped. Active rate on a 90-day window matters more than total enrolled, with best-in-class at 50-60%.
Built for marketing and CRM teams running segmented basket-builder offers. It trades away acquisition vanity, since a program can enroll millions and still stall at 25% active without offer engineering. Ranked below Tobacco Share because loyalty is a multiplier on existing categories, not a category that generates margin on its own.
8EV-Charging Revenue per Site
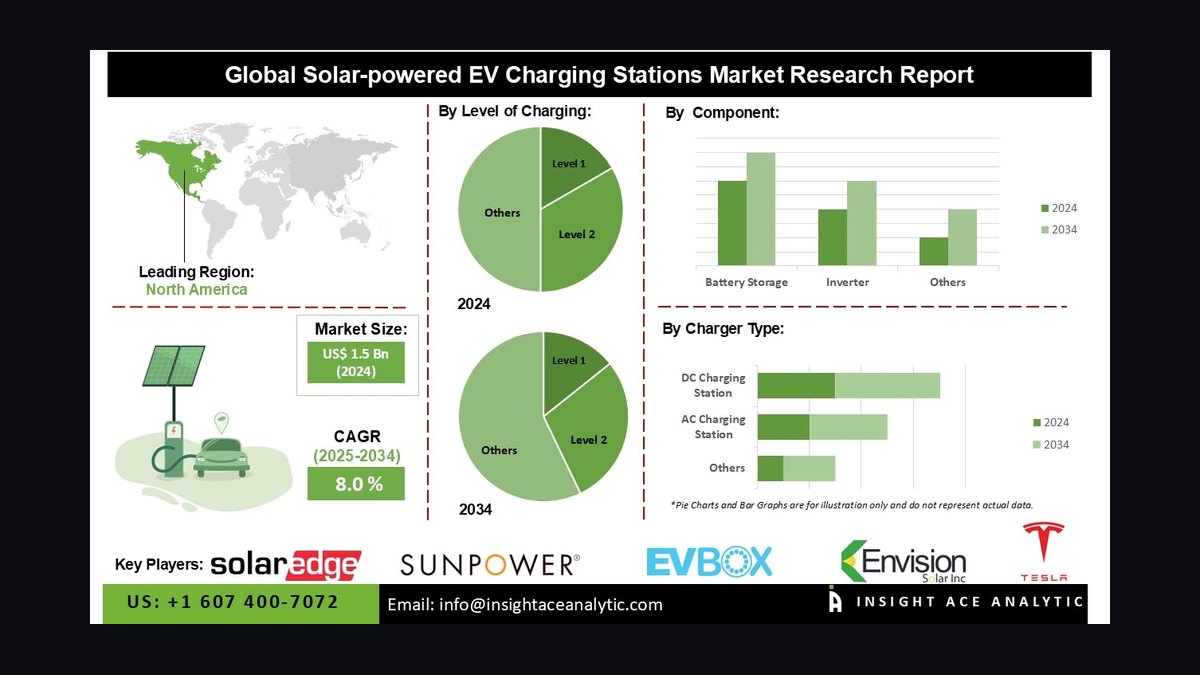
Eighth because it is the forward-looking KPI for the 10-year fuel-volume decay curve. Pilot's GM/EVgo joint venture targets 500 sites by 2027, and Sheetz reported 2 million cumulative charging sessions across 650 chargers in 2026. Per-session economics run $8-25 depending on dwell time and kWh delivered.
Built for strategy and real-estate teams modeling the top 20 candidate sites with traffic and utility-rate inputs. It trades away near-term materiality, since charging revenue is still a small fraction of fuel revenue at most sites. Ranked below Loyalty Active Rate because loyalty drives today's inside ticket, while EV charging is a five-year bet.
9Labor Cost Percent of Total Sales
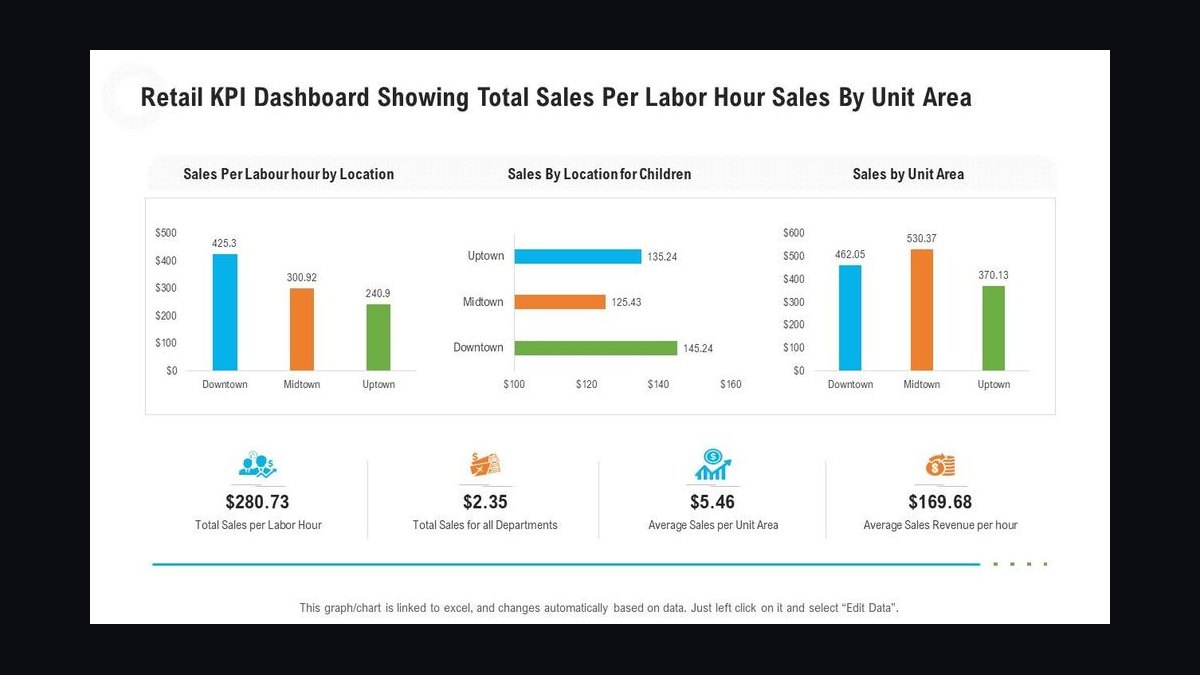
Ninth because labor is the largest controllable expense and the hardest to hold as foodservice expands. Minimum wages are climbing in 30-plus states, and labor as a percent of inside sales has crept from 18-20% to 22-25% at multi-day-part operators. High-foodservice chains like Wawa and Sheetz run 27-30% because their kitchens look more like Chipotle.
Built for operations and HR leaders balancing kitchen staffing against self-checkout deployment. It trades away revenue context, since a low labor percentage can simply mean understaffed stores with dirty restrooms and broken coffee bars. Ranked below EV-Charging Revenue because labor is a cost to be managed, not a growth lever.
10Four-Wall EBITDA per Store

Tenth because it is the bottom-line rollup that converts the other nine KPIs into a single store-level profit number. Monthly four-wall P&L by store captures inside sales, fuel margin, food-service mix, labor, and occupancy in one view. It is the metric boards use to approve new-store pipelines and category resets.
Built for CFOs, private-equity operators, and multi-banner chains comparing unit economics across regions. It trades away daily actionability, since monthly reporting lags the operational decisions that move the number. Ranked last because it is a lagging composite, not a leading indicator operators can pull on tomorrow morning.
How we ranked these
We ranked nine KPIs by weighting four-wall impact, forward-looking relevance to 2027, and data availability from POS, fuel controllers, and back-office systems. In-store sales per store per day and fuel margin per gallon received the heaviest weight because they drive the majority of store-level EBITDA. Food-service mix, loyalty active rate, and EV-charging revenue were weighted for strategic importance to the 2027 transition, while labor cost and beverage attach were weighted for controllability.
We deliberately ignored total company revenue, store-count growth, and market-share metrics because they reward scale rather than per-site productivity and can mask deteriorating unit economics. We excluded ESG scores, customer-satisfaction surveys, and brand-awareness measures since they lack direct linkage to daily operating decisions. We also skipped fuel-volume growth as a standalone KPI because flat industry gallons make share shift, not volume expansion, the real 2027 story.
Related questions
How does in-store sales per store per day compare across major c-store chains?
QuikTrip and Wawa run $12,000-$18,000 per store per day, well above the $5,800-$6,200 industry average reported by NACS. 7-Eleven legacy stores sit closer to $3,500. The gap reflects foodservice depth, urban location density, and loyalty penetration. Operators should benchmark against their own format cohort, not the industry mean, because a rural truck-stop banner and an urban fresh-food concept are not comparable units.
Why is fuel margin per gallon more volatile than inside margin?
Wholesale gasoline prices swing 20-40 cents in a normal month and 80-100 cents in a stressed one. Retailers either hold pump price and compress margin or move price and lose gallons. ARKO posted 48.0 cents per gallon in Q1 2026 versus 38.7 cents a year earlier, a 24% swing driven mostly by crude movement. Always reconcile reported margin to OPIS rack before drawing conclusions.
What food-service mix percentage separates leaders from laggards?
Casey's runs roughly one-third of inside sales through prepared food, and that mix carries 55-60% gross margin versus 30-32% on packaged goods. Industry leaders push toward 30-40% food-service mix; laggards sit at 15-20%. Anything below 20% means the operator is still a packaged-goods retailer, not a foodservice operator, and will struggle as tobacco and fuel margins compress through 2027.
How should operators measure loyalty program health beyond enrollment?
Active rate, defined as members who swiped in the last 90 days, matters far more than total enrolled. 7Rewards crossed 100M members globally, but best-in-class active rate is 50-60%. Casey's Rewards runs 9M+ active members and drives 40-50% of inside transactions at mature chains. If active rate stalls at 25%, the program becomes a coupon dispenser rather than a basket-builder.
What is a realistic EV-charging revenue target per site by 2027?
Per-session economics run $8-25 depending on dwell time and kWh delivered. A site with two to four DC fast chargers can generate $500 to $4,000 monthly, depending on utilization and local utility rates. Sheetz reported 2 million cumulative charging sessions across 650 chargers in 2026. The KPI to watch is dwell-time foodservice attach, since every charging minute is potential inside spend.
How is labor cost percentage shifting as foodservice expands?
Labor as a percent of inside sales has crept from 18-20% to 22-25% at multi-day-part operators as minimum wages climb in 30+ states. High-foodservice chains like Wawa and Sheetz run 27-30% because their kitchens resemble Chipotle more than a traditional c-store. Self-checkout deployment and centralized food prep are the primary offsets. Anything above 30% without corresponding food margin is a structural problem.
Why are nicotine pouches displacing cigarettes in category mix?
Cigarettes are in secular decline at -5 to -7% per year in units, while nicotine pouches like Zyn, On!, and Velo grew 40%+ year-over-year through 2025. Tobacco still drives roughly 30% of inside dollar sales for most chains, but pouches carry higher margin and lower regulatory friction. Operators should track the mix shift weekly and reset planogram facings every 90 days to capture the transition.
What reporting cadence should a c-store chain actually run?
Daily: in-store sales per store, fuel gallons, fuel margin per gallon by site, loyalty swipe rate, labor hours. Weekly: food-service mix, packaged-beverage attach, tobacco and pouch mix shift, waste percentage, out-of-stock percentage. Monthly: four-wall P&L by store, EBITDA per store, fuel-margin reconciliation to OPIS rack, EV-charging revenue per site. Quarterly: category reset performance, loyalty cohort analysis, and EV-transition forecast.
FAQ
How is in-store sales per store per day calculated and why does it matter?
This KPI is total daily in-store revenue divided by the number of stores. It matters because it reveals whether each location covers fixed costs like rent and labor. A healthy range for a mid-size chain is $3,500-$6,000 per day, though high-traffic urban stores can exceed $10,000. It is the single best four-wall productivity metric for comparing sites within a banner.
Why is food-service percentage of in-store sales considered a future-proofing metric?
Food service carries 50-60% gross margin versus 30-35% for center-store items. If this percentage falls below 20-25%, the store relies too heavily on low-margin categories. Leading operators target 30% or more to offset declining tobacco and fuel margins. Casey's inside margin hit 42.4% in fiscal 2026 driven by pizza and prepared food, which run about 33% of inside revenue.
What does motor-fuel gallons per store per day tell you beyond volume?
It is a direct measure of traffic generation and site efficiency. A typical c-store sells 3,000-5,000 gallons per day, but top performers hit 6,000-8,000. Low gallons per store often indicate poor location or weak fuel pricing strategy, which drags down inside sales because fewer customers enter the store. Industry gallons grew only 0.5% in 2025, so share shift matters more than volume expansion.
How does loyalty member active rate percentage impact sales performance?
This measures the percentage of transactions where a loyalty card or app is used. Active loyalty members typically spend 20-40% more per visit and visit 1.5-2 times more often than non-members. A healthy rate is 35-55% of total transactions; below 25% suggests the program is not engaging customers or driving repeat behavior. Active rate, not enrollment, is the operating metric.
What is a realistic EV-charging revenue per site for a convenience store in 2027?
This varies widely by location and charger speed. For a site with two to four DC fast chargers, monthly revenue can range from $500 to $4,000 depending on utilization and local electricity rates. It remains a small fraction of fuel revenue but is growing, and it is critical for future site viability as EV adoption increases. Pilot and EVgo target 500 sites by 2027.
Why is labor cost percentage of total sales a make-or-break KPI for c-stores?
Labor is typically the largest controllable expense, often 10-14% of total sales for well-run stores. If it exceeds 15-16%, margins erode quickly, especially in low-margin fuel operations. The 2027 challenge is balancing adequate staffing for food service, which requires more labor, with keeping this percentage in check. Self-checkout and centralized prep are the primary offsets.
How should operators reconcile fuel margin to OPIS rack pricing?
Reported fuel margin should always be adjusted for OPIS rack movement before drawing conclusions about operational performance. ARKO's 48.0 cents per gallon in Q1 2026 versus 38.7 cents a year earlier was driven mostly by crude price movement, not operational improvement. The CFO question is never what margin was, but what margin was adjusted for wholesale rack movement over the same period.
What is the structural warning line for fuel margin per gallon?
Wholesale-net margin under 30 cents per gallon for two consecutive quarters is the structural warning line. Reported same-store fuel margins ran 40-48 cents in 2025-2026 at ARKO, Casey's, and the public chains. Always report gross and net of credit-card fees, which run 8-12 cents per gallon and can quietly consume a quarter of headline margin at high-price periods.
How often should a c-store chain run a category reset?
Every 90 days is the operating cadence that Couche-Tard, Casey's, and Wawa converged on after 2024. Quarterly resets let operators refresh the packaged-beverage planogram, expand nicotine-pouch facings, and trim slow-moving SKUs using Circana c-store scan data. Waiting longer lets declining categories like cigarettes consume shelf space that pouches, beverages, and foodservice could monetize at higher margin.
What is the biggest mistake operators make when adopting these KPIs?
The biggest mistake is modeling fuel margin at a 40 cents per gallon run-rate when the trailing-12 average is 32 cents, then missing budget every quarter because crude moved. The second mistake is installing a foodservice kitchen without the labor model, throw rates, and waste tracking, which spikes food cost to 38-40% and loses money within twelve months. Baseline before you forecast.
Sources
- https://www.nacsonline.com/Research/Pages/State-of-the-Industry-Report.aspx
- https://www.nacsonline.com/Research/FactSheets/Pages/default.aspx
- https://corporate.couche-tard.com/en/investors/
- https://investor.caseys.com/financial-information/annual-reports
- https://www.7andi.com/en/ir/
- https://investors.arkocorp.com/financial-information/quarterly-results
- https://www.opisnet.com/
- https://www.circana.com/
- https://www.cstoredive.com/
- https://www.cspdailynews.com/
Related on PULSE
This page will be disappearing soon. Save it to your device for $1 — or read it free while it is here.
@Kory-White- · if Venmo asks, the last 4 of my number are 2012
This page is gone.
This one is off the shelf now. $1 keeps it on your phone for good — the whole page, pictures and diagrams included.
 pulse-industry-kpisTop 10 Sales KPIs for Oilfield Services in 2027
 pulse-industry-kpisTop 10 Sales KPIs for Industrial Laser Cutting & Waterjet Job Shops in 2027
 pulse-industry-kpisTop 10 Sales KPIs for Specialty Lumber & Millwork Distribution in 2027
 pulse-industry-kpisTop 10 Sales KPIs for Fast Fashion Apparel in 2027
 pulse-industry-kpisTop 10 Sales KPIs for Commercial Marketing Agency in 2027
 pulse-industry-kpisTop 10 Sales KPIs for Commercial Heavy Truck Dealership in 2027
 pulse-industry-kpisTop 10 Sales KPIs for Commercial Kitchen Hood & Exhaust Cleaning Services in 2027
 pulse-industry-kpisTop 10 Sales KPIs for Industrial Pump Distribution & Service in 2027
 pulse-industry-kpisTop 10 Sales KPIs for Industrial Heat Treating & Metal Finishing Services in 2027
 pulse-industry-kpisTop 10 Sales KPIs for Commercial Crane Rental in 2027