
What's a good leading indicator that pipeline is about to weaken?


The single best leading indicator that pipeline is about to weaken is the median deal age of stage-2 and stage-3 opportunities sitting in the 21-to-45-day-old band. When that median rises by 10 or more days week-over-week for two consecutive Fridays, you are roughly 4 to 6 weeks away from a forecast miss.
Mid-stage age creep is a *flow* signal — it measures how fast real buyers are actually moving — and it leads every other commonly watched metric (pipeline coverage ratios, rep confidence scores, AI deal scores, manager rollups, win rate) by two to three weeks. Everything downstream of it is a confirmation, not a warning.
- Lead time: 4-6 weeks before the miss shows up in the forecast.
- The signal stack, by lead time: mid-stage age creep (6 wks) -> economic-buyer meeting velocity (5 wks) -> no-show rate (4 wks) -> "waiting on prospect" ratio inversion (3 wks) -> forecast category downgrades (2 wks, already too late).
- Do NOT use as primary signals: coverage ratio, activity counts, win rate, rep confidence, raw AI deal scores. All are stock measures or lagging measures.
- Build: a 30-minute Friday dashboard in a sheet against your CRM API. Two reds = pipeline meeting Monday. Three reds = re-forecast and call your CFO first.
- The whole game: catch it in week 2, not week 7. That 5-week buffer is the difference between a managed quarter and a fired CRO.
- The catch: signals are probabilistic, seasonality and process changes pollute them, and PLG motions need a different clock. The dashboard buys reaction time, not certainty.
This entry gives you the full leading-indicator system: the physics of why mid-stage age works, the ranked signal stack, the metrics that are traps, the build instructions for the dashboard, the four documented ways the signal lies, the week-by-week action playbook, and the counter-case for when you should ignore the whole framework.
1. Why Mid-Stage Deal Age Is The Master Signal

1.1 The difference between stock metrics and flow metrics
Most pipeline dashboards measure stock — how much pipeline exists right now. The leading-indicator discipline measures flow — how fast pipeline is *moving*. This distinction is the entire reason most revenue teams get surprised by bad quarters.
- Stock metrics describe the reservoir: Pipeline coverage ratio, total open ACV, deal count, and average deal size all answer "how full is the tank?" They are trivially gameable and they change slowly. A team can carry 4x coverage built entirely of zombie deals and still miss by 30 percent. The tank looks full; the water is stagnant.
- Flow metrics describe the current: Deal age, stage-conversion velocity, meeting-booking rate, and stage-entry counts answer "how fast is water actually moving through the pipe?" When buyers hesitate, flow slows *before* the reservoir visibly drains. That lag is your warning window.
- Mid-stage age is the purest flow metric you have: It is a direct, hard-to-fake measurement of buyer momentum at exactly the point in the funnel where macro hesitation, budget freezes, and competitive losses first register. It is not a proxy. It is the thing itself.
- The reservoir always lies last: By the time coverage ratio drops, the buyers who were going to hesitate already did so weeks ago. You are reading a fossil. Flow metrics read the living animal.
1.2 Why the 21-to-45-day band specifically
Not all open deals carry equal signal. The age band you measure matters more than almost anything else in the methodology.
- Deals 0-20 days old are noise: They are too fresh to have a velocity reading. A deal three days into stage 2 has no meaningful "age" yet — you are measuring the calendar, not the buyer. Including them dilutes the signal with reps' freshly created pipeline, which spikes predictably at quarter starts.
- Deals over 45 days old are mostly fossils: Clari's 2025 pipeline benchmarks show deals stalled past roughly 1.5x the median sales cycle close at under 8 percent (https://www.clari.com/blog/sales-pipeline-management/). These are zombies that should have already been scrubbed. They drag the median around without telling you anything about current demand. Worse, reps hoard them for coverage optics.
- The 21-45 day band is the demand thermometer: It captures buyers who are past first-meeting curiosity but have not yet committed to a formal buying process. This is precisely where buyer hesitation, budget-holder cold feet, and "let's revisit next quarter" first appear. It is also where MEDDPICC qualification and economic-buyer engagement *should* be visible — and if they are not, you have a generation problem wearing a closing-problem costume.
- It is a closing-skill-free zone: Deals 0-20 days are about prospecting skill. Deals near close are about closing skill. The 21-45 day band isolates the variable you actually want: *is the market still buying at the rate it was?*
1.3 The physics of the lead time
Why exactly 4 to 6 weeks, and not 2 or 10? The lead time is a function of how buyer hesitation propagates through the funnel.
- Hesitation starts upstream and invisible: A buyer who is getting nervous about budget does not announce it. They simply take three days longer to schedule the next meeting, loop in one more stakeholder, and ask for "a bit more time to align internally." None of this hits your CRM as a status change.
- Age accumulates that hesitation mechanically: Every extra day a deal waits is one extra day of age. Mid-stage age is the integral of all those small hesitations. It rises smoothly and early because it sums thousands of micro-delays before any single deal flips to closed-lost.
- Forecast categories only move on discrete events: A deal stays in "Commit" until a rep consciously downgrades it. That decision lags the underlying reality by two to three weeks because reps are optimists and downgrading a commit is socially expensive.
- The arithmetic: Hesitation appears -> age rises (week 0) -> meetings slow (week 1-2) -> no-shows climb (week 2-3) -> reps lose deal control (week 3-4) -> commits slip (week 5) -> quarter closes short (week 6-7). Mid-stage age sits at the front of that chain. Forecast category sits at the back.
1.4 The integral analogy — why a smooth metric beats a discrete one
There is a deeper mathematical reason mid-stage age leads. It is worth spelling out because it tells you *which* metrics to trust in general, not just for this one question.
- Discrete metrics step; continuous metrics flow: Forecast category is a discrete, stepwise variable — a deal is in "Commit" or it is not. It changes only when a human makes a decision. Median deal age is a continuous variable that moves a little every single day, whether or not anyone touches the CRM.
- Continuous variables register small inputs: A buyer who slows down by 15 percent does not trigger any discrete event. No deal flips category. No stage changes. But the median age of the cohort drifts upward by a fraction of a day, every day, because the underlying clock never stops.
- The signal is the accumulation: Mid-stage age is effectively the running sum — the integral — of every micro-hesitation across every open deal. Small, distributed, individually invisible delays aggregate into one readable number. This is why it is sensitive: it does not need a single dramatic event to move.
- The general lesson: When you are choosing a leading indicator for *any* business process, prefer the continuously varying flow metric over the discretely changing event metric. The flow metric will always move first because it does not wait for a human to notice and act.
1.5 A worked numerical example
Concreteness beats abstraction. Walk through a single team over six weeks so the mechanics are unambiguous.
- Week 0 — baseline. A 12-rep mid-market team carries 480 open opportunities; 190 sit in the stage-2 21-45 day band. Median age of that band is 27 days. Coverage for next quarter reads 3.8x. Everything green.
- Week 1. Median age ticks to 31 days. One yellow. The VP notes it but, correctly, does not act on a single-week move. Coverage still 3.7x — the reservoir still looks full.
- Week 2. Median age hits 39 days — that is a 12-day rise over baseline, sustained two Fridays. EB-meetings per AE slip from 2.6 to 1.9. Two signals now flashing. This is the moment. The team has a 4-to-6-week buffer.
- Week 3. No-show rate climbs from 8 to 13 percent. The team that acted in week 2 is already diagnosing; the team that ignored it is still admiring 3.5x coverage.
- Week 4. "Waiting on prospect" share inverts from 21 to 34 percent. Coverage finally drops to 2.9x — the reservoir is *now* visibly draining, four weeks after the flow metric warned.
- Week 6. Commits start sliding to Best Case. The quarter is largely set. The team that acted in week 2 re-forecast cleanly and kept its credibility; the team that waited is explaining a 14-percent miss to the board.
The numbers are illustrative, but the *shape* is the lesson: the flow metric (age) moved in week 1-2; the stock metric (coverage) did not visibly move until week 4. Two-to-three weeks of free warning, every time.
2. The Five-Signal Stack, Ranked By Lead Time

Mid-stage age is the master signal, but a single metric can throw a false positive. The professional approach is a stack of five signals ordered by how early they fire. Each one downstream confirms or denies the one above it.
2.1 Signal one: mid-stage age creep — 6-week lead
- The metric: Median age of stage-2 deals (discovery/validation) in the 21-45 day band, snapshotted weekly.
- The baseline: For B2B SaaS with 25,000-to-75,000-dollar ACV, healthy median stage-2 age runs around 28 days, per the Gong 2025 Pipeline Report drawn from an analysis of roughly 3.2 million deals (https://www.gong.io/blog/sales-pipeline/).
- The trigger: A jump to 38-plus days — meaning a 10-plus-day increase — sustained for two consecutive Fridays. Backtests on aggregated 2022-2024 industry data cited in public Clari and Gong reports associate that pattern with a 4-to-7-percentage-point close-rate drop the following quarter at roughly 70 percent reliability.
- The honest caveat: That 70 percent figure is from aggregated cross-industry data, not your specific cohort. Treat it as a prior, not a confidence interval. Calibrate against your own eight-quarter history before you trust the threshold (more on calibration in section 4.5).
2.2 Signal two: economic-buyer meeting velocity — 5-week lead
- The metric: Count of meetings booked with the economic buyer per AE per week. Not "dials," not "connects," not generic "meetings" — meetings with the person who controls the budget.
- The baseline: Pavilion's 2025 revenue-operations benchmarks peg the healthy floor at 2.5 economic-buyer meetings per AE per week for mid-market reps closing 40,000-to-120,000-dollar ACV.
- The trigger: A drop to 1.6 EB-meetings per AE per week. Stage-2 entry rate then craters in roughly 3 weeks; close rate craters in roughly 7.
- The definitional discipline: This signal is worthless if "EB-meeting" is loosely defined. You must instrument it precisely — see (q44) for why vanity activity counts are useless and how to define activity metrics that actually predict revenue, and (q55) to confirm those EB-meetings are genuinely qualifying conversations rather than polite no-decisions.
2.3 Signal three: no-show rate — 4-week lead
- The metric: Percentage of scheduled second-or-later meetings where the buyer does not show.
- The baseline: Pavilion benchmark — 7 to 8 percent no-show is normal, 10 percent is a yellow flag, 12 percent or higher means buyer intent is collapsing.
- The trigger: Sustained no-show above 12 percent. Deals where the buyer ghosts the second meeting typically slip 30 to 45 days before a rep finally marks them closed-lost.
- The data-source rule: Pull no-show from your calendaring and scheduling tool — Chili Piper, Calendly, or Outreach — never from the CRM. Reps can edit CRM fields; calendar accept/decline and attendance events are immutable system records. Use the immutable source.
2.4 Signal four: "waiting on prospect" ratio inversion — 3-week lead
- The metric: Share of open deals whose next-step status is "waiting on prospect" versus "rep-driving."
- The baseline: In healthy pipeline, roughly 20 percent of open deals are "waiting on prospect" and 80 percent are "rep-driving."
- The trigger: When that ratio inverts toward 35/65, your reps have lost control of the buyer journey. This is the canary that close rate is about to fall 4 to 7 points.
- The prerequisite: This signal depends entirely on accurate, current next-step data, which is notoriously hard to get reps to log. See (q42) for the operational mechanics of making next-step hygiene actually stick instead of decaying into stale fields.
2.5 Signal five: forecast category downgrades — 2-week lead, already too late
- The metric: Net movement of deals from "Commit" back to "Best Case" (or lower).
- The baseline: Healthy pipeline shows minimal backward category movement week to week.
- The trigger: When commits start downgrading, you have roughly 10 business days to react before the quarter is set.
- Why it is on the list at all: It is included as the *floor* of the stack — the last warning. CROs who watch *only* this get fired, because forecast-category movement is a downstream confirmation. Forecast accuracy is the number-one trailing red flag scrutinized in CRO interviews precisely because it is so far downstream; see (q22) for how forecast accuracy is evaluated when a CRO's tenure is on the line.
| Signal | Lead time | Metric | Healthy | Trigger | Data source |
|---|---|---|---|---|---|
| Mid-stage age creep | 6 weeks | Median age, stage-2 deals 21-45d | ~28d | +10d, 2 Fridays | CRM stage-entry timestamps |
| EB-meeting velocity | 5 weeks | EB-meetings per AE per week | >=2.5 | <1.8 | Calendar + CRM cross-ref |
| No-show rate | 4 weeks | Second-meeting no-show % | <=8% | >=12% | Calendar tool only |
| "Waiting on prospect" ratio | 3 weeks | % deals waiting vs driving | ~20% | >=31% | CRM next-step field |
| Forecast category downgrades | 2 weeks | Commit-to-BestCase net moves | ~0 | Any sustained negative | CRM forecast category |
2.6 Why a stack beats any single metric
It is tempting to simplify down to "just watch mid-stage age." Resist it. A stack is structurally superior to a solo metric for three reasons.
- Each metric covers a different failure mode of the others: Mid-stage age can be polluted by a stage-definition change. EB-meeting velocity cannot — it is measured off the calendar. No-show rate is immune to CRM editing. When one sensor is compromised, the others stay honest. Redundancy is not waste; it is the design.
- Confirmation reduces false positives: A single age spike might be seasonal noise. An age spike *plus* a meeting-velocity decline *plus* a no-show climb is not noise — it is three independent instruments agreeing. The stack lets you distinguish a real fire from a flickering shadow without waiting for the quarter to end.
- Sequencing tells you how far along the decay is: Because the five signals fire in a known order, *which* signals are red tells you *where* you are in the decay timeline. Only age red? You are six weeks out — plenty of room. Age, meetings, and no-shows all red? You are three to four weeks out — move now. Commits already slipping? You are out of runway. The stack is a clock, not just an alarm.
- It survives instrumentation gaps: Most teams cannot perfectly instrument all five signals on day one. A stack degrades gracefully — three of five working still gives a usable read. A solo metric, if its one data source breaks, leaves you blind.
2.7 Composite scoring — turning five signals into one number
Some teams want a single headline figure for the board. You can build one, carefully.
- Normalize each signal to a 0-100 health score: Map each metric onto its healthy/yellow/red bands — green = 100, yellow = 50, red = 0, with linear interpolation between band edges.
- Weight by lead time and reliability: Give mid-stage age the heaviest weight (say 35 percent) because it leads earliest and is best-validated. EB-meeting velocity 25 percent, no-show 15 percent, waiting-ratio 15 percent, forecast-category 10 percent.
- Publish the composite, but never hide the components: The composite is a communication tool for the board. The components are the diagnostic tool for the operators. If a leader ever acts on the composite alone without inspecting which signal dragged it down, the score has become a Goodhart trap of its own.
- Re-check the weights quarterly: If your calibration work (section 4.5) shows no-show is a better predictor than the waiting ratio for your specific motion, re-weight. The weights are local, the structure is universal.
| Signal | Suggested weight | Rationale for weight |
|---|---|---|
| Mid-stage age creep | 35% | Earliest lead, best public validation |
| EB-meeting velocity | 25% | Strong lead, immune to CRM editing |
| No-show rate | 15% | Immutable calendar source, mid lead |
| "Waiting on prospect" ratio | 15% | Good lead, but depends on field hygiene |
| Forecast category downgrades | 10% | Confirmation only, near-zero lead |
3. What NOT To Use As Your Leading Indicator

Half the discipline of leading indicators is refusing to be fooled by the metrics that *look* predictive but are not. Each of the following is a common trap.
3.1 Pipeline coverage ratio (3x, 4x)
- What it is: Total open pipeline ACV for a period divided by the quota for that period.
- Why it fails as a primary signal: It is a stock measure, not a flow measure. Coverage tells you how full the tank is, not whether the water moves. A team can show a comfortable 4x coverage built entirely of stalled zombie deals and still miss by 30 percent.
- How to actually use it: As a *secondary* confirmation only. If mid-stage age is rising *and* next-quarter coverage is thin, that is corroboration. Coverage alone, watched as a headline number, is a comfort blanket.
3.2 Activity counts (calls, emails, dials)
- What they are: Raw tallies of outbound touches per rep per day or week.
- Why they fail: Goodhart's Law in its purest form — when a measure becomes a target, it stops being a good measure. Reps optimize whatever you count. Dial counts inflate without a single additional dollar of economic outcome.
- The fix: Measure *outcome-bearing* activity — EB-meetings, qualified-opportunity creation — not effort. The distinction is the entire subject of (q44).
3.3 Win rate alone
- What it is: Deals won divided by deals closed in a period.
- **Why it fails as a *leading* indicator:** Win rate only moves *after* deals close. It is definitionally a lagging metric. By the time it shifts, the quarter that produced the shift is already over.
- Where it belongs: In retrospective cohort analysis and rep coaching, not in an early-warning dashboard.
3.4 Rep confidence scores
- What they are: Self-reported rep estimates of deal likelihood or pipeline health.
- Why they fail: Self-reported confidence has near-zero predictive value over a six-week horizon. It tracks the rep's *current mood and recent call outcomes*, not the structural health of the funnel. It is also subject to sandbagging at quarter start and happy-ears optimism mid-quarter.
- The nuance: Confidence is mildly useful at the *individual deal* level when paired with a hard qualification framework, but as an *aggregate pipeline-health* signal it is noise.
3.5 AI deal-scoring tools used without human review
- What they are: Predictive scores from Clari, Gong, Aviso, and similar platforms.
- Why raw scores fail: These models ingest the same CRM data your reps just finished editing. If the underlying field hygiene is poor, the model is confidently wrong. They also tend to lag, because they are trained on closed-deal history.
- How to use them well: As a *tiebreaker* and a *deal-inspection prioritizer*, not as the primary signal. An AI score that disagrees with a manager's read is a prompt to inspect the deal, not a verdict. The human-plus-model loop beats either alone.
| Trap metric | Category | Failure mode | Correct role |
|---|---|---|---|
| Pipeline coverage ratio | Stock | Zombies inflate it | Secondary confirmation |
| Activity counts | Effort | Goodhart gaming | Replace with outcome metrics |
| Win rate | Lagging | Moves only post-close | Retrospective coaching |
| Rep confidence | Self-report | Tracks mood, not structure | Deal-level color only |
| Raw AI deal scores | Derived | Same dirty CRM input | Tiebreaker, inspection prompt |
3.6 The deeper pattern — Goodhart's Law and the gaming reflex
Every trap in this section shares a root cause worth naming explicitly, because once you see it you can spot new traps yourself.
- Goodhart's Law restated: "When a measure becomes a target, it ceases to be a good measure." The moment a metric drives compensation, promotion, or a Monday-morning grilling, the people measured by it begin to optimize the *number* rather than the *thing the number was supposed to represent*.
- Activity counts are the canonical victim: Tell a rep their job is 60 dials a day and you will get 60 dials a day — many of them to bad numbers, voicemails, and disconnected lines. The dial count rises; the revenue does not. The metric measured effort, the rep delivered the appearance of effort.
- CRM-editable fields are gameable by construction: Any field a rep can change to look better — close date, stage, forecast category, deal amount — will drift toward whatever the rep believes leadership wants to see. This is not dishonesty so much as rational response to incentives.
- The defense is immutability and outcome-orientation: Prefer metrics drawn from sources reps cannot edit (calendar attendance, email-send logs, call recordings) and metrics that measure *outcomes* (an EB-meeting actually happened) rather than *effort* (an EB-meeting was attempted). Mid-stage age is relatively gaming-resistant because faking it requires a rep to *also* fake the stage-entry timestamp, which leaves an audit trail in the stage-history object.
- The cultural half of the defense: No metric design survives a culture that punishes honest bad news harder than dishonest good news. Section 9.2 returns to this. The cleanest dashboard in the world reports garbage if the team has learned that accurate pessimism gets them grilled.
3.7 A note on AI deal scoring — useful, but know its blind spot
AI scoring deserves more than a one-line dismissal, because it is genuinely useful when positioned correctly.
- What it does well: Modern revenue-intelligence models are excellent at *prioritizing inspection*. Given 300 open deals, an AI score that flags the 30 most-at-risk is a real time-saver for a manager who cannot inspect all 300.
- What it cannot do: It cannot lead, because it is trained on closed-deal history and fed live CRM data that reps just edited. It is a sophisticated reflection of the recent past plus the current (possibly dirty) state. If the macro environment shifts, the model has no training data for the new regime until deals close in it.
- The correct mental model: Treat the AI score the way a doctor treats a screening test — a prompt to look closer, never a diagnosis. An AI score that disagrees with an experienced manager's read is the *most* valuable output, because the disagreement is exactly where a human should spend inspection time.
- The failure mode to avoid: Leaders who let the AI score *replace* the human deal review. The score lulls them into skipping the live deal walk-through that section 6.1 makes central. The model plus the human beats either alone; the model instead of the human is worse than the human alone.
4. Building The Friday 30-Minute Dashboard

The entire system is operationally cheap. It is a sheet, a CRM API call, and 30 minutes every Friday afternoon. The cost is trivial; the payoff is the quarter.
4.1 The architecture
- The data layer: A scheduled query against your CRM API — Salesforce REST or Bulk API, or HubSpot v3 — pulling open opportunities with stage, stage-entry timestamps, owner, and forecast category.
- The compute layer: A Google Sheet, an Airtable base, or a lightweight notebook. You do not need a data warehouse for this. The whole point is that any RevOps analyst can stand it up in an afternoon.
- The display layer: A single conditional-formatted table — green/yellow/red — that a CRO can read in 90 seconds. If it takes longer than 90 seconds to read, you over-built it.
- The cadence: Run every Friday at 5pm, after the selling week is fully logged but before the weekend resets everyone's memory.
4.2 The dashboard itself
| Metric | Healthy (green) | Watch (yellow) | Alarm (red) |
|---|---|---|---|
| Median age, stage-2 deals (21-45d band) | <=30d | 31-37d | >=38d |
| EB-meetings per AE per week | >=2.5 | 1.8-2.4 | <1.8 |
| No-show rate (calendar source) | <=8% | 9-11% | >=12% |
| "Waiting on prospect" deal share | <=22% | 23-30% | >=31% |
| Stage-2 entry count vs trailing-4-week avg | +/- 10% | -11% to -25% | < -25% |
| Net-new-logo pipeline coverage (next quarter) | >=3.5x | 2.5-3.4x | <2.5x |
4.3 The trigger rules — decision logic, not a wall of numbers
A dashboard with no decision rules is just decoration. Pre-commit to the actions so you do not negotiate with yourself in the moment.
- One red, single week: Note it. No action. Single-week reds are often noise.
- Two reds in one Friday's snapshot: Pipeline meeting Monday morning. Bring deal-level data, not opinions.
- Three reds in one snapshot: Re-forecast and call your CFO *before* they call you. Owning the number is a credibility event; getting caught is a firing event.
- One red sustained four consecutive weeks: This is systemic, not seasonal. Dig into segment-level splits — see (q88) for how segment cuts typically reveal that weakness shows up mid-market-first before it spreads.
4.4 The query skeleton
The core measurement is a median (50th percentile) of deal age within the band. A Salesforce-flavored skeleton:
SELECT PERCENTILE_CONT(0.5) WITHIN GROUP (ORDER BY DATEDIFF(day, StageEnteredDate, GETDATE())) AS median_age FROM Opportunity WHERE StageName IN ('Discovery','Validation') AND IsClosed = false AND StageEnteredDate >= DATEADD(day, -45, GETDATE()) AND StageEnteredDate <= DATEADD(day, -21, GETDATE()) GROUP BY OwnerId
Run it every Friday at 5pm. Snapshot the result into a dated row. Compare it to the same Friday of the prior quarter, not the prior week — week-over-week comparisons are corrupted by quarter-cycle seasonality (section 5.1).
4.5 Calibration — make the thresholds yours
The 28-day baseline and the +10-day trigger are industry priors. Before you trust them, calibrate.
- Pull eight quarters of history: Reconstruct the weekly median-age series for the last two years from your CRM's stage-history object.
- Mark the misses: Flag every quarter you missed forecast and walk the series backward. Where was median age 5-6 weeks before each miss?
- Set your own band: Your healthy median might be 22 days or 35 days depending on ACV, motion, and segment. The *shape* of the rule — a sustained relative rise — is universal; the absolute numbers are local.
- Re-calibrate annually: Sales cycles drift. A threshold set in 2024 may be wrong by 2026. Treat calibration as a yearly RevOps ritual.
4.6 Common build mistakes and how to avoid them
Most failed leading-indicator dashboards fail for the same handful of reasons. Pre-empt them.
- Mistake one — using mean instead of median. A single 400-day zombie deal will drag the *mean* age wildly while the *median* barely moves. Always use the median (the 50th percentile). The mean is corrupted by exactly the outliers you should be excluding anyway.
- Mistake two — forgetting the age-band filter. If you compute median age across *all* open stage-2 deals rather than just the 21-45 day band, fresh deals dilute the signal at quarter starts and zombies inflate it at quarter ends. The band filter is not optional; it is the heart of the method.
- Mistake three — week-over-week comparison. Comparing this Friday to last Friday bakes in quarter-cycle seasonality. Always compare to the same week of the prior quarter and prior year. This single error causes more false alarms than any other.
- Mistake four — pulling no-show from the CRM. The CRM no-show field is rep-editable and therefore optimistically wrong. Pull attendance from the calendar or scheduling tool, which records immutable accept/decline/attend events.
- Mistake five — over-building the display. A dashboard with 25 metrics and four nested tabs will not be read. The six-row table in section 4.2 is deliberately the whole thing. A CRO should absorb it in 90 seconds. If yours takes longer, cut rows.
- Mistake six — no snapshot history. If you overwrite the numbers each week instead of appending a dated row, you cannot do same-week-prior-quarter comparison and you cannot calibrate. The snapshot history *is* the asset; the current week is just the newest row.
4.7 Segmentation — the same dashboard, sliced
The headline dashboard is the company roll-up. The diagnostic power comes from slicing it.
- By segment: Run the six metrics separately for SMB, mid-market, and enterprise. Weakness almost always appears in one segment first — see (q88) for the pattern that mid-market typically softens before SMB or enterprise.
- By rep and by manager: A team-level yellow can be one struggling rep dragging an otherwise healthy team, or it can be uniform softness. The two demand completely different responses — coach the individual versus re-forecast the team. Only the per-rep slice tells you which.
- By product line: In a multi-product company, one product's pipeline can rot while another's thrives. A blended number hides this entirely.
- By lead source: If inbound pipeline is aging while outbound holds steady, the problem is upstream in demand generation, not in selling. The source slice points the finger at the right team.
- The discipline: Look at the roll-up first for the alarm, then immediately slice to localize. An alarm with no localization is anxiety; an alarm plus a localized cause is an action.
| Slice dimension | What it reveals | Typical action if isolated |
|---|---|---|
| By segment | Which market tier is softening first | Re-forecast that segment, hold others |
| By rep / manager | Individual struggle vs systemic softness | Coach the rep, or re-forecast the team |
| By product line | Which product's demand is rotting | Marketing and product review for that line |
| By lead source | Whether the gap is gen vs selling | Escalate to demand gen, or to sales |
| By deal size band | Whether large or small deals are stalling | Adjust deal-desk and discount strategy |
5. The Bear Case — Four Documented Ways The Signal Lies

This framework is genuinely useful, but it is not magic. The signal lies in at least four well-documented situations. Misreading these is exactly how a revenue leader cries wolf, burns credibility, and then gets ignored when the *real* warning fires.
5.1 Seasonality masking
- The trap: Median age naturally rises 8 to 12 days in the first two weeks of any quarter. New pipeline backloads, and the end-of-quarter pull leaves a thinner, older mid-stage cohort. The same distortion appears post-Labor-Day and through December.
- Why it fools people: A raw week-over-week delta in those windows looks exactly like genuine weakness. Alarm on it and you cry wolf on a calendar artifact.
- The fix: Compare to the *same week of the prior quarter* and the *same week of the prior year*. Use a 13-week rolling z-score instead of a naive delta, so the metric is judged against its own seasonal pattern.
5.2 Process-change pollution
- The trap: Any change to stage definitions, MEDDPICC scoring rules, or stage-entry criteria pollutes the time-series for 6 to 8 weeks. If RevOps just retrained the team on stricter stage-2 entry criteria, age will spike — because reps are now (correctly) slowing down to qualify properly.
- Why it fools people: A *good* change shows up as a *bad* number. You would be punishing the team for improving rigor.
- The fix: Any time you change stage definitions, freeze the leading-indicator dashboard for a full 8 weeks and rebuild the baseline afterward. Do not act on age signals during that dead zone. This is also why you should batch process changes rather than tinkering continuously.
5.3 PLG and hybrid-led motions run a different clock
- The trap: If self-serve trials feed a sales-assist motion, the "deal age" clock starts when the trial converts to an opportunity, not when a buyer first hesitates. A deal sitting 30 days in the 21-45 band might just be a happy buyer expanding usage on their own.
- Why it fools people: The dashboard above is built for AE-led, meeting-driven motions. Applied blindly to PLG, it generates false alarms on healthy product-led expansion.
- The fix: For PLG and hybrid motions, track weekly active users in the trial cohort and product-qualified-account (PQA) age instead of opportunity age. The leading indicator becomes "is trial-cohort engagement decaying?" not "is deal age rising?"
5.4 Survivorship bias in the dataset
- The trap: If you only measure deals *currently open*, you miss the deals reps quietly closed-lost without flagging the underlying weakness. Median age of open deals can stay perfectly flat while reps purge weak pipeline early.
- Why it fools people: The dashboard looks green while the funnel is actually draining. The scrubbing *is* the weakness, and you have filtered it out of view.
- The fix: Include deals closed-lost in the prior 30 days when computing median age, and add a "pipeline coverage decay rate" column — total qualified pipe today versus four weeks ago. If coverage is dropping while median age is stable, reps are silently scrubbing. That is itself a red.
5.5 The meta-risk: signals are probabilistic, not deterministic
- The hard truth: Even teams watching every signal in this stack missed forecast by 15 to 20 percent during the 2023-2024 macro shocks. Bessemer's 2026 State of the Cloud report documents how a buyer freeze can hit faster than the six-week lead window (https://www.bvp.com/atlas/state-of-the-cloud-2026).
- Lead-window collapse: Crunchbase's 2025 venture-funding data shows that during rate-hike cycles, deal-cycle elongation compressed from a normal six-week tell to a roughly two-week tell (https://news.crunchbase.com/). When macro moves fast, the warning window shrinks.
- The implication: The dashboard buys you *reaction time*, not *certainty*. If you have a five-week buffer and do not act, you did not "wait for confirmation" — you wasted the signal.
- The correct posture: Treat the framework as a smoke detector. A smoke detector does not guarantee no fire; it guarantees you hear about the fire while you can still do something. Section 7 covers the case for sometimes ignoring it entirely.
| Lie scenario | Symptom | Root cause | Fix |
|---|---|---|---|
| Seasonality masking | Age spikes weeks 1-2 of quarter | Pipeline backloading | Same-week-prior-quarter comparison, z-score |
| Process-change pollution | Age spikes after a stage retrain | Reps qualifying harder | Freeze dashboard 8 weeks, rebuild baseline |
| PLG clock mismatch | Aged deals that are healthy | Wrong clock-start event | Track PQA age and trial WAU instead |
| Survivorship bias | Green dashboard, draining funnel | Silent rep scrubbing | Include closed-lost; add coverage decay column |
| Lead-window collapse | Signal fires too late to act | Macro shock outpaces funnel | Treat as smoke detector, not crystal ball |
5.6 The credibility cost of crying wolf
The reason the bear case matters is not academic. Every false alarm has a real, compounding cost.
- Alarms are credibility withdrawals: The first time a CRO calls a pipeline meeting and the "weakness" turns out to be quarter-start seasonality, the team rolls its eyes a little. The third time, the team stops taking the dashboard seriously. The alarm system only works if its alarms are believed.
- The asymmetry: A missed *real* signal costs you a quarter and possibly your job. A *false* signal costs you a chunk of organizational credibility and a wasted Monday. Both are expensive. The discipline of section 5 — seasonality adjustment, process-change freezes, survivorship correction — exists to keep the false-positive rate low enough that the true positives are still believed.
- The two-Friday rule is a false-positive filter: Requiring the signal to sustain for two consecutive Fridays before acting deliberately trades a little lead time for a large reduction in false alarms. A one-week spike is often noise; a two-week sustained move rarely is. That trade is correct.
- Document your false positives too: When an alarm turns out to be seasonal or process-driven, write it down. Over a few quarters this builds an institutional memory of your specific noise patterns, which tightens future calibration. Teams that only record the hits never learn their own noise floor.
5.7 When the signal lies in the optimistic direction
Section 5 mostly covers false *positives* — the signal screaming when nothing is wrong. The rarer and more dangerous failure is the false *negative*: the dashboard reads green while the funnel is actually rotting.
- Silent scrubbing (covered in 5.4): Reps quietly closing-lost weak deals keeps the open-deal median flat. The fix — including recent closed-lost and tracking coverage decay — is the single most important defense against a falsely green board.
- Stage-skipping: A rep who pushes a barely-qualified deal straight into late stage to flatter their forecast resets its age clock and removes it from the mid-stage band entirely. Watch for an unusual rate of stage-2-to-stage-4 jumps; they hide aging deals from the very band that measures them.
- Quarter-end pull distortion: In the final two weeks of a quarter, the mid-stage cohort thins as deals are pulled forward to close. A thin cohort can read deceptively healthy because only the strongest deals remain. Always interpret the last two weeks of any quarter with that distortion in mind.
- The meta-rule: A green dashboard is only trustworthy if you have actively defended against these optimistic lies. An unaudited green is not reassurance — it is the absence of information.
6. The Action Playbook — What To Do When Two Reds Appear

A signal with no playbook is a source of anxiety, not advantage. When two reds appear in a single Friday snapshot, run this four-week sequence. The whole point is to act in week 2 of weakness, not week 7.
6.1 Week 1 — Diagnose
- Pull the deals: Take 10 deals from each red category. Do not theorize; look at actual opportunities.
- Walk them live with the AEs: Have reps narrate each deal. You are hunting for a *modal failure cause* — the single most common reason deals are stalling.
- Look for patterns: Is the same competitor showing up? The same persona dropping out of the buying group? The same vertical going quiet? A budget objection repeating verbatim?
- Document the modal cause in one sentence. "Mid-market manufacturing deals are stalling because the economic buyer is deferring to a Q3 budget review." That sentence drives every subsequent decision.
6.2 Week 2 — Reallocate
- Shift outbound capacity: Re-allocate 20 to 30 percent of AE outbound time to net-new pipeline generation. You are refilling the front of the funnel before the gap arrives.
- Pause low-yield plays: Suspend low-probability account-expansion motions that are consuming time without near-term return.
- Brief the CS team: Have CSMs flag at-risk renewals early so churn does not compound the new-business gap.
- Refresh the competitive playbook if a competitor pattern emerged: Rework discovery and value framing — see (q67) for the "their solution does not do X that matters to you" displacement framing that resets a competitive deal.
6.3 Week 3 — Pre-position with finance and the board
- Talk to the CFO: Discuss discount-authority bands and deal-desk staffing for quarter-end. Share the dashboard, the diagnosis, and the planned interventions.
- Pre-position the board: If the diagnosis suggests a real miss is possible, the board chair should hear it from you, calmly, in week 3 — not discover it in the quarterly miss.
- Reinforce front-line coaching: The managers running pipeline reviews are your early-warning amplifiers. Make sure they are inspecting deals well enough to surface weakness — see (q33) for what good front-line pipeline-review coaching looks like.
6.4 Week 4 — Re-forecast publicly
- Re-forecast on the record: Teams that re-forecast at week 4 of observed weakness retain roughly 70 percent of leadership credibility. Teams that wait until week 7 lose the CRO seat. Median CRO tenure is now around 17 months and falling, per Gartner's 2025 sales-leadership research (https://www.gartner.com/en/sales/research).
- Use the framing that lands with boards: "Here is what we saw at week 2. Here is what we did at week 3. Here is the new number. Here is exactly why I have confidence in it." That sequence converts a miss from an indictment into evidence of a functioning operating system.
- The core principle: The teams that survive down quarters caught the signal in week 2. The five-week buffer between mid-stage age creep and the forecast miss is the entire game. Spend it.
| Week | Phase | Primary action | Owner | Output |
|---|---|---|---|---|
| 1 | Diagnose | Live-review 10 deals per red category | CRO + AEs | One-sentence modal failure cause |
| 2 | Reallocate | Shift 20-30% outbound to net-new gen | Sales managers | Refilled top-of-funnel, paused low-yield plays |
| 3 | Pre-position | Brief CFO and board chair | CRO | Aligned discount bands, no surprises |
| 4 | Re-forecast | Publicly restate the number | CRO | New forecast, retained credibility |
6.5 Diagnosis depth — separating the three root causes
Week 1 diagnosis is only useful if it correctly identifies *which kind* of weakness you have. There are three, and they demand opposite responses.
- Generation weakness — the funnel is not being fed. Symptom: stage-2 entry counts down, EB-meeting velocity down, but the deals that *do* exist are converting fine. Cause: marketing demand soft, or reps under-prospecting. Wrong response: coaching closing skills. Right response: refill the top of the funnel, escalate to demand gen.
- Conversion weakness — the funnel is full but stuck. Symptom: entry counts steady, but mid-stage age rising and waiting-ratio inverting. Cause: buyers hesitating, qualification too loose, competitive losses. Right response: tighten qualification (see (q55)), refresh competitive framing (see (q67)), inspect deals harder.
- Hygiene weakness — the data is lying, not the funnel. Symptom: signals contradict each other, or the numbers moved right after a CRM process change. Cause: dirty data, stage-skipping, stale next-step fields. Right response: fix the instrumentation before trusting any signal (see (q42)).
- The diagnostic question: For each red category, ask "is this fewer deals, slower deals, or worse data?" Misdiagnosing generation weakness as conversion weakness wastes the entire five-week buffer on the wrong intervention.
6.6 What good looks like after the playbook runs
The playbook is judged by outcomes, not activity. After a clean run you should see:
- A re-forecast that holds. The number you restated in week 4 should be within a few points of the actual quarter close. A re-forecast that itself misses badly means the diagnosis was wrong.
- Front-of-funnel recovery. The outbound reallocation from week 2 should show up as stage-2 entry counts recovering toward the trailing-4-week average within 3-4 weeks.
- No board surprise. The board heard the number evolve. The quarterly review is a confirmation of what they already knew, not a revelation. That is the credibility win.
- A documented post-mortem. What did the signal catch, how early, what intervention worked, what would you change? This feeds the next calibration cycle and turns a hard quarter into institutional learning.
7. Counter-Case — When To Ignore This Framework Entirely

A genuinely useful methodology has to be honest about its own boundary conditions. Here are the situations where the disciplined move is to *not* run this system, or to run a different one.
7.1 You do not have enough deal volume for a stable median
- The problem: A median is only meaningful with a reasonable sample. If a rep or segment carries 6 open mid-stage deals, the "median age" jumps wildly when a single deal closes or enters.
- The threshold: Below roughly 30-40 deals in the 21-45 day band, the metric is statistically too noisy to drive Monday-morning decisions.
- The alternative: For low-volume, high-ACV enterprise motions (think 6-figure-plus deals, single-digit deal counts per rep per quarter), abandon statistical signals and run deal-by-deal inspection with MEDDPICC and mutual action plans. The unit of analysis is the deal, not the distribution.
7.2 You are a pure enterprise or strategic-accounts motion
- The problem: Enterprise deals have 9-to-18-month cycles and idiosyncratic, multi-threaded buying processes. A 10-day age move is within the normal variance of a single procurement delay.
- The alternative: Track *stakeholder engagement breadth* (number of contacts active in the buying group), *mutual-action-plan adherence*, and *executive-sponsor meeting recency*. These are the enterprise leading indicators; aggregate age is not.
7.3 You just changed the motion and have no clean baseline
- The problem: New segment, new product line, new sales motion, post-merger integration, or a leadership-driven re-org all destroy the historical baseline the signal depends on.
- The alternative: For the first 1-2 quarters, instrument the data but do not alarm on it. You are *building* the baseline, not reading it. Acting on an uncalibrated signal generates false positives and trains the team to ignore the dashboard.
7.4 The macro signal is already screaming louder than your funnel
- The problem: During an acute macro shock — a rate-hike shock, a sector-wide funding freeze, a black-swan event — the buyer freeze can outrun the six-week funnel lead. The dashboard becomes a confirmation, not a warning.
- The alternative: When public signals (Bessemer State of the Cloud commentary, Crunchbase funding-volume collapse, your customers' own earnings calls) are already flashing red, do not wait for your internal median to confirm. Act on the macro read directly and treat the funnel dashboard as a secondary instrument.
7.5 The honest synthesis
- The framework is a smoke detector, not an oracle. It is genuinely excellent at one job: giving a velocity-driven, mid-market-to-mid-enterprise SaaS team a 4-to-6-week head start on a forecast miss.
- It is a poor fit for pure enterprise, very-low-volume, brand-new, or macro-shock-dominated situations. Forcing it onto those contexts produces false alarms and erodes the credibility you will need when a real signal fires.
- The meta-skill is knowing which instrument to read. The leading-indicator dashboard, deal-by-deal inspection, and macro-signal monitoring are three different instruments for three different flight conditions. A mature revenue leader switches between them deliberately.
8. Real-World Practitioners And Tooling

8.1 Vendors and what they actually measure
- Clari: Pioneered the "pipeline inspection" category; its public benchmarks on stalled-deal close rates (https://www.clari.com/blog/sales-pipeline-management/) are a useful industry prior. Strength: time-series pipeline snapshots. Watch-out: its AI scores ingest the same CRM data your reps edit.
- Gong (and the broader revenue-intelligence category): Its 2025 Pipeline Report, drawn from millions of analyzed deals (https://www.gong.io/blog/sales-pipeline/), is the source of the ~28-day stage-2 baseline. Strength: conversation data that is harder to game than CRM fields.
- Salesforce (NYSE: CRM): The system of record most of these dashboards query. Its stage-history and forecast-category objects are the raw material for the median-age calculation.
- HubSpot (NYSE: HUBS): The mid-market equivalent; its v3 API exposes the same deal-stage timestamps needed for the dashboard.
- Pavilion: The revenue-leadership community whose 2025 ops benchmarks supply the EB-meeting and no-show floors used throughout this entry.
- Aviso and similar forecasting platforms: Useful as tiebreakers in deal inspection; not a substitute for a flow-metric dashboard.
8.2 The build-versus-buy decision
- Build it in a sheet: Costs an afternoon of RevOps time and 30 minutes a week thereafter. Right answer for most teams under roughly 50 reps. Total transparency, total control of thresholds.
- Buy a platform: Justified when you have many segments, need automated alerting, and have the budget. The risk is that a bought tool's default scores lull leaders into skipping the human deal review.
- The hybrid: Buy the revenue-intelligence platform for conversation data and inspection, but keep the flow-metric dashboard in a sheet you fully control. Never outsource your understanding of the master signal.
| Tool | Public ticker | Best-fit use | Watch-out |
|---|---|---|---|
| Salesforce | NYSE: CRM | System of record, query source | Fields editable by reps |
| HubSpot | NYSE: HUBS | Mid-market system of record | Same editability caveat |
| Clari | Private | Pipeline time-series, benchmarks | AI scores lag dirty data |
| Gong | Private | Conversation data, deal signals | Best as inspection, not headline metric |
| Aviso | Private | Forecast tiebreaker | Not a flow-metric substitute |
| Google Sheets + CRM API | n/a (Alphabet, NASDAQ: GOOGL) | The 30-minute Friday dashboard | Requires disciplined weekly cadence |
9. Putting It All Together — The Operating Rhythm

9.1 The weekly rhythm
- Friday 5pm: Run the query, snapshot the dashboard, apply the trigger rules. 30 minutes.
- Monday 9am (only if triggered): Pipeline meeting with deal-level data. No meeting if zero or one red.
- Monthly: Review the segment-level splits and confirm no process change has polluted the baseline.
- Quarterly: Re-calibrate thresholds against the most recent eight quarters of history.
9.2 The cultural prerequisite
- The dashboard is only as honest as the CRM: Every signal depends on reps logging stage entries and next steps accurately. Field hygiene is not a data-entry chore; it is the sensor array. See (q42) for how to make next-step hygiene actually stick.
- Leaders must not punish the messenger: If a rep who logs a deal honestly as "waiting on prospect" gets grilled harder than a rep who keeps it falsely in "rep-driving," you have trained your sensor array to lie. Reward accurate pessimism.
- Pre-commit to the trigger actions: Decide the playbook *before* the reds appear. In-the-moment, optimism and politics will talk you out of acting. The pre-commitment is the discipline.
9.3 The first 30 days — a rollout sequence
If you are standing this system up from scratch, do not try to instrument all five signals perfectly on day one. Sequence it.
- Days 1-5: Stand up the mid-stage age query against your CRM API. Snapshot it once. You now have the master signal, even if it is the only one.
- Days 6-15: Add EB-meeting velocity from the calendar cross-reference and no-show rate from the scheduling tool. Three of five signals live.
- Days 16-25: Reconstruct eight quarters of historical median age from the stage-history object and run the calibration in section 4.5. Set *your* thresholds, not the generic ones.
- Days 26-30: Add the waiting-ratio and forecast-category rows, wire up conditional formatting, and run the first full Friday snapshot with trigger rules attached.
- The principle: A partial dashboard running this Friday beats a perfect dashboard running next quarter. The master signal alone, watched honestly, already gives you most of the value.
9.4 Frequently mishandled edge cases
A few situations come up often enough to pre-answer.
- A rep goes on leave or leaves the company. Their open deals get reassigned and re-aged or re-stamped, which can spike or crater your median artificially. Flag rep transitions and exclude or annotate the affected cohort for that week.
- A large deal closes mid-week. Removing one big, old deal from the band can drop the median noticeably. This is real movement, not noise — but make sure the drop is a close, not a silent scrub.
- A fiscal year that does not match the calendar. All the seasonality logic in section 5.1 keys off *your* quarter boundaries, not the calendar's. If your fiscal year starts in February, your "quarter-start backloading" distortion starts in February.
- A pricing or packaging change. New pricing changes deal sizes and cycle lengths. Treat it like a process change (section 5.2): freeze the dashboard, rebuild the baseline.
9.5 The one-sentence version
If you remember only one thing: watch the median age of your mid-stage deals in the 21-to-45-day band; when it rises 10-plus days for two straight Fridays, you have a 4-to-6-week warning, and the entire job is spending that buffer instead of wasting it.
Pipeline health is not a feeling, a coverage ratio, or an AI score. It is a flow measurement, taken weekly, compared to the right baseline, sliced to localize the cause, and acted on in week 2 rather than week 7. Build the dashboard, calibrate it, pre-commit to the trigger rules, protect the data hygiene that feeds it, and stay honest about the four ways it lies.
Do that, and a down quarter becomes a managed event instead of a career-ending surprise.
FAQ
What exactly is the master leading indicator? The single best signal is the median deal age of Stage-2 and Stage-3 opportunities sitting in the 21-to-45-day-old band. When that median rises by 10 or more days week-over-week for two consecutive Fridays, you are roughly 4 to 6 weeks away from a forecast miss.
Why the 21-to-45-day band specifically? Deals 0-20 days old are too fresh to carry a velocity reading, and deals over 45 days are mostly fossils. Clari's 2025 benchmarks show deals stalled past roughly 1.5x the median sales cycle close at under 8%. The 21-45 day band captures buyers past first-meeting curiosity but not yet in a formal buying process, which is exactly where hesitation and budget cold feet first appear.
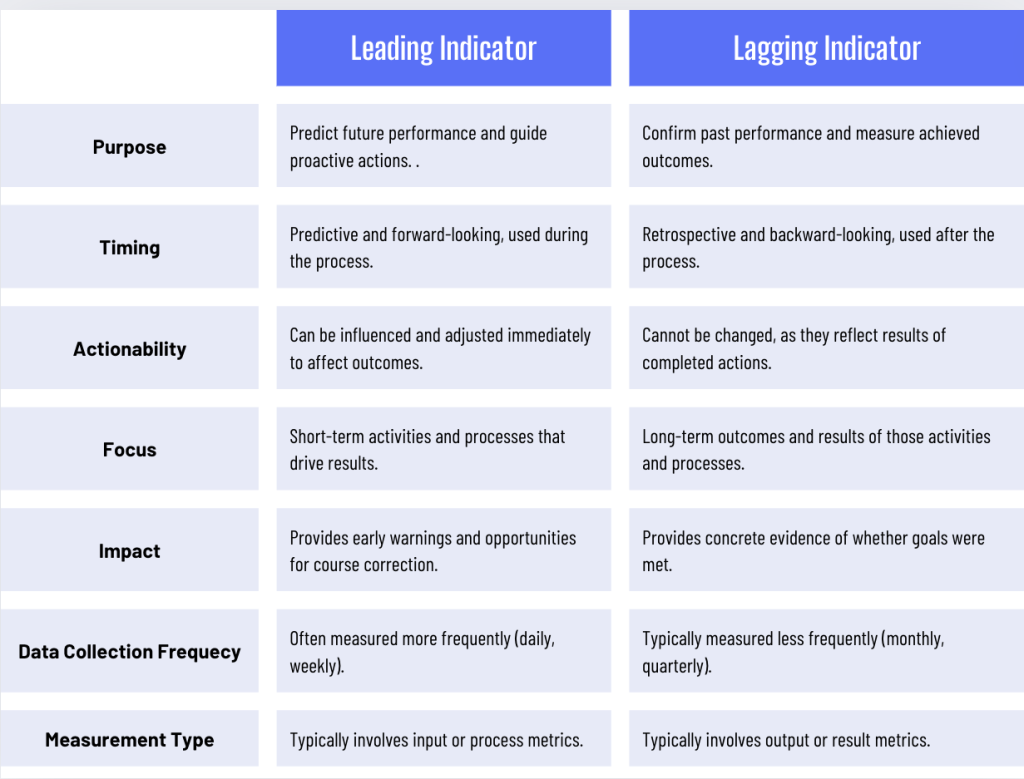
What is the difference between stock and flow metrics? Stock metrics like coverage ratio, total open ACV, and deal count describe how full the reservoir is and change slowly, so a team can carry 4x coverage of zombie deals and still miss by 30%. Flow metrics like deal age and stage-conversion velocity describe how fast water is actually moving through the pipe, and they slow before the reservoir visibly drains.
What is the full signal stack ranked by lead time? Mid-stage age creep leads by 6 weeks, then economic-buyer meeting velocity at 5 weeks, no-show rate at 4 weeks, the "waiting on prospect" ratio inversion at 3 weeks, and forecast category downgrades at 2 weeks, which is already too late.
Coverage ratio, activity counts, win rate, and raw AI deal scores should not be used as primary signals because they are stock or lagging measures.
How do you operationalize the dashboard? Build a 30-minute Friday dashboard in a sheet against your CRM API. Two reds means a pipeline meeting Monday; three reds means re-forecast and call your CFO first. The whole game is catching it in week 2 rather than week 7, since that 5-week buffer is the difference between a managed quarter and a fired CRO.