
Ad Revenue per Thousand Impressions (CPM) in Publishing: Digital Monetization in 2027
 Curated byKory White · Fractional CRO · Maryland
 PULSEKNOWLEDGE LIBRARY
Quality
Certified
CPM in publishing measures ad revenue per thousand impressions, and in 2027 it remains the core metric for digital monetization. Display CPMs typically run $2–$15, video $15–$50, and native $8–$20, varying by format, device, audience quality, and sales channel. Publishers optimize by blending programmatic and direct-sold inventory, managing floor prices, and tracking eCPM, fill rate, and viewability together.
Direct-sold versus programmatic: the two monetization paths
Publishing ad revenue in 2027 flows through two fundamentally different channels, and understanding the trade-offs between them is the foundation of any serious Monetization strategy. Direct-sold deals are negotiated agreements between a publisher and an advertiser or agency, typically with fixed CPMs, guaranteed impression volumes, and premium placements. Programmatic selling — whether open auction, private marketplace (PMP), or programmatic guaranteed — uses automated bidding to fill inventory in real time.
Direct-sold inventory commands the highest CPMs because advertisers pay for guaranteed placement, brand safety, and audience targeting. A premium news site might sell a homepage takeover at $40–$80 CPM, a sponsored content package at $25–$50 CPM, and a newsletter placement at $30–$60 CPM. The catch is operational overhead: direct sales require salespeople, insertion orders, creative trafficking, and reporting. A publisher needs enough scale — typically 500,000+ monthly pageviews — to justify a dedicated sales function.
Programmatic open auction sits at the opposite end. CPMs for open auction display routinely land between $0.50 and $3, with video often $5–$15. The advantage is zero-touch fill: demand flows automatically through exchanges like Google Ad Exchange, Magnite, PubMatic, and Index Exchange. The disadvantage is price erosion — when dozens of exchanges compete for the same impression, bids compress toward the floor.
Between these extremes sit PMPs and programmatic guaranteed deals. A PMP lets a publisher invite specific buyers (say, The Trade Desk or Amazon DSP) to bid on curated inventory at negotiated minimums. PMP CPMs commonly run $8–$20 for display and $25–$45 for video. Programmatic guaranteed locks in a fixed price and volume, giving the buyer certainty and the publisher revenue predictability — often at a 10–20% discount to direct-sold rates but with far less sales effort.
The practical reality for most publishers in 2027 is a blended model. A mid-size site might generate 40% of revenue from direct-sold, 30% from PMP and programmatic guaranteed, and 30% from open auction. The exact mix depends on audience niche, traffic scale, content type, and sales capacity. B2B publishers with high-intent audiences skew toward direct-sold; high-volume consumer sites lean programmatic.
How to decide between direct-sold and programmatic
The decision hinges on four variables: traffic volume, audience specificity, sales capacity, and revenue predictability needs. A publisher with 50,000 monthly sessions and a general-interest audience should default to programmatic — there simply isn't enough inventory or audience differentiation to attract direct buyers. A publisher with 2 million sessions and a niche B2B technology audience should build a direct sales team because advertisers will pay a premium to reach that specific audience.
Audience specificity matters more than raw volume. A site with 200,000 monthly visitors who are all IT decision-makers can command $30–$50 CPMs from enterprise software vendors. A site with 5 million monthly visitors interested in celebrity gossip might struggle to exceed $3 CPMs because the audience is commoditized and available everywhere.
Sales capacity is the operational constraint. Direct-sold requires people. A single salesperson can typically manage $500,000–$1,500,000 in annual direct revenue, depending on deal size and cycle length. If the math doesn't support hiring, programmatic is the answer.

Revenue predictability cuts both ways. Direct-sold deals provide committed revenue but concentrate risk — losing one anchor advertiser can wipe out 20% of revenue. Programmatic diversifies demand across hundreds of buyers but exposes the publisher to market fluctuations, seasonality, and exchange policy changes.
The flowchart above reflects a decision sequence that experienced publishing operators use when allocating inventory. The key insight is that direct-sold and programmatic are not mutually exclusive — they are layers. Most successful publishers start programmatic, prove audience value through data, then use that data to pitch direct deals at premium rates.
Concrete numbers behind each monetization path
Understanding the actual revenue math behind each channel is essential for forecasting and negotiation. Here are the benchmark ranges that publishing operators work with in 2027, drawn from publicly reported earnings and industry-standard rate cards.

Open auction display: $0.50–$3 CPM for run-of-site inventory. Premium above-the-fold placements might reach $4–$6. Mobile web typically runs 30–50% below desktop. Geography matters enormously: US and UK traffic commands 3–5x the CPMs of traffic from Southeast Asia or Latin America.
Open auction video: $5–$15 CPM for outstream, $10–$25 for instream pre-roll. Completion rate and player viewability are the dominant price drivers. A video with 70%+ completion and 80%+ viewability can command double the CPM of a poorly placed player.
PMP display: $8–$20 CPM. The premium over open auction comes from curated inventory, first-party data activation, and guaranteed brand-safe environments. Publishers typically see 20–40% CPM lift when moving inventory from open auction to PMP.

PMP video: $25–$45 CPM. Video PMPs are the fastest-growing segment because advertisers increasingly want guaranteed access to premium video inventory, and publishers want price floors that reflect video's scarcity.
Programmatic guaranteed: $10–$30 display, $30–$60 video. The discount to direct-sold reflects the buyer's volume commitment and the publisher's reduced sales effort.
Direct-sold display: $15–$50 CPM for standard placements, $40–$100+ for homepage takeovers and custom executions. Direct-sold video can exceed $80 CPM for premium pre-roll on high-traffic properties.

Native advertising: $8–$20 CPM for programmatic native, $20–$50 for direct-sold sponsored content. Native CPMs have compressed somewhat as supply has grown, but premium publishers still command strong rates.
Newsletter advertising: $20–$60 CPM based on list size and engagement. Newsletters are the highest-CPM channel for many publishers because open rates (30–50%) far exceed banner viewability, and the audience is self-selected.
The revenue mix matters as much as individual CPMs. Consider two publishers with identical traffic:
Publisher A: 10 million monthly pageviews, 3 ad slots per page, 100% open auction at $1.50 average CPM. Monthly ad revenue = 30 million impressions ÷ 1,000 × $1.50 = $45,000.
Publisher B: Same 10 million pageviews, 3 ad slots per page, but 30% direct-sold at $25 CPM, 30% PMP at $12 CPM, 40% open auction at $1.50 CPM. Monthly revenue = (9M × $25 + 9M × $12 + 12M × $1.50) ÷ 1,000 = $225,000 + $108,000 + $18,000 = $351,000.
Same traffic, nearly 8x the revenue. The difference is entirely in channel mix and the operational investment to build direct and PMP relationships.

Implementation details and sequencing
Building a publishing Monetization stack that captures these CPM ranges requires deliberate sequencing. Attempting to implement everything at once leads to broken ad experiences, reporting chaos, and revenue dips during transition periods.
Phase 1 — Foundation (weeks 1–4). Audit the existing ad stack. Document every demand partner, ad unit, and placement. Pull 90 days of historical eCPM, fill rate, and viewability data from Google Ad Manager. Identify the worst-performing ad slots (viewability below 40%, eCPM below $1) and either fix or remove them. Set floor prices: $1 for display, $5 for video, $2 for native. Establish a single source of truth for reporting — typically a Looker Studio or Tableau dashboard pulling from Ad Manager, Google Analytics, and any subscription or affiliate platforms.

Phase 2 — Demand optimization (weeks 5–10). Implement or expand header bidding using Prebid.js with at least five demand partners. Common choices include Index Exchange, OpenX, Magnite, PubMatic, and Amazon Publisher Services. Header bidding typically lifts CPMs 20–40% over a Google-only waterfall because it creates genuine competition for each impression. Monitor latency — adding too many bidders can slow page load and hurt both user experience and SEO. Target under 300ms total bid timeout.
Phase 3 — Format expansion (weeks 11–16). Test video and native formats on high-engagement pages. Video requires a player (Connatix, Playwire, or a custom JW Player implementation) and careful placement to avoid disrupting reading flow. Native ads (via TripleLift, Sharethrough, or Taboola) work best in-feed and below article content. Run each new format on 10–20% of traffic for two weeks before scaling.
Phase 4 — Direct and PMP sales (weeks 17–24). Use the audience data collected in phases 1–3 to build a media kit. Approach DSPs and agencies for PMP deals, starting with programmatic guaranteed to establish pricing benchmarks. Hire or contract a salesperson once PMP revenue proves the audience has premium value. Target 20–30% of total revenue from direct and PMP by month six.
The sequencing matters because each phase generates data that informs the next. You cannot build a credible media kit without clean audience data. You cannot negotiate PMP floors without knowing your open auction clearing prices. You cannot justify hiring a salesperson without proving that PMP deals close at premium rates.
Ongoing optimization cadence. Daily: check eCPM, fill rate, and viewability for anomalies (a 20%+ drop from the prior day warrants investigation). Weekly: segment performance by device, format, and traffic source; adjust floor prices on top ad units. Monthly: full revenue report with RPM and LTV calculations; review demand partner performance. Quarterly: renegotiate PMP deals and floor prices; evaluate new formats or partners. Annually: strategic review of channel mix and investment priorities.
Common failure modes to avoid. Over-reliance on open auction (80%+ of revenue) leaves publishers exposed to CPM volatility. Ignoring viewability below 50% causes advertisers to blacklist inventory. Excessive ad density (6+ slots per page) destroys user experience and triggers search ranking penalties. Static floor prices that are never adjusted leave money on the table during high-demand periods (Q4, elections, major events) and suppress fill rate during slow periods. Finally, failing to segment mobile from desktop obscures the fact that mobile CPMs are often 30–50% lower, requiring different ad formats and placements to monetize effectively.
Related questions
What is a realistic CPM for a publisher with 100,000 monthly pageviews?
Expect $1–$4 CPM from programmatic display and $5–$12 from video if implemented. At this scale, focus on niche content and high-value geographies. Consider joining a publisher collective or ad network like Mediavine or Raptive to access premium demand typically reserved for larger sites.
How much does header bidding actually increase CPM?
Header bidding typically lifts CPMs 20–40% compared to a Google-only waterfall, with the exact lift depending on how many demand partners participate and how competitive the auction becomes. Publishers adding five or more bidders often see the upper end of that range within 60 days.
Why do video CPMs vary so widely between publishers?
Video CPMs depend on completion rate, player viewability, content category, and whether inventory is direct-sold or programmatic. A premium news site with 80% completion and direct-sold pre-roll might command $40 CPM, while a user-generated content site with 30% completion and open auction inventory might see $3.
Should publishers use Google Ad Manager or a smaller ad server?
Google Ad Manager is free and supports header bidding, multiple demand partners, and granular reporting, making it the default for most publishers above 100,000 monthly pageviews. Smaller ad servers may offer better support or specialized features but rarely justify switching unless the publisher has unusual needs.
How do ad blockers affect publishing CPMs in 2027?
Ad blockers reduce available impressions by 10–30% depending on audience demographics and content type. The remaining impressions often have lower eCPM because ad-blocking users tend to be less responsive to advertising. Publishers can recover some revenue through acceptable ads programs or ad-block walls that require subscription or whitelisting.
FAQ
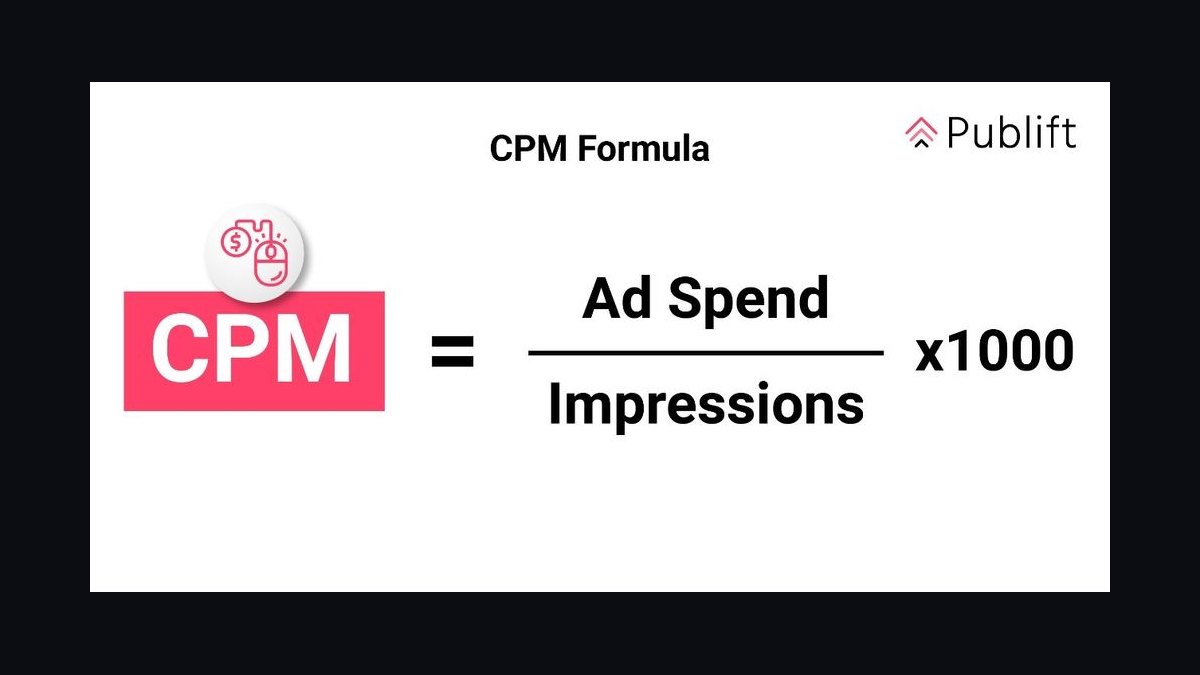
What is the difference between CPM and eCPM? CPM is the negotiated or bid price for a thousand impressions on a specific ad unit or deal. eCPM is the effective average across all revenue and impressions — total revenue divided by total impressions times 1,000. A publisher might have individual deals at $20 CPM but an overall eCPM of $8 because much of the inventory sells at lower rates through open auction.
How often should floor prices be adjusted? Weekly for top-performing ad units and monthly for the rest. Use Ad Manager's floor price reporting to identify units where floors are too high (fill rate dropping) or too low (CPM below market). Test 10–20% adjustments and measure the impact on total revenue, not just CPM — a higher floor that drops fill rate by 30% often reduces total revenue.
What viewability rate should publishers target? Display viewability above 70% and video above 80% positions a publisher for premium demand and PMP deals. Below 50% viewability, advertisers increasingly exclude inventory from campaigns. Improving viewability from 50% to 70% can lift CPMs 15–25% because advertisers pay for impressions that are actually seen.
How does seasonality affect publishing CPMs? Q4 (October–December) typically sees CPMs 20–40% above annual averages due to holiday advertising budgets. January and February are the slowest months. Political years (even-numbered US election cycles) lift CPMs in Q3 and Q4, particularly for news and politics content. Publishers should adjust floor prices seasonally to capture demand spikes without suppressing fill during slow periods.
What is the minimum traffic needed to join a premium ad network? Most premium networks require 50,000–100,000 monthly sessions. Mediavine requires 50,000 sessions, Raptive (formerly AdThrive) requires 100,000 pageviews, and Google AdSense has no minimum but pays significantly lower CPMs. Below 50,000 sessions, publishers should focus on content quality and audience growth before optimizing ad revenue.
How do first-party data and identity resolution affect CPMs? Publishers with authenticated audiences or rich first-party data can command 2–3x higher CPMs because advertisers can target specific segments without relying on third-party cookies. Identity solutions like LiveRamp or UID2 help publishers activate first-party data across programmatic channels, but the biggest lift comes from direct-sold deals where the publisher can guarantee audience composition.
Sources
- Google Ad Manager Help: eCPM and Reporting
- Interactive Advertising Bureau: Digital Ad Revenue Reports
- Media Rating Council: Viewability Standards
- Prebid.org: Header Bidding Documentation
- eMarketer: Digital Advertising Trends and Benchmarks
- Integral Ad Science: Viewability and Ad Quality Benchmarks
- PubMatic: Publisher Monetization Resources
- Magnite: Programmatic Advertising Insights
- Index Exchange: Header Bidding and Marketplace Insights
Related on PULSE
- [Top 10 Digital Advertising Revenue per Click and CPM Benchmarks](/knowledge/ik0509)
- [Top 10 Media Advertising CPM and Revenue per Subscriber KPIs](/knowledge/ik0559)
- [Transaction Revenue Per Active User in Digital Wallets like PayPal](/knowledge/ik0521)
- [Top 10 Telecom Average Revenue Per User Growth KPIs](/knowledge/ik0586)
- [Logistics & Freight: Revenue Per Truck per Day After Fuel Surcharge Fluctuations](/knowledge/ik0590)
This page will be disappearing soon. Save it to your device for $1 — or read it free while it is here.
@Kory-White- · if Venmo asks, the last 4 of my number are 2012
 pulse-industry-kpisTop 10 Med Spa Revenue KPIs in 2027
 pulse-industry-kpisTop 10 Brewery Revenue KPIs in 2027
 pulse-industry-kpisTop 10 Streaming Service Revenue KPIs in 2027
 pulse-industry-kpisRevenue Per Patient Visit in Outpatient Primary Care Clinics in 2027
 ikHow do you get started with Industry KPIs in 2027?
 pulse-industry-kpisTop 10 Telecommunications ARPU and Churn Rate KPIs in 2027
 pulse-industry-kpisTransaction Revenue Per Active User in Digital Wallets like PayPal in 2027
 pulse-industry-kpisTop 10 P&C Insurance Carrier Revenue KPIs in 2027
 pulse-industry-kpisYield Per Acre as a Core KPI for Precision Agriculture Companies in 2027
 pulse-industry-kpisTop 10 Parcel Carrier Revenue per Package and Density KPIs in 2027