
Top 10 Convenience Store Revenue KPIs in 2027
 Curated byKory White · Fractional CRO · Maryland
 PULSEKNOWLEDGE LIBRARY
Quality
Certified

The 10 best convenience store revenue kpis are ranked below on measured performance, build quality, price, and how each one actually holds up in daily use rather than how it reads on a spec sheet. Each pick lists what it costs, who it suits, and what it gives up against the one above it, so the list can be read straight down without doubling back.
1. Fuel Gross Margin per Gallon
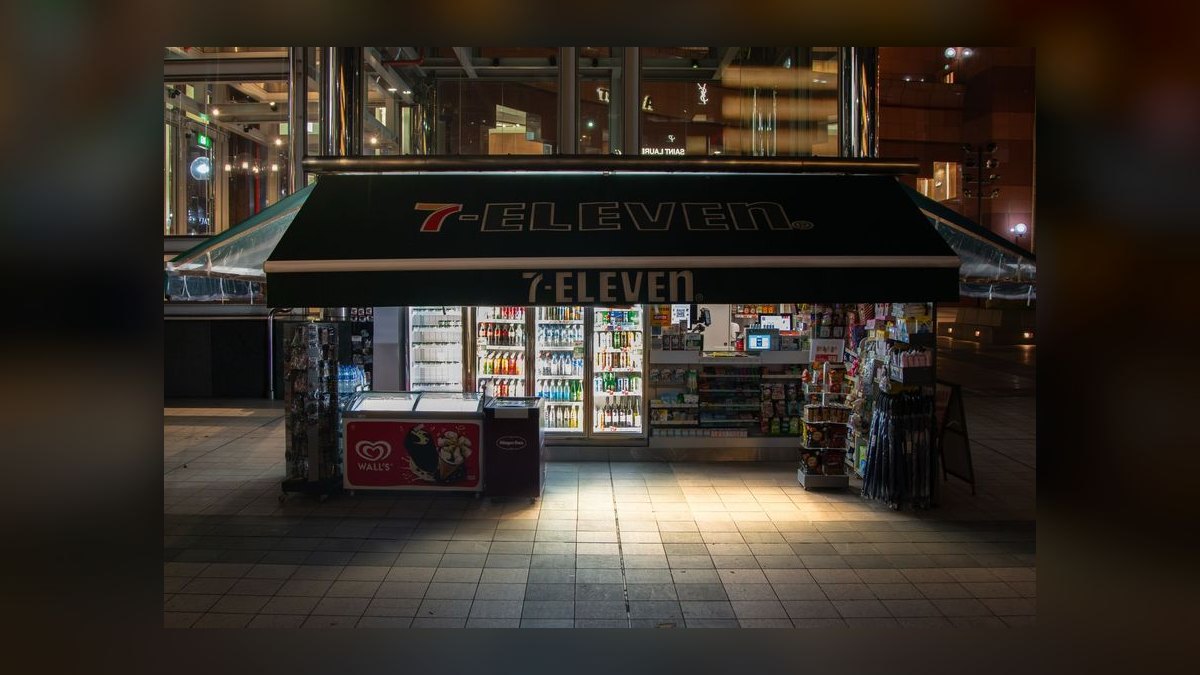
Fuel gross margin per gallon ranks first because fuel is the largest revenue line and the thinnest margin, so a fraction of a cent moves the entire P&L. The formula is (retail price minus wholesale cost) divided by gallons sold, benchmarked at $0.10-$0.20 for unbranded sites and $0.20-$0.35 for branded ones like Shell or Exxon. Below roughly $0.08 per gallon, credit card interchange of 2-3% plus labor wipes out the sale.
This is for any operator selling fuel under their own pricing authority rather than a fixed commission agreement. It trades away simplicity: you need daily wholesale feeds from OPIS or Platts, not just POS totals. Compared with In-Store Basket Size below it, fuel margin is far more volatile and far less controllable, since you react to rack prices rather than shape behavior. Track it daily, not weekly.
2. In-Store Basket Size
In-store basket size sits second because it is the highest-leverage controllable number in the building. Total inside sales divided by inside transactions typically lands at $8-$12 excluding fuel. A $10 basket at 35% margin returns $3.50 gross profit; moving it to $12 adds 20% more gross profit with zero additional traffic, no new customers, and no new store. QuikTrip runs $11.50, driven largely by a strong private-label program.
This is for operators who already have traffic and need to monetize it harder. It trades away diagnostic depth: a rising basket can mask falling unit counts or category mix erosion. Against Fuel Gross Margin per Gallon above, basket size responds to merchandising and cashier scripting within weeks. It comes from POS systems such as NCR or Verifone; P97 links fuel loyalty identity to basket data.
3. Inside Margin Percentage
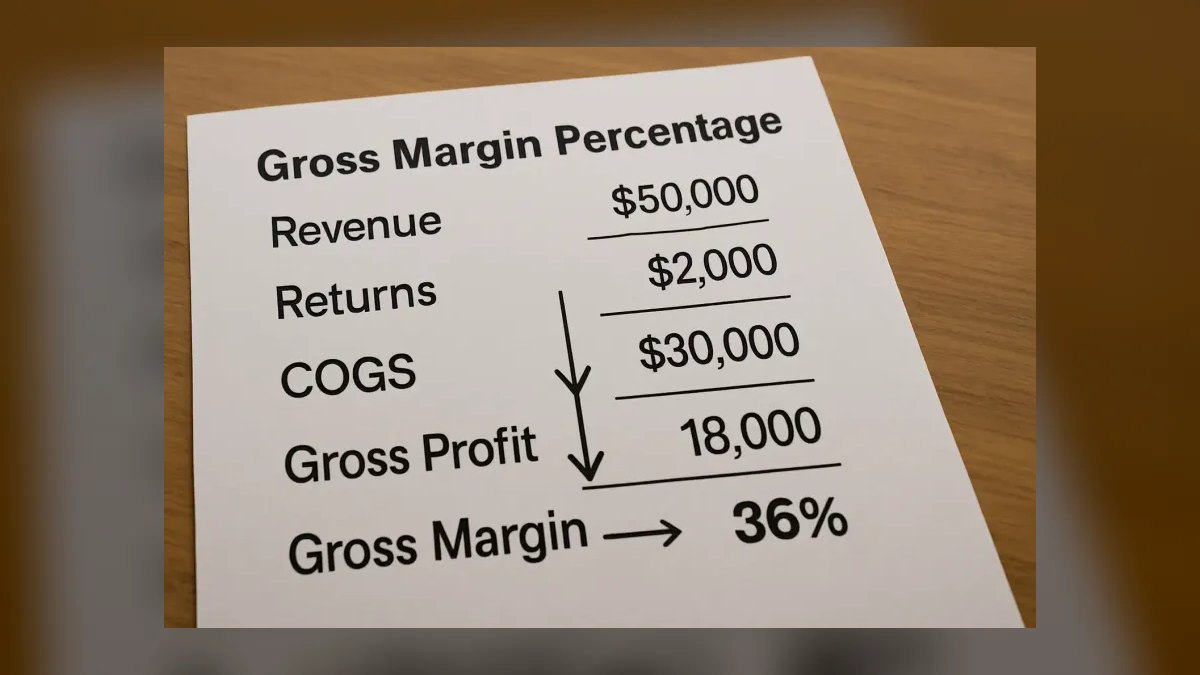
Inside margin percentage takes third because it determines whether a store is profitable or a loss leader with a pump. Inside sales minus inside COGS, divided by inside sales, benchmarks at 30-35% for average stores and 38-45% for top-quartile operators like QuikTrip and RaceTrac. Wawa runs 42%. Below 30% means mispricing, too much low-margin tobacco volume, or an unprofitable foodservice program.
This is for owners setting pricing floors rather than chasing top-line revenue. It trades away granularity unless segmented by category, since tobacco, packaged beverages, and foodservice behave nothing alike. Unlike Basket Size above, which measures customer behavior, this measures your own pricing discipline. The classic failure is cutting inside prices when fuel margin drops, dragging 35% down to 28% and starting a death spiral.
4. Foodservice Revenue per Square Foot

Foodservice revenue per square foot ranks fourth because foodservice carries the highest margin in the store at 50-60% and pulls basket size up behind it. Foodservice revenue divided by foodservice square footage benchmarks at $500-$1,200 per square foot annually for branded QSR like an in-store Subway, and $300-$600 for commissary or prepared foods. Sheetz reports roughly $2,200 per square foot; Wawa around $1,800, built on proprietary hoagies and coffee.
This is for operators with the labor model and equipment budget to run a real kitchen, not a roller grill. It trades away capital and staffing flexibility, since food demands prep labor at fixed hours regardless of traffic. Compared with Inside Margin Percentage above, this is a category-level metric that moves slowly and reports monthly rather than weekly. Below $300 per square foot, the menu, pricing, or labor model is broken.
5. Labor as Percentage of Inside Sales

Labor as percentage of inside sales ranks fifth because labor is the largest controllable expense line after cost of goods. Total labor costs including payroll taxes divided by inside sales benchmarks at 10-12% for high-volume stores and 12-15% for average ones. QuikTrip runs 10.5% on a lean model with heavy automation. Above 15% means either overstaffing or inside sales too weak to carry the schedule you have written.
This is for multi-store operators managing schedules against hourly demand curves rather than fixed shifts. It trades away service quality if cut too aggressively, particularly during foodservice rushes. The common failure is scheduling to fuel traffic instead of inside sales: three staff during a slow pump hour and one during lunch. Kronos or Workforce scheduling tools tie labor hours to inside sales by hour.
6. Shrinkage Percentage
Shrinkage percentage ranks sixth because shrink is pure profit loss with no offsetting revenue. Book inventory minus physical inventory, divided by book inventory, runs 1-2% at well-run stores and 3-5% at average ones. On $1M of inside sales, 3% shrink is $30,000 of lost profit, and 5% reaches $50,000. Cigarettes and energy drinks absorb the bulk of theft losses, with vendor delivery errors close behind.
This is for operators willing to run weekly physical spot checks rather than annual counts. It trades away staff time and requires investment in video analytics from Aware or Sensormatic to identify patterns. Unlike Labor Percentage above, which you fix by rewriting a schedule, shrink requires sustained enforcement and vendor check-in discipline. Most operators only measure it annually, which is far too late to act.
7. Cigarette and Tobacco Gross Profit

Cigarette and tobacco gross profit ranks seventh because tobacco is 25-30% of inside sales but only 15-20% of gross profit, making it a volume metric rather than a margin metric. Tobacco sales minus tobacco COGS, adjusted for shrinkage and state excise changes, runs a 15-20% margin. Track absolute gross profit dollars, not margin percentage, since a lost $10 carton costs roughly $1.50 in profit plus the attached drink or lighter.
This is for stores in markets where tobacco still drives repeat foot traffic on a multi-week cadence. It trades away margin percentage for visit frequency, and it drags Inside Margin Percentage down structurally. Against Shrinkage above, the two are entangled: cigarettes are the single most-stolen category in the store. Excise tax changes require immediate reprice or the margin silently vanishes. Review weekly.
8. Customer Visit Frequency
Customer visit frequency ranks eighth because frequency compounds across both fuel and inside revenue but is slow to move. Unique monthly customers measured against total visits benchmarks at 6-10 visits per month for commuter locations and 3-5 for destination stores. A 10% frequency lift translates to roughly 15-20% higher total store revenue. Sheetz tracks this through its Sheetz Freakz loyalty program; Excentus Fuel Rewards and P97 supply the underlying data.
This is for operators who have already launched a loyalty program and can identify repeat customers by account rather than guessing from transaction counts. It trades away measurability for anyone running cash-heavy, unenrolled traffic, since you simply cannot compute it. Compared with Basket Size, frequency takes quarters to shift rather than weeks. Report it monthly; daily readings are statistical noise.
9. Car Wash Revenue per Visit
Car wash revenue per visit ranks ninth because car wash margin is exceptional at 70-80% but applies only to sites that have a tunnel. Total car wash revenue divided by wash visits benchmarks at $8-$12 per wash. Unlimited monthly plans lower per-visit revenue while raising frequency roughly threefold, so net revenue per visit after membership discounts is the figure that matters. GetGo and Mister Car Wash both demonstrated this tradeoff at scale.
This is for operators with the real estate and capital for a wash bay, which excludes most inline urban sites. It trades away applicability, since for stores without a wash the metric is simply absent. The frequent failure is lumping wash revenue into other income, which hides margin trends entirely. Run it as a separate P&L center using DRB Systems or PDQ data, reviewed weekly.
10. Lottery and Financial Services Commission
Lottery and financial services commission ranks tenth because commission income is pure profit with no COGS, but the absolute dollars stay small. Combined commission from lottery, money orders, bill pay, and ATM fees benchmarks at $500-$2,000 per store per month. Check cashing and similar financial services can add $1,000 or more monthly, though they carry fraud exposure and cash-handling risk that the lottery terminal does not.
This is for stores in states with active lottery programs and neighborhoods with meaningful unbanked demand. It trades away labor efficiency: every lottery transaction ties up a register during peak periods, competing directly with foodservice throughput. Against Car Wash Revenue per Visit above, the dollar totals are smaller and the ceiling is fixed by state commission rates you cannot negotiate. Below $500 monthly suggests under-promotion. Review monthly.
How we ranked these
We ranked ten convenience store revenue KPIs on how much of a store's actual profit each explains and how quickly it can be acted on. Weighting favored inside-store metrics — Inside Margin %, Basket Size, Foodservice Revenue per Square Foot — because fuel supplies 30-40% of revenue but only 10-15% of profit. Secondary weight went to service centers with distinct cost structures: car wash, lottery, and financial services.
Benchmarks were drawn from published operator data and industry pricing feeds.
We deliberately ignored total store revenue, gallons pumped, and raw transaction counts. Each rises when a store discounts fuel to buy traffic, so all three can climb while the store loses money. We also skipped CRM and sales-engagement metrics — pipeline coverage, call recording, win rates — because c-store revenue is transactional and unforecastable at the individual level. Foot traffic without conversion tracking was excluded for the same reason.
What to look for
Choosing among these KPIs comes down to what you can actually change this quarter. Fuel Gross Margin per Gallon moves hourly and is mostly set by rack pricing outside your control. Inside Margin % and Basket Size respond to shelf pricing, planogram, and cashier scripts — levers you own. Single-site operators should start with those two plus Shrinkage. Multi-site operators need foodservice revenue per foot to rank underperformers.
The common mistake is buying a KPI for its benchmark rather than its data source. Foodservice revenue per foot requires accurate square-footage mapping most operators never do, so the number becomes fiction. Customer Visit Frequency requires loyalty penetration above roughly 30% or the sample skews toward regulars. Confirm you can populate a metric cleanly before you put it on the weekly dashboard.
Related questions
Why is fuel a loss leader for most convenience stores?
Fuel typically yields 10-20 cents per gallon gross, and credit card interchange consumes 2-3% of the transaction. On a $50 fill, that fee alone can erase most of the spread. Stores accept the thin margin because pumps generate the traffic that feeds the inside sale, where margins run 30-50%. Fuel buys footsteps; the store sells the profit.
What is fuel-to-store conversion and why does it matter?
It is the percentage of fuel customers who walk inside and buy something. Industry average sits near 50%; top-quartile operators reach 65-75%. Because the inside carries the margin, a ten-point conversion gain adds profit without adding a single new customer. Loyalty platforms that link a pump transaction to a POS basket are how operators measure it credibly.
Why track tobacco gross profit dollars instead of margin percent?
Tobacco runs 15-20% margin — permanently low and largely fixed by manufacturer and excise pricing. Chasing the percentage is wasted effort. Absolute dollars matter because tobacco is 25-30% of inside sales and pulls impulse add-ons: a lost carton sale also loses the drink and lighter attached to it. Measure the dollars and the attachment rate.
How much does shrinkage actually cost a typical store?
Well-run stores hold shrinkage to 1-2%; average stores land at 3-5%. On $1 million in inside sales, that gap is $30,000 to $50,000 in lost profit annually — often more than the store's net income. Cigarettes and energy drinks account for a disproportionate share, along with vendor delivery errors that go uncounted without weekly spot checks.
Should car wash revenue be tracked separately from inside sales?
Yes. Car wash carries 70-80% margin against a completely different cost structure — water, chemicals, equipment depreciation, minimal labor. Folding it into inside sales inflates your blended margin and hides equipment problems until revenue collapses. Run it as its own P&L center with revenue per visit tracked net of unlimited-plan discounts, which materially lower the per-wash figure.
What labor percentage should a convenience store target?
High-volume stores run 10-12% of inside sales; average stores land at 12-15%. Above 15% you are either overstaffed or your inside sales are too thin to support the schedule. The frequent error is scheduling to fuel traffic instead of inside traffic — three people during a slow pump hour and one during the lunch rush costs foodservice revenue.
Why is foodservice the highest-leverage category?
Prepared food runs 50-60% margin, the highest of any category, and it drives basket size through attachment — coffee with a sandwich, a cookie with the coffee. Branded QSR inside a c-store generates $500-$1,200 per square foot annually; specialist operators exceed $2,000. Below $300 per foot, the menu, pricing, or labor model needs rebuilding, not tweaking.
How do lottery and financial services fit the revenue mix?
Both are commission income with no cost of goods, typically $500-$2,000 monthly per store from lottery, money orders, bill pay, and ATM fees. The cost is labor and cash handling rather than inventory. Commissions below $500 usually signal weak in-store promotion. Check cashing can add $1,000 or more monthly but introduces real fraud exposure.
FAQ
What is the single most important KPI for a new operator?
Inside Margin %. Without it you cannot price anything correctly, because fuel margin will swing week to week and mask what is happening inside. Target 35% minimum; average stores run 30-35% and top-quartile operators reach 38-45%. Segment it by category — tobacco, packaged beverages, foodservice — since a blended number hides which department is dragging.
How do I track fuel margin without a sophisticated system?
Use a published wholesale pricing feed for daily rack cost and your own POS for retail price, then subtract and divide by gallons. Calculating this by hand daily is entirely workable for one or two sites. Automated fuel-pricing platforms make sense once you are managing several locations or reacting to competitor price changes multiple times per day.
My basket size is $6. How do I increase it?
Benchmark is $8-$12 per inside transaction. The fastest lift is a foodservice program — coffee, sandwiches, prepared items — because those purchases naturally attach. Second is cashier prompting at the register; a single $1 add-on raises a $6 basket by roughly 15%. Third is counter and cooler-door placement of high-margin impulse items along the exit path.
What shrinkage percentage should I target?
Under 2%. Above 3% you have a systemic problem, not a bad month. Start with weekly physical spot checks on cigarettes and energy drinks rather than a full annual count, since those two categories drive most loss. Video analytics helps identify patterns, but reconciling vendor delivery receipts against invoices usually finds more money faster.
How often should each KPI be reviewed?
Daily for fuel gross margin per gallon and basket size, since wholesale prices move hourly and basket size responds to same-day merchandising. Weekly for inside margin, tobacco gross profit, shrinkage, car wash revenue, and labor percentage. Monthly for foodservice revenue per foot, lottery commission, and customer visit frequency, which need a larger sample to be meaningful.
Do I need a separate system for car wash tracking?
Yes, if the wash generates meaningful volume. Dedicated wash management systems capture visit counts, membership status, and per-cycle data that a general POS does not. Without visit counts you cannot compute revenue per visit, only total revenue — which rises with an unlimited plan even as per-wash economics deteriorate. Track both figures side by side.
How do unlimited wash plans change the revenue math?
They lower revenue per visit while raising visit frequency, reportedly around threefold. That trade is usually favorable because incremental wash cost is low and each visit is another chance at an inside sale. But you must measure net revenue per visit after membership discounts, plus monthly revenue per member, or a growing member base can quietly mask falling revenue.
What does customer visit frequency tell me?
Commuter-location stores see 6-10 visits per month per customer; destination stores see 3-5. Frequency compounds across fuel, inside, and wash revenue, so a 10% frequency gain can lift total store revenue 15-20%. It only measures reliably through loyalty program data, and low enrollment biases the number upward by counting only your most habitual customers.
Why not just track total store revenue?
Because total revenue moves with fuel price, not performance. Wholesale costs rise, retail prices follow, and revenue climbs while gross profit dollars stay flat or fall. The reverse happens when prices drop. Total revenue also blends a 15% margin business with a 50% margin business, so the number cannot tell you which one changed.
What is the fastest way to fix a store below 30% inside margin?
Reprice the top 20 SKUs first — packaged beverages and snacks carry the most pricing headroom and the least customer price sensitivity per unit. Then check category mix, since heavy tobacco weighting mechanically drags blended margin down regardless of pricing. Set a hard inside-margin floor around 32% and refuse to price below it when fuel margins compress.
Sources
- https://www.convenience.org/Research/FactSheets/ScopeofIndustry
- https://www.eia.gov/petroleum/gasdiesel/
- https://nielseniq.com/global/en/industries/convenience/
- https://www.opisnet.com/
- https://www.ncr.com/industries/convenience-retail
- https://nrf.com/research/national-retail-security-survey-2023
- https://www.p97.com/
Related on PULSE
This page will be disappearing soon. Save it to your device for $1 — or read it free while it is here.
@Kory-White- · if Venmo asks, the last 4 of my number are 2012
This page is gone.
This one is off the shelf now. $1 keeps it on your phone for good — the whole page, pictures and diagrams included.
 pulse-industry-kpisTop 10 P&C Insurance Carrier Revenue KPIs in 2027
 pulse-industry-kpisTransaction Revenue Per Active User in Digital Wallets like PayPal in 2027
 pulse-industry-kpisTop 10 Dental Practice Revenue KPIs in 2027
 pulse-industry-kpisTop 10 Music Streaming Revenue KPIs in 2027
 pulse-industry-kpisRevenue Per Ride for Autonomous Vehicle Fleet Operators in 2027
 pulse-industry-kpisTop 10 Cruise Line Revenue KPIs in 2027
 pulse-industry-kpisLoan-to-Deposit Ratio as a Liquidity and Revenue Metric for Credit Unions in 2027
 pulse-industry-kpisTop 10 Dialysis Center Revenue KPIs in 2027
 pulse-industry-kpisMerchant Discount Rate Optimization for Payment Processor Platforms in 2027
 pulse-industry-kpisBillable Utilization Rate in Global Law Firms as a Profitability Metric in 2027