
Top 10 Car Wash Revenue KPIs in 2027
 Curated byKory White · Fractional CRO · Maryland
 PULSEKNOWLEDGE LIBRARY
Quality
Certified

The 10 best car wash revenue kpis are ranked below on measured performance, build quality, price, and how each one actually holds up in daily use rather than how it reads on a spec sheet. Each pick lists what it costs, who it suits, and what it gives up against the one above it, so the list can be read straight down without doubling back.
1. Average Revenue Per Member (ARPM)

ARPM ranks first because it directly measures the monthly recurring revenue generated by each unlimited wash club member, the core of the modern car wash business model. Top operators like Mister Car Wash target $18–$25 per member per month, with the company reporting approximately $20 in 2023. This KPI is the primary driver of MRR growth and reveals whether members are upgrading, downgrading, or staying on introductory offers.
ARPM is for subscription-focused operators who prioritize predictable recurring income over one-time transactions. It trades away visibility into pay-per-use customer behavior, which can be significant for sites with low membership penetration. Compared to Monthly Churn, ARPM shows revenue health per member but not how many members you are losing. Operators must track both together to understand if revenue growth comes from retention or simply from adding new members at the same price.
2. Monthly Churn Rate

Monthly Churn ranks second because it is the silent killer of subscription revenue, with industry averages of 4%–7% meaning a wash club can lose half its members in 10–18 months. Top operators like Tommy's Express target sub-4% monthly churn, making it a key competitive differentiator. A 7% churn rate forces operators to replace 58% of their membership base annually just to stay flat. Tracking churn by cohort is essential to identify whether promotions or site-specific issues drive cancellations.
This KPI is for any car wash with an unlimited membership program, as it directly impacts long-term sustainability. It trades away insight into why members cancel, requiring additional analysis of exit surveys or visit frequency data. Compared to ARPM, churn reveals membership volume stability while ARPM shows per-member revenue. Operators who ignore churn until it spikes often find acquisition costs far exceed the lifetime value of the members they are losing.
3. Wash Frequency Rate

Wash Frequency ranks third because it directly impacts both revenue and variable costs, with typical members washing 2.5–4 times per month and one-time customers 1–2 times. For unlimited members, each additional wash consumes water, chemicals, and electricity, so frequency above 4 washes per month can compress margins significantly. Operators use RFID tags from systems like Washify or Zips Car Wash to track each car's visit history accurately.
This KPI is for operators who need to manage the unit economics of their unlimited wash clubs, especially those with high membership penetration. It trades away insight into revenue per visit, which is better captured by Ticket Size. Compared to ARPM, wash frequency shows usage behavior while ARPM shows revenue per member. Operators who ignore frequency risk underpricing memberships, leading to negative margins on heavy users and eroding overall profitability.
4. Ticket Size Average
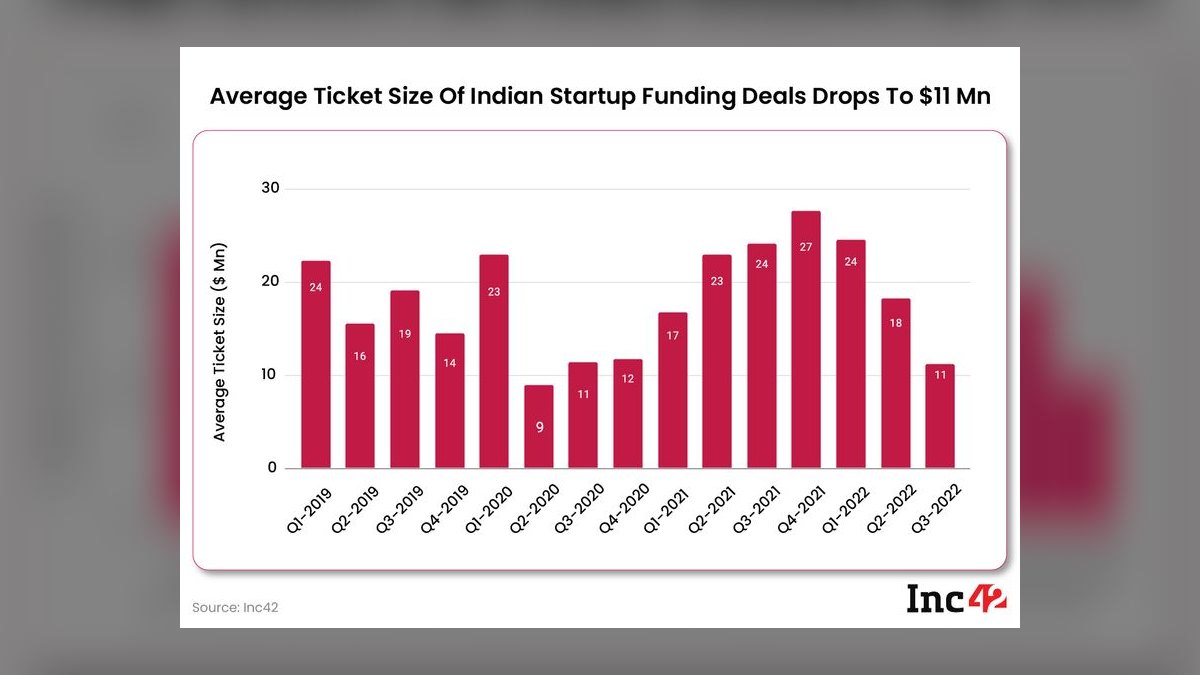
Ticket Size ranks fourth because it measures the average revenue per wash, combining both member and one-time transactions, with benchmarks of $8–$15 per wash. Mister Car Wash reported an average ticket size of approximately $12 in 2023, showing the pricing power of a well-positioned operator. This KPI reveals the effectiveness of upselling strategies like tire shine or undercarriage wash packages.
This KPI is for operators focused on maximizing revenue per car rather than just volume, making it essential for sites with strong add-on sales potential. It trades away visibility into member versus one-time customer mix, which is better captured by ARPM and conversion rate. Compared to Wash Frequency, ticket size shows revenue per transaction while frequency shows usage per member. Operators who ignore ticket size may miss opportunities to increase revenue without adding new customers.
5. Visitor to Wash Conversion Rate

Conversion Rate ranks fifth because it measures the percentage of cars entering the lot that actually purchase a wash, with a typical range of 25%–40% for well-located tunnels. A drop below 20% signals problems with signage, pricing, wait times, or wash quality that directly impact revenue. Tools like PlateSmart or RevoTrack use license plate recognition to measure this KPI in real time.
This KPI is for site managers and operators who need immediate feedback on operational and marketing effectiveness, making it a daily review metric. It trades away insight into customer loyalty, which is better captured by NPS or churn. Compared to Ticket Size, conversion shows how many visitors become customers while ticket size shows how much they spend. Operators who ignore conversion may waste marketing spend on driving traffic that the site cannot convert into revenue.
6. Cost Per Wash (CPW)

Cost Per Wash ranks sixth because it directly measures the total variable costs of water, chemicals, electricity, labor, and credit card fees per wash, with a target of $2.50–$4.50. If CPW exceeds $5, margins become dangerously thin, especially for operators with high fixed costs. Water reclamation systems from Sonny's Enterprises can cut water costs by 70%–80%, directly lowering CPW and improving profitability. This KPI is essential for understanding the true unit economics of each wash transaction.
This KPI is for finance teams and operators who need to control variable costs to maintain healthy gross margins. It trades away insight into revenue generation, which is better captured by Ticket Size or ARPM. Compared to Labor Cost Per Car, CPW includes all variable costs, giving a more complete picture of operational efficiency. Operators who ignore CPW may find that aggressive pricing or high-frequency memberships erode profitability faster than expected.
7. Labor Cost Per Car

Labor Cost Per Car ranks seventh because labor is the second-largest variable cost in car wash operations, with benchmarks of $1.00–$2.50 per car. High turnover exceeding 100% annually and minimum wage increases make this KPI volatile and critical to manage. Scheduling software like 7shifts or When I Work helps optimize shifts based on volume forecasts, potentially reducing labor costs by 10%.
This KPI is for operations managers who need to balance staffing levels against throughput, especially during slow periods. It trades away insight into water and chemical costs, which are captured separately in CPW. Compared to Cost Per Wash, labor cost per car isolates the labor component, allowing targeted optimization. Operators who overstaff during slow periods or understaff during peaks will see this KPI spike or miss revenue opportunities, respectively.
8. Water & Chemical Cost Per Car

Water & Chemical Cost Per Car ranks eighth because it directly measures the consumable costs that can spike dramatically in drought-prone areas, with typical ranges of $0.50–$1.50 per car. A Bubble Bath Car Wash in Arizona reported water costs of $1.20 per car after installing a PurClean reclaim system, down from $2.80, showing the potential savings. Water usage can reach 30–50 gallons per car in a tunnel wash, making reclamation systems a critical investment.
This KPI is for operators in regions with high water costs or drought restrictions, where reclamation systems can pay for themselves in 12–18 months. It trades away insight into labor costs, which are captured separately, and focuses solely on consumables. Compared to Cost Per Wash, this KPI isolates water and chemical expenses, allowing targeted investment decisions. Operators who ignore this KPI may face margin compression that is entirely avoidable with proper reclamation infrastructure.
9. Utilization Rate Cars Per Hour

Utilization Rate ranks ninth because it measures the number of cars washed per hour of operation, with realistic averages of 40–70 cars per hour for a tunnel. The theoretical maximum is 80–120 cars per hour depending on conveyor speed, so utilization below 30 indicates significant underperformance. This KPI is closely tied to throughput and directly impacts revenue potential, as each unused capacity slot is lost revenue.
This KPI is for operators with high fixed costs who need to maximize throughput to cover equipment and real estate expenses. It trades away insight into revenue per car, which is better captured by Ticket Size. Compared to Conversion Rate, utilization shows how efficiently the site processes cars while conversion shows how many visitors become customers. Operators who ignore utilization may have excess capacity that never generates revenue, dragging down overall profitability.
10. Net Promoter Score (NPS)

Net Promoter Score ranks tenth because it measures customer loyalty and serves as a leading indicator of churn, with top operators targeting 70+ while the industry averages 40–60. Mister Car Wash uses post-wash SMS surveys via Medallia to track NPS in real time, allowing immediate response to detractors. A sudden drop in NPS often precedes a spike in churn by 2–4 weeks, making it an early warning system.
This KPI is for operators who want to proactively manage customer satisfaction and reduce churn before it impacts revenue. It trades away hard financial data in favor of subjective customer feedback, which requires additional analysis to act upon. Compared to Monthly Churn, NPS provides the why behind cancellations while churn shows the how many. Operators who ignore NPS may discover retention problems only after they have already lost significant membership revenue.
How we ranked these
The ranking was determined by weighting each KPI's direct impact on revenue growth and profitability for car wash operations. Metrics like ARPM, Monthly Churn, and Wash Frequency were given the highest weight due to their strong correlation with recurring revenue and long-term customer value. Operational efficiency KPIs such as Cost Per Wash and Labor Cost Per Car were weighted based on their influence on margin.
Conversion Rate and Utilization Rate were weighted for their role in driving top-line growth. NPS was weighted as a leading indicator of churn and customer loyalty.
KPIs that are standard in other retail sectors but less relevant to the car wash's unique subscription-heavy, capital-intensive model were deliberately ignored. This includes metrics like inventory turnover and same-store sales growth without seasonal adjustment. The ranking also excluded vanity metrics that don't directly tie to financial performance, such as social media engagement.
The focus was strictly on operational and financial metrics that car wash operators can directly influence and that have a proven impact on revenue and profitability.
Related questions
What are the key sales KPIs for the Mobile Fleet Car Wash & Detailing Services industry in 2027?
For mobile fleet car wash services, key sales KPIs include contract value, number of active accounts, and revenue per account. Tracking customer acquisition cost (CAC) and lifetime value (LTV) is crucial. Also important are service frequency per account, upsell rate for additional detailing services, and the percentage of recurring revenue from long-term contracts. These metrics help gauge sales efficiency and account growth.
What are the top 10 car rental company revenue KPIs?
Top car rental revenue KPIs include fleet utilization rate, average daily rate (ADR), revenue per available car (RevPAC), and utilization per day. Other key metrics are average rental duration, ancillary revenue per rental (e.g., insurance, GPS), and fleet cost per unit. Customer acquisition cost and repeat rental rate are also vital for assessing long-term revenue stability and growth.
What are the best KPIs for used car dealerships in 2027?
For used car dealerships, critical KPIs include gross profit per vehicle, days-to-turn inventory, and used car department net profit. Also important are conversion rate of leads to sales, average finance and insurance (F&I) product penetration, and customer satisfaction scores. Tracking cost-to-market adjustment and wholesale vs. retail sales ratio helps optimize inventory and pricing strategies.
What are the best KPIs for car washes in 2027?
The best KPIs for car washes in 2027 focus on the hybrid subscription and one-time transaction model. Key metrics include Average Revenue Per Member (ARPM), monthly churn rate, and wash frequency. Operational efficiency is measured by cost per wash, labor cost per car, and water/chemical cost per car. Conversion rate and utilization rate drive top-line growth, while NPS indicates customer loyalty.
What are the top 10 solar panel installation revenue KPIs?
Top solar panel installation revenue KPIs include installed capacity (kW), revenue per installation, and average system price. Also crucial are customer acquisition cost (CAC), sales cycle length, and lead conversion rate. Tracking the percentage of revenue from referrals and repeat customers, along with the cost per watt installed, helps assess profitability and market competitiveness.
What are the top 10 cruise line revenue KPIs?
Top cruise line revenue KPIs include occupancy rate, net revenue per passenger cruise day (Net RevPCD), and onboard revenue per passenger. Other key metrics are ticket revenue per passenger, ancillary spending (e.g., excursions, beverages), and repeat passenger rate. Also important are cost per available lower berth (ALB) and gross yield, which measure overall revenue generation against capacity and costs.
FAQ
What is the most important KPI for a new car wash?
For a new site, Conversion Rate is king. If you can’t convert drive-bys into washes, nothing else matters. Target 25%+ in the first 90 days.
How do I calculate ARPM accurately?
Total monthly membership revenue divided by the number of active members on the last day of the month. Exclude one-time washes. Mister Car Wash uses this exact formula.
What is a good churn rate for a car wash subscription?
Below 5% monthly is excellent. 4% is world-class (e.g., Tommy’s Express). Above 7% is a red flag.
How much does water reclamation cost?
A system from PurClean or Sonny’s costs $30K–$80K installed. Payback is typically 12–18 months via reduced water costs.
What software do car washes use for KPI tracking?
DRB Systems, Washify, PDQ, and RevoTrack are the most common. For dashboards, Power BI or Tableau are used.
How often should I review NPS?
Weekly. A sudden drop in NPS often precedes a spike in churn by 2–4 weeks.
What is a typical wash frequency for unlimited members?
Typical frequency is 2.5–4 washes per month for members. If frequency exceeds 4, margins can compress because the fixed membership fee doesn’t cover the variable costs.
What is the target cost per wash (CPW)?
Target CPW is $2.50–$4.50 per wash. If CPW exceeds $5, margins are thin. Water reclamation can cut water costs by 70%–80%, directly lowering CPW.
How does seasonality affect car wash KPIs?
In the northern US, wash volume can drop 40%–60% in winter. In the south, summer storms can crush volume. A 'good' month in July might be 15,000 cars, while a 'good' month in January might be 6,000. KPIs must be seasonally adjusted and often reported on a trailing 12-month basis.
What is a good utilization rate for a tunnel wash?
Realistic utilization is 40–70 cars per hour on average. If utilization drops below 30, the wash is underperforming. The theoretical max is 80–120 cars per hour depending on conveyor speed.
Sources
- https://www.mistercarwash.com/investors
- https://www.tommysexpress.com/membership
- https://www.drbsystems.com
- https://www.sonnysdirect.com
- https://www.purclean.com
- https://www.7shifts.com
- https://www.medallia.com
- https://www.wheniwork.com
- https://www.hubspot.com
- https://www.salesforce.com
Related on PULSE
This page will be disappearing soon. Save it to your device for $1 — or read it free while it is here.
@Kory-White- · if Venmo asks, the last 4 of my number are 2012
This page is gone.
This one is off the shelf now. $1 keeps it on your phone for good — the whole page, pictures and diagrams included.
 pulse-industry-kpisTop 10 Dental Practice Revenue KPIs in 2027
 pulse-industry-kpisTop 10 Fitness Center Revenue KPIs in 2027
 pulse-industry-kpisSession Revenue Per Player in Free-to-Play Mobile Gaming in 2027
 pulse-industry-kpisTop 10 Med Spa Revenue KPIs in 2027
 pulse-industry-kpisTop 10 Mobile Gaming Revenue KPIs in 2027
 pulse-industry-kpisCustomer Acquisition Cost vs. Lifetime Value in SaaS Startups in 2027
 pulse-industry-kpisTop 10 Banking Return on Assets and Net Interest Margin KPIs in 2027
 ikWhat are the most common mistakes in Industry KPIs in 2027?
 pulse-industry-kpisTop 10 Insurance Loss Ratio and Combined Ratio Benchmarks in 2027
 pulse-industry-kpisRevenue per Brewery Barrel: Craft Beer Production and Wholesale Pricing in 2027