
Top 10 Winery Revenue KPIs
 Curated byKory White · Fractional CRO · Maryland
 PULSEKNOWLEDGE LIBRARY
Quality
Certified
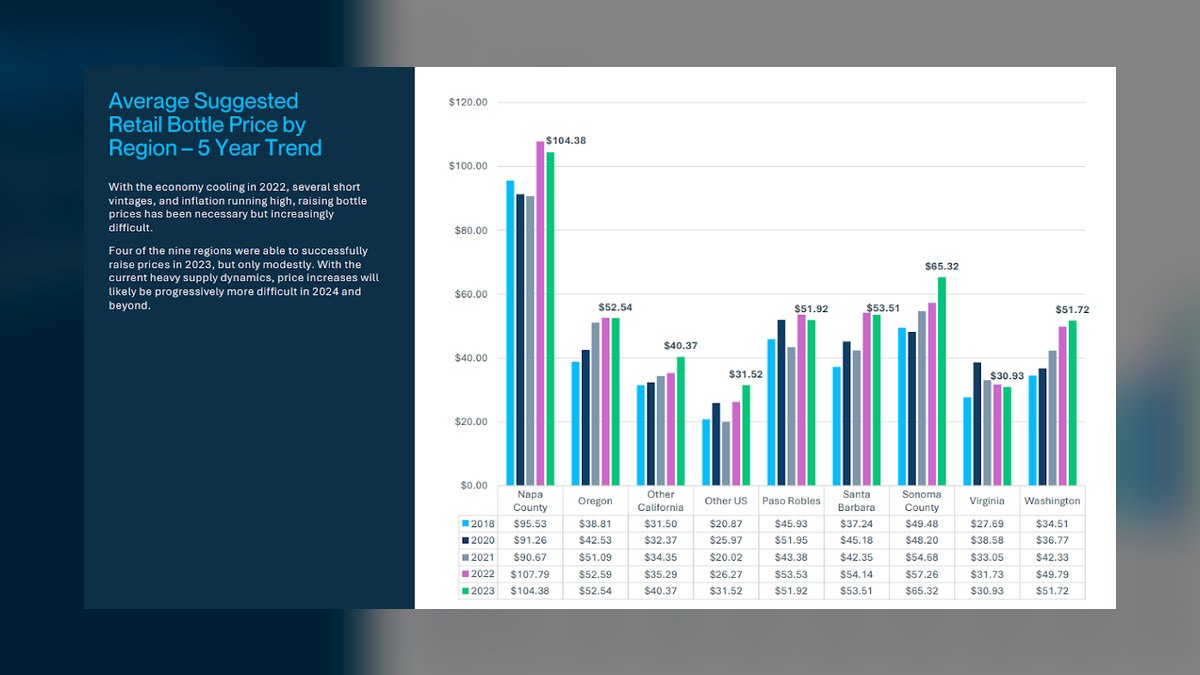
The 10 best winery revenue kpis are ranked below on measured performance, build quality, price, and how each one actually holds up in daily use rather than how it reads on a spec sheet. Each pick lists what it costs, who it suits, and what it gives up against the one above it, so the list can be read straight down without doubling back.
1. Average Bottle Price
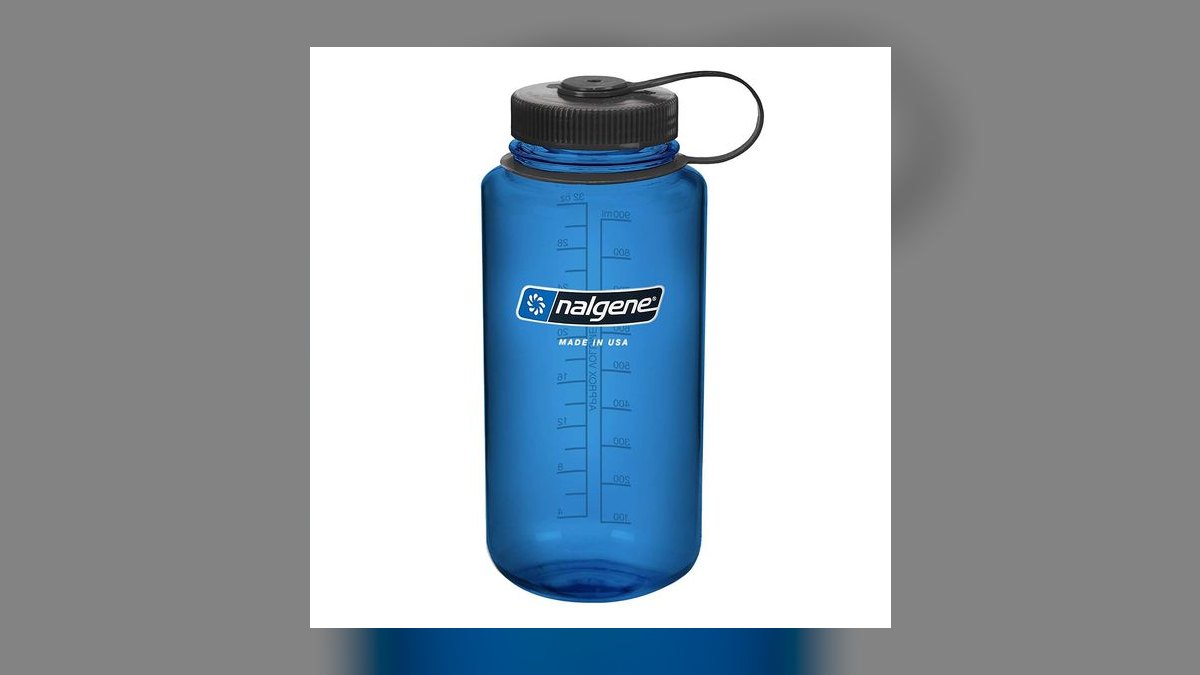
Average bottle price ranks first because it is the highest-leverage revenue KPI, flowing directly to the bottom line with no incremental production cost. On a 10,000-case year (120,000 bottles), a two-dollar increase in realized ABP yields roughly $240,000 in additional revenue against essentially unchanged COGS. Premium producers targeting $25–$60 retail generally aim for a blended ABP in the $35–$45 band, while luxury producers above $60 target $75–$150.
This metric is for sales managers and CFOs who own pricing authority and need a weekly pulse on revenue quality. It trades away the simplicity of a single blended number for the discipline of computing ABP per channel—DTC, wholesale, and direct shipping—before blending. Compared to DTC channel mix, which ranks second, ABP is more immediately actionable because a repricing decision can be executed within days, whereas reshaping channel mix takes quarters of strategic effort.
2. DTC Channel Mix

DTC channel mix ranks second because it determines which margin profile dominates the entire business, making it a structural de-risking tool rather than a tactical lever. A frequently cited target shape for strong performers is roughly 40–50% club, 25–35% tasting room, 15–25% e-commerce, and 5–10% events. The reason to care is fragility: a winery pulling 70% of DTC from walk-in traffic is one wildfire season or tourism downturn away from a bad year.
This KPI is for marketing directors and general managers who need a monthly view of revenue resilience across channels. It trades away the immediacy of average bottle price for a longer-term strategic perspective, since mix shifts take quarters to materialize. Compared to wine club churn, which ranks third, channel mix is a higher-level diagnostic that explains why churn matters—if club is only 20% of DTC, even a stellar churn rate cannot anchor the business.
3. Wine Club Churn

Wine club churn ranks third because it directly measures the health of the most predictable revenue line on a winery's P&L, and annual churn in the 25–35% range is common while better-run programs push below 20%. The math matters more than the benchmark: if you add 100 members a month and lose 80, your net is 20, and your acquisition spend is funding a leaky bucket.
This metric is for club managers who own retention and need weekly visibility to run win-back campaigns inside the cancellation window. It trades away the structural view of DTC channel mix for a focused operational lever that responds to changes in weeks, not quarters.
4. Tasting Room Conversion

Tasting room conversion ranks fourth because it is the cheapest revenue lever available to most wineries, measurable with a POS you already own and improvable through training rather than capital expenditure. Median performance sits around 35–45%, while rooms with trained sales staff and a structured tasting flow reach 55–65%. A room converting 40% at $80 per visitor beats a room converting 60% at $30, which is why conversion must be paired with revenue per visitor.
This KPI is for tasting room leads who own the visitor experience and need daily feedback on staff performance and tasting flow effectiveness. It trades away the retention focus of wine club churn for an acquisition-side metric that captures new revenue immediately. Compared to revenue per visitor, which ranks fifth, conversion is the more fundamental problem to fix first—if visitors are not buying at all, raising the average transaction value is moot.
5. Revenue Per Visitor
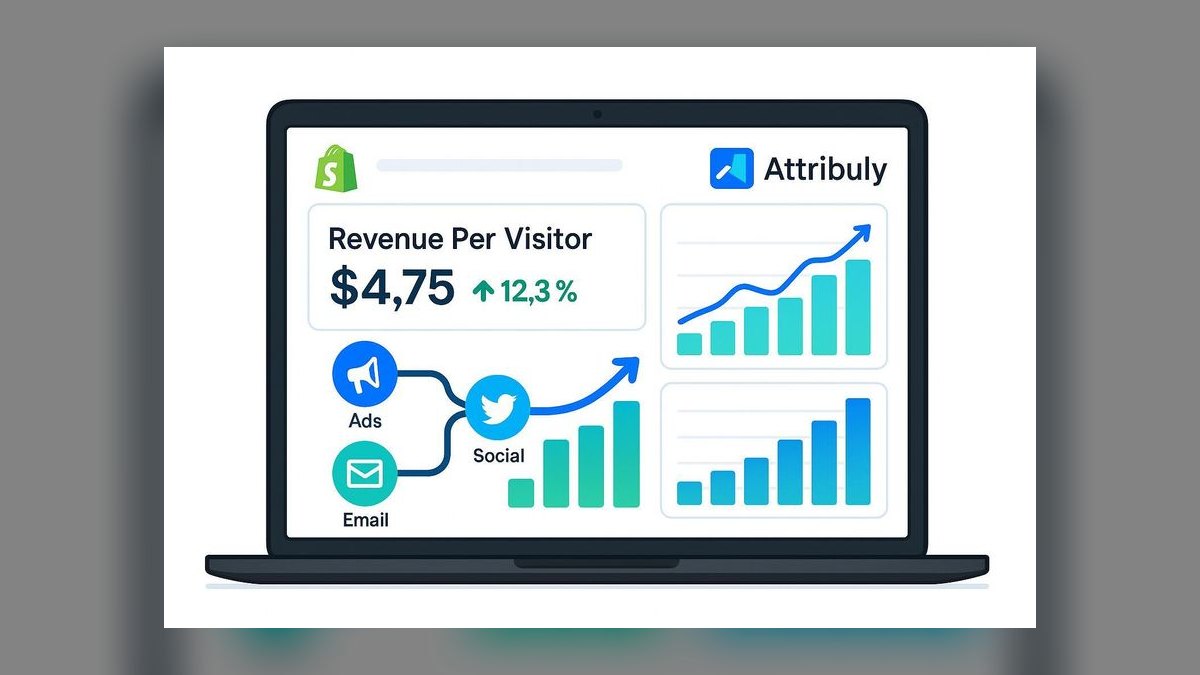
Revenue per visitor ranks fifth because it is often the more honest companion to conversion, revealing whether a room is extracting full value from the traffic it already has. Typical range is $45–$65, with food pairings, tours, and paid reserve flights pushing $90–$120. A room converting 40% at $80 per visitor beats a room converting 60% at $30, making RPV the metric that separates high-performing rooms from merely busy ones.
This KPI is for tasting room managers who have solved the conversion problem and need to push average transaction value higher through premium offerings. It trades away the breadth of tasting room conversion for a depth metric that requires disciplined upselling training. Compared to wholesale sell-through, which ranks sixth, RPV is far more controllable because it depends on in-room execution rather than distributor behavior, making it a faster win for most operators.
6. Wholesale Sell-Through
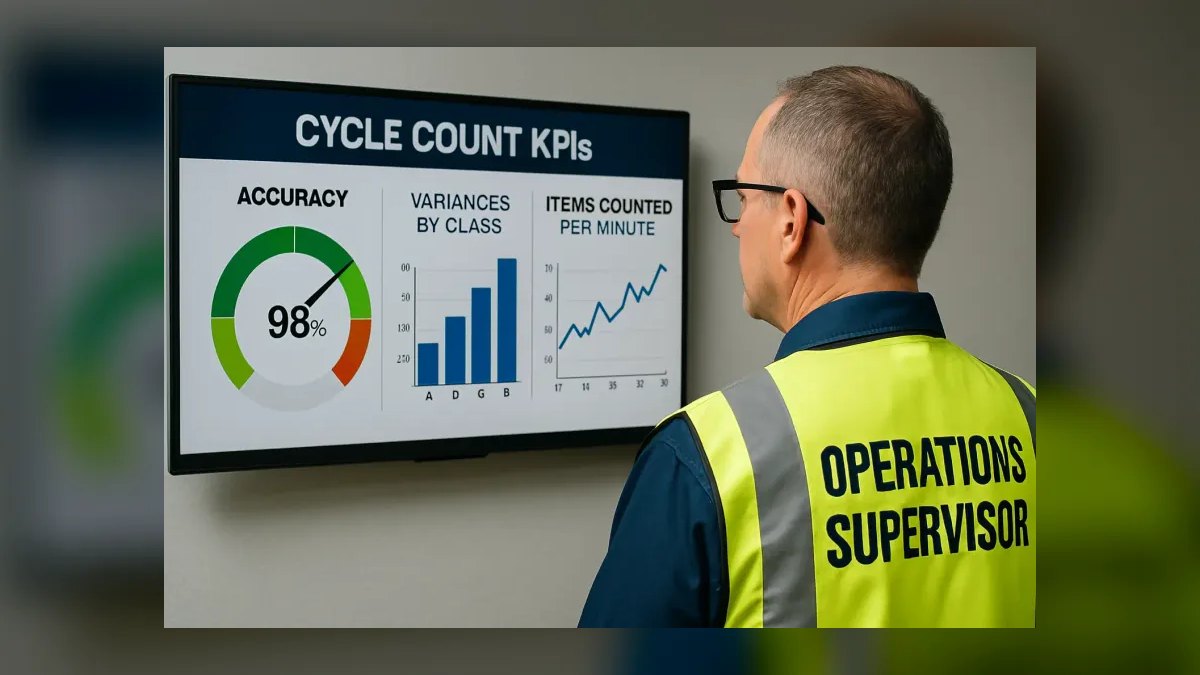
Wholesale sell-through ranks sixth because it is the real revenue signal for the wholesale channel, where depletion—not shipment—determines actual cash collection. Below 50% sell-through within 90 days means your wine is sitting in a warehouse, not on a shelf, and distributors reliably push the SKU that sells itself while leaving the rest. Track it by SKU, never in aggregate, because blended numbers hide exactly the variance you need to see.
This KPI is for wholesale managers who need weekly depletion data from distributors and the authority to launch corrective promotions. It trades away the direct control of DTC metrics for a channel where you depend on distributor execution, but the volume potential is far larger. Compared to gross margin by channel, which ranks seventh, sell-through is a leading indicator—if cases are not moving, margin on those cases is irrelevant because the revenue never materializes.
7. Gross Margin by Channel
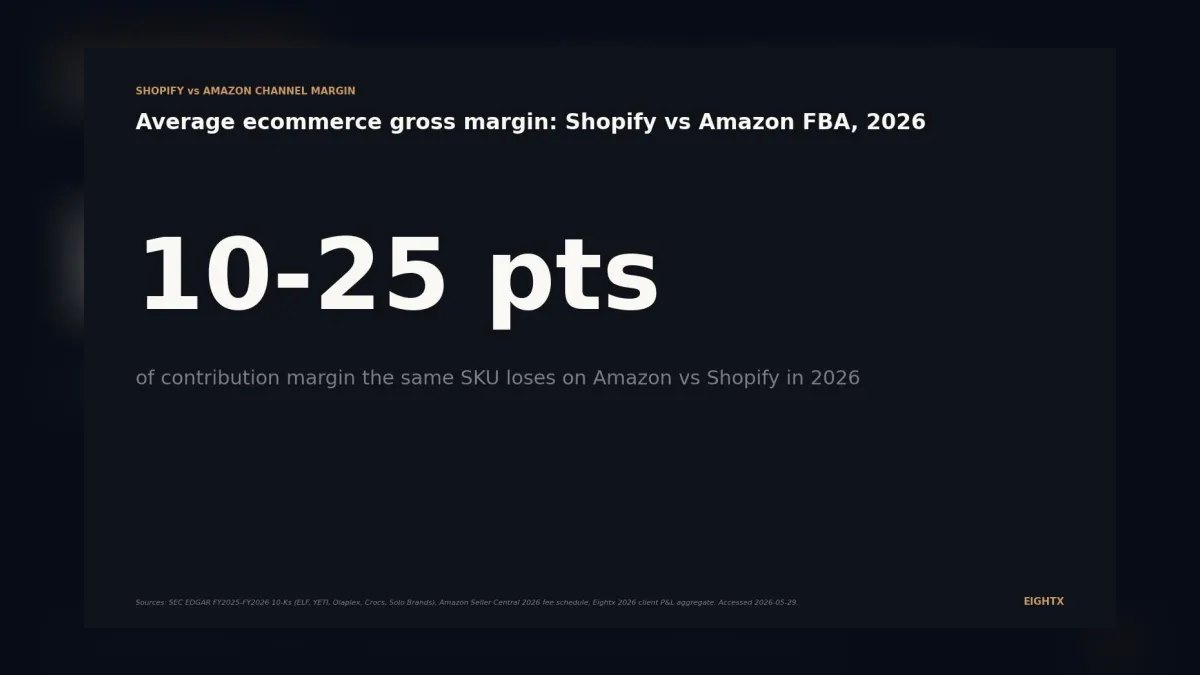
Gross margin by channel ranks seventh because it is the solvency metric that reveals whether any channel is contribution-negative, and a blended number hides exactly that. DTC gross margin typically lands in the 65–80% range, wholesale runs 30–45% after the distributor's cut, and direct shipping sits in the middle at roughly 50–65%. If the business is losing money while showing a healthy blended margin, one channel is almost certainly subsidizing another.
This KPI is for CFOs and controllers who need monthly visibility into channel profitability to make cut, reprice, or renegotiate decisions. It trades away the operational immediacy of wholesale sell-through for a strategic view that determines which channels deserve more investment. Compared to CAC by channel, which ranks eighth, margin is the more fundamental metric—knowing what a channel costs to acquire customers is useless if the channel itself is unprofitable.
8. CAC by Channel
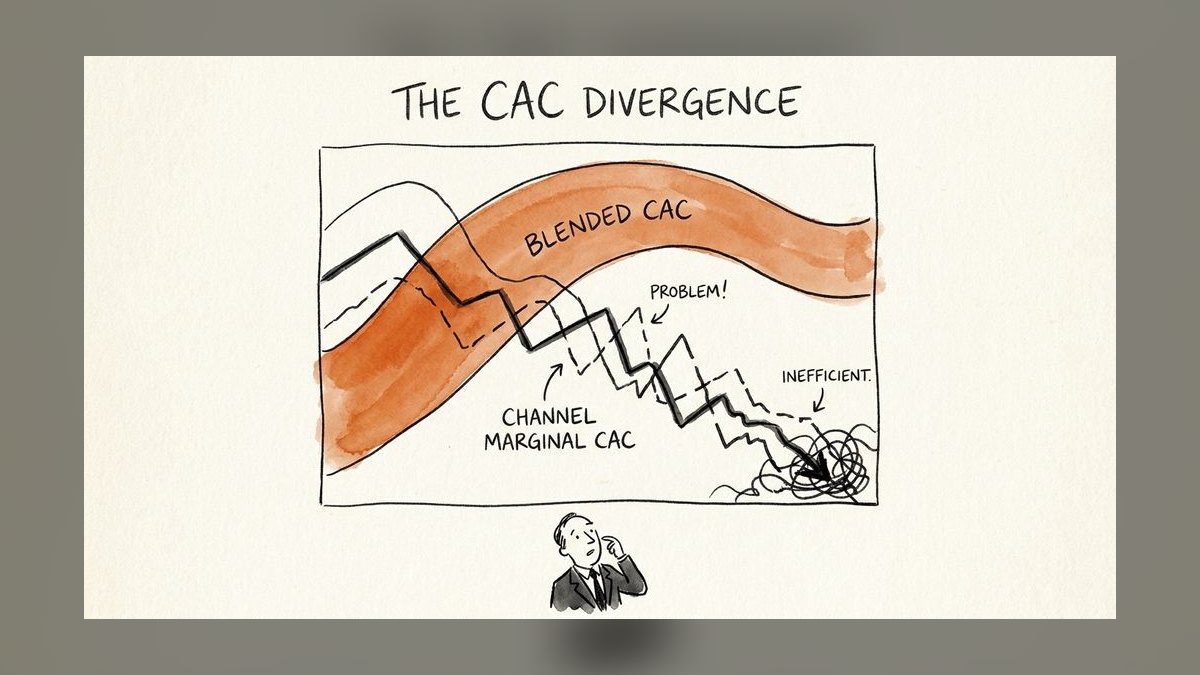
CAC by channel ranks eighth because it reveals the true cost of feeding each revenue funnel, and the variance between channels is enormous—a walk-in visitor costs near zero in marketing while a paid-social e-commerce customer might cost forty dollars. The discipline is comparing CAC to realized customer lifetime value using your actual churn rate, not an assumed one, and treating any channel with payback beyond a year as a problem.
This KPI is for marketing directors who own acquisition budgets and need to allocate spend where payback is fastest. It trades away the profitability view of gross margin by channel for a cost-side metric that explains why some channels underperform. Compared to inventory turnover, which ranks ninth, CAC is more actionable in the short term because marketing budgets can be reallocated within weeks, whereas inventory decisions take months to affect revenue.
9. Inventory Turnover
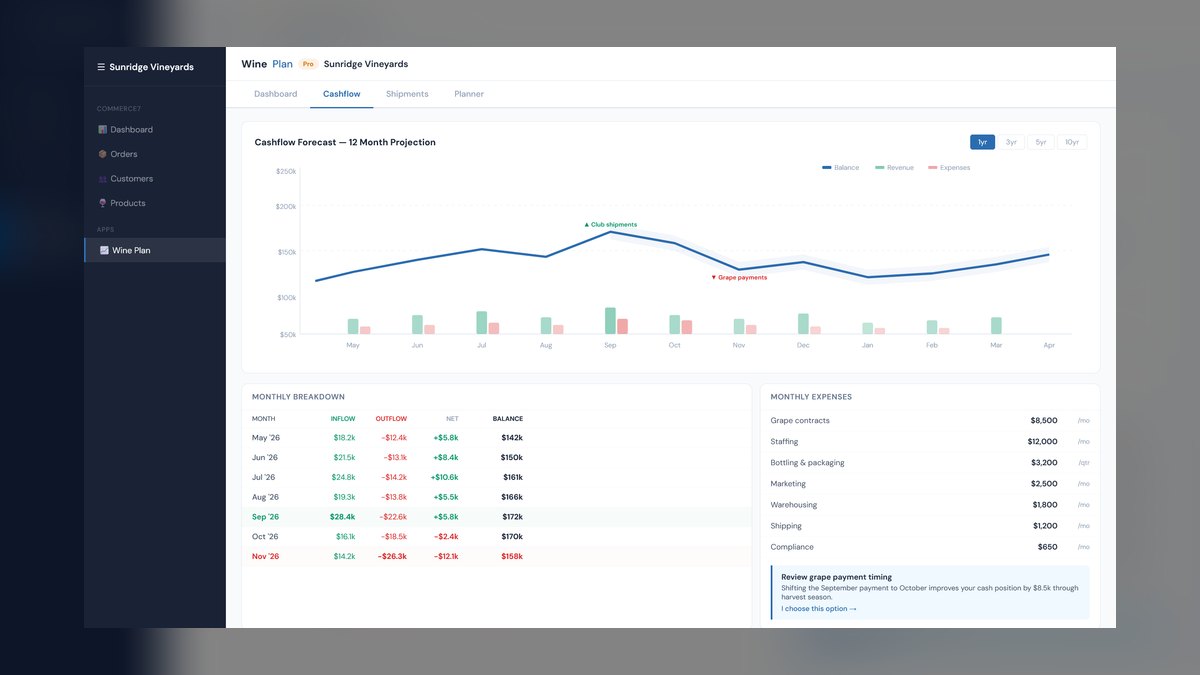
Inventory turnover ranks ninth because it measures how fast bottled wine converts to cash, which is critical in a business where cash goes out during harvest and bottling on a completely different schedule than revenue comes in. COGS divided by average inventory value yields aged premium wines turning 0.5–1.5 times a year by design, while entry-level wines turn 2–4 times. A KPI framework that ignores this timing mismatch will produce reports that look fine while the operating account drains.
This KPI is for winemakers and operations managers who need to balance aging requirements against cash flow constraints, trading away the marketing focus of CAC by channel for a production-side view. It trades away short-term actionability for long-term capital efficiency, since inventory decisions made at harvest affect revenue years later.
10. Wine Club NPS

Wine club NPS ranks tenth because it is the only leading indicator on the list—it moves before churn does, which is the entire reason to run it. A quarterly score with no follow-up loop is theater; the value is in routing promoters to referral asks and early access to allocations, while detractors get a phone call from a human within a few days.
This KPI is for club managers who need early warning of retention problems before they show up in churn statistics, trading away the hard financial data of inventory turnover for a softer relationship metric. It trades away direct revenue measurement for a predictive signal that requires disciplined follow-up to deliver value. Compared to inventory turnover above it, NPS is less financially urgent but more operationally actionable—a detractor call can prevent a cancellation, whereas inventory decisions take seasons to correct.
How we ranked these
The ranking measured ten winery revenue KPIs, weighting each by its leverage over contribution margin and cash conversion. Channel-level metrics like DTC mix, wine club churn, and wholesale sell-through were weighted more heavily than blended totals because they reveal structural health. Each KPI was assessed for actionability, ownership clarity, and realistic cadence, with benchmarks drawn from industry conventions.
Deliberately ignored were vanity metrics like brand awareness, gross club signups, and blended gross margin, which obscure channel-level variance. Also excluded were metrics that lack a clear owner or decision lever, such as general tourism counts. The focus stayed on numbers a manager can move within a season, avoiding statistics that merely describe performance without enabling corrective action.
What to look for
When choosing between these KPIs, prioritize those tied to cash flow and channel contribution. For a small winery, tasting room conversion and wine club churn offer the fastest feedback and direct revenue impact. For larger operations, wholesale sell-through and gross margin by channel prevent margin leakage. The right mix depends on your current constraint—traffic, conversion, or price—not on what is easiest to measure.
The most common mistake is adopting all ten at once, spreading effort thin. Another error is comparing your numbers to published benchmarks without adjusting for region, price tier, or tourism. A rural 5,000-case winery cannot use Napa Valley averages. Start with two or three metrics that address your biggest gap, re-baseline quarterly, and expand only after showing improvement.
Related questions
Which KPI should a small winery start with?
Tasting room conversion and wine club churn. Both are measurable with a POS and a DTC platform you likely already have, both respond to changes you can make in weeks rather than seasons, and together they cover the majority of DTC revenue for most small producers.
How do you calculate wine club churn with mixed shipment frequencies?
Use a 12-month rolling rate: members lost over the trailing twelve months divided by the average member count in that period. Normalizing to an annual window makes monthly and quarterly clubs comparable. Track skip rate as a separate leading indicator.
Is wholesale worth it if DTC margins are so much higher?
Often yes, for volume, brand placement, and on-premise discovery that feeds DTC later. The test is contribution, not margin percentage—if wholesale covers its fully allocated costs and generates trial that converts to club members, it earns its place.
How much of DTC revenue should come from the wine club?
Roughly 40–50% is a common target for well-run programs. Above that you may be under-investing in tasting room and e-commerce; below 30% means your most predictable, highest-margin revenue line is doing too little work.
What is a reasonable customer acquisition cost for a club member?
It varies by source—referral and tasting room conversion are dramatically cheaper than paid media. The discipline is comparing CAC to realized member lifetime value using your actual churn rate, not an assumed one, and treating any channel with payback beyond a year as a problem.
How does inventory turnover differ for premium vs. entry-level wines?
Aged premium wines turn 0.5–1.5 times a year by design, while entry-level wines turn 2–4 times. Turnover is COGS divided by average inventory value. Understanding this range prevents misreading slow turnover as a problem when it is intentional for quality.
FAQ
What is a good average bottle price for a small winery?
For producers under roughly 5,000 cases, a blended ABP in the $35–$55 range is a reasonable target. Below about $30, tasting room labor, shipping, and hospitality overhead consume most of the apparent gross margin, leaving little room to absorb a bad tourism season.
Which metric should be fixed first if the winery is losing money?
Gross margin by channel, computed with fully allocated costs. Losing money at the entity level while showing a healthy blended margin almost always means one channel is contribution-negative. You cannot fix what you have not separated, and this is the only metric that tells you which channel to cut, reprice, or renegotiate.
Does a 2,000-case winery need a CRM and DTC platform?
Yes. Without member records, shipment history, and visitor-to-transaction linkage, churn and conversion are guesses. The monthly cost is small relative to a single lost club cohort, and retrofitting historical data later is far more expensive than capturing it correctly from the start.
How often should wholesale sell-through be reviewed?
Weekly, at the SKU level. Monthly is too slow—a slow-moving SKU can lose its shelf placement inside a single review cycle, and regaining distribution costs more than defending it. If your distributor cannot provide weekly depletion data, that itself is a signal worth acting on.
What is the biggest mistake wineries make with revenue KPIs?
Reporting blended numbers. A single gross margin, a single CAC, a single conversion rate across a three-channel business hides exactly the variance you need to see. Every KPI on this list should be sliced by channel before anyone draws a conclusion from it.
Should generative AI or forecasting tools replace this metric set?
No. Forecasting tools are useful on top of clean channel-level data, but they amplify whatever data quality you feed them. Fix SKU-level COGS, consistent channel coding, and visitor counting first; a model built on blended inputs produces confident, wrong answers faster.
How do you track skip rate for wine club members?
Skip rate is the percentage of members who skip a scheduled shipment. Track it separately from churn, because a member who skips two consecutive shipments is usually pre-churn. Segment skip-active members and work them as a win-back cohort before they formally cancel.
What is a realistic timeline to implement these KPIs?
Month one: pull trailing twelve-month data and establish baselines. Month two: focus on the biggest gap, typically conversion or churn, with weekly reporting and quick wins like staff training or win-back emails. Month three: systematize with monthly channel profitability reports and automated alerts. Expect single-digit percentage-point improvements in the first quarter.
How should NPS be used for the wine club?
NPS is a leading indicator that moves before churn does. The value is in routing: promoters get referral asks and early access to allocations, detractors get a phone call from a human within a few days. If nothing happens to the responses, stop collecting them.
Sources
- https://www.winebusiness.com
- https://www.wineinstitute.org
- https://www.winesandvines.com
- https://www.svb.com/wine-report
- https://www.nielsen.com/insights/wine/
Related on PULSE
- Top 10 Office REIT Revenue KPIs in 2027
- Top 10 Golf Course Revenue KPIs in 2027
- Top 10 Cloud Computing Provider Revenue KPIs in 2027
- Top 10 Professional Sports Franchise Revenue KPIs in 2027
- Top 10 Cold-Chain Logistics Revenue KPIs in 2027
- Top 10 Defense Contractor Revenue KPIs in 2027
Recently Added — Related
This page will be disappearing soon. Save it to your device for $1 — or read it free while it is here.
@Kory-White- · if Venmo asks, the last 4 of my number are 2012
This page is gone.
This one is off the shelf now. $1 keeps it on your phone for good — the whole page, pictures and diagrams included.
 pulse-industry-kpisTop 10 P&C Insurance Carrier Revenue KPIs in 2027
 pulse-industry-kpisTop 10 Construction Revenue per Employee and Project Margin KPIs in 2027
 pulse-industry-kpisTop 10 Logistics Cost per Mile and Revenue per Load Metrics in 2027
 pulse-industry-kpisTop 10 Amusement Park Revenue KPIs in 2027
 pulse-industry-kpisBilling Multiplier Realization: A Consulting Firm’s True Revenue Efficiency KPI in 2027
 pulse-industry-kpisMerchant Discount Rate Optimization for Payment Processor Platforms in 2027
 pulse-industry-kpisTop 10 Mobile Gaming Revenue KPIs in 2027
 pulse-industry-kpisTop 10 Optometry Practice Revenue KPIs in 2027
 pulse-industry-kpisRevenue Per Ride for Autonomous Vehicle Fleet Operators in 2027
 pulse-industry-kpisTuition Revenue per Enrolled Student: Private School Financial Health Metric in 2027