
How Do I Score My Franchise Locations on the Full Product Mix in 2026?
 Curated byKory White · Fractional CRO · Maryland
 PULSEKNOWLEDGE LIBRARY
Quality
Certified

Score franchise locations on the full product mix with a weighted scorecard: list every product line the brand expects, assign each a weight reflecting margin and strategy, rate each location 1–5 per line, then sum weight × level into one composite. That composite — not total sales — drives rankings, coaching, and bonuses.
What full-mix scoring is and why total sales hides the problem
A full-mix score is a single composite number per location, built from separate ratings on every product line or behavior the brand expects a complete unit to run. It is not a revenue ranking. Revenue rankings answer "who sold the most dollars," and in a franchise system that question is mostly answered by trade area, daypart traffic, and drive-time population — variables the franchisee does not control. A full-mix score answers a different and far more useful question: "who is running the whole playbook the brand licensed to them?"
The distinction matters because a high-traffic location can post a strong top line while quietly ignoring everything except the hero item. A drive-thru unit doing heavy morning volume on one core beverage can rank top-five in the system on sales and simultaneously be the worst unit in the system on attach, on the limited-time offer, on loyalty enrollment, and on the higher-margin add-on that carries most of the brand's four-wall profit. Under a sales ranking, that operator is a star and gets left alone. Under a mix score, that operator is a coaching priority. Same store, same data, opposite conclusion — and the mix conclusion is the one that grows franchisee profit.
The economics behind this are straightforward. In most multi-unit systems, product lines carry sharply different contribution margins. Core traffic-drivers are frequently priced near-competitively and carry the thinnest margin because they exist to get people in the door. Add-ons, upsizes, service plans, memberships, and merchandise typically carry materially higher margin per transaction because they ride on traffic that has already been paid for through rent, labor, and marketing. When a location sells only the traffic-driver, it converts the expensive part of the business — getting the customer to show up — into the least profitable possible transaction. The location looks busy and earns thin.
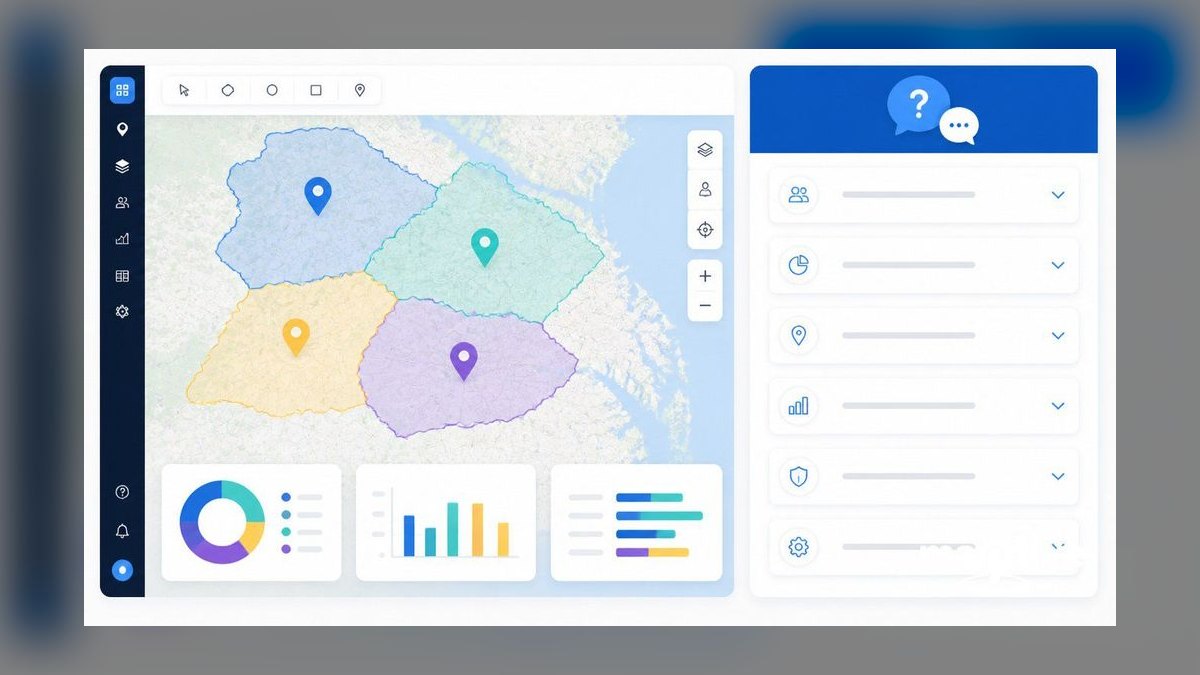
There is a second reason franchisors specifically need this, distinct from what a corporate-owned chain needs. A franchisor's leverage over an independent operator is limited to what the agreement, the brand standards, and the relationship allow. You generally cannot order a franchisee to change their behavior the way you can order a company-store manager. What you can do is make performance legible. A published, weighted, system-wide score creates peer comparison, and peer comparison is the strongest behavioral lever available in franchising. Operators who ignore a memo will not ignore a ranked list where their unit sits in the bottom quartile and every other owner in the region can see it.
Finally, the score gives the field consultant a pre-loaded agenda. Without it, a field visit starts with an hour of discovery — pulling reports, asking what's going on, guessing. With it, the consultant walks in already knowing the two lines that unit is weakest on relative to peers with similar volume, and the visit starts at minute one on the actual problem. Across a 200-unit system with quarterly visits, that recovered hour per visit is roughly 800 hours a year of field capacity redirected from diagnosis to coaching.
Building the scorecard step by step
Step one: enumerate every line, not just the hero. Write down each product category and revenue behavior a complete unit should run. Most systems land at eight or nine lines — enough to cover the real mix, few enough that operators can hold it in their heads. A typical food-service set: core menu, higher-margin add-ons, limited-time offer or seasonal item, attach/upsell rate, loyalty or app enrollment, catering or off-premise, merchandise, and store-level activity such as local marketing execution. A home-services brand swaps those for core service call, diagnostic-to-repair conversion, premium part or equipment tier, maintenance agreement sales, financing attach, add-on service capture, membership renewal, and technician-generated leads. A fitness brand runs core membership, premium tier upgrade, personal training attach, retail and supplements, class package sales, guest pass conversion, and retention. The nouns change; the structure does not. The rule that governs the list: if it is not on the matrix, operators will not chase it.

Step two: weight the lines with franchise leadership, not alone. Weights are a strategy statement, and they will be argued with, so they need ownership from operations, marketing, and finance jointly. Weight on three inputs — contribution margin per unit sold, strategic priority for the current period, and the degree to which the line is actually within the operator's control. That third input is the one most people skip and the one that determines whether franchisees accept the score. A line heavily driven by trade-area demographics deserves a lower weight than one driven purely by whether the crew asks the question at the counter. Practical ranges: no single line above roughly 25–30% or the composite collapses back into a one-metric ranking, and no line below about 5% or it is noise the operator will correctly ignore. Weights must total 100%.
Step three: define the 1–5 levels in observable terms before you score anything. This is where most scorecards die. "Level 4 on add-ons" means nothing until it is written down. Define each level against a measurable threshold — attach rate, units per thousand transactions, penetration versus system median, or percentage of a set target. A workable convention: level 1 is bottom decile of the system, level 2 is below median, level 3 is at or near median, level 4 is top quartile, level 5 is top decile. Percentile-based levels are self-calibrating as the system improves and immune to the "the target was set wrong" argument. Absolute-threshold levels are clearer to operators but require an annual recalibration. Pick one convention and apply it identically to every line — mixing conventions across lines makes the composite meaningless.
Step four: compute the composite. Composite = Σ(weight × level) across all lines. With weights as decimals summing to 1.0 and levels on 1–5, the composite lands between 1.00 and 5.00, which is easy for operators to reason about. A worked example on six lines: core menu weighted 0.25 at level 5 contributes 1.25; add-ons weighted 0.20 at level 1 contributes 0.20; the seasonal offer weighted 0.15 at level 2 contributes 0.30; attach rate weighted 0.15 at level 1 contributes 0.15; loyalty enrollment weighted 0.15 at level 2 contributes 0.30; local marketing weighted 0.10 at level 3 contributes 0.30. Composite: 2.50. That unit is a level 5 on the item everyone notices and lands at the middle of the scale — which is the entire point of the design. Its neighbor running straight 3s across every line scores 3.00 and outranks it.

Step five: publish and wire it. The score does nothing sitting in a finance folder. It has to appear where operators already look — the system ranking, the field visit agenda, and any variable component of what they earn or receive.
Effort, timelines, and what the numbers typically look like
The build is smaller than people expect and the maintenance is larger. Expect roughly two to four weeks from decision to first published score in a system of any size, and the bottleneck is almost never the math.
Week one goes to line selection and weighting. This is two or three working sessions with operations, marketing, and finance in the room together. Budget more time than seems necessary — the weighting conversation is where a franchisor discovers its leadership does not actually agree on what the brand is selling. That argument is worth having and is arguably more valuable than the scorecard it produces.

Week two goes to data plumbing. Every line needs a defensible source: POS category sales, loyalty platform enrollment counts, the franchise management system for compliance and activity items. The realistic friction is that two or three lines will have no clean system of record — local marketing execution and merchandising standards are the usual offenders — and you will have to either accept a field-consultant observation score for those lines or drop them from version one. Dropping them is usually the right call. A six-line score everyone trusts beats a nine-line score with three fabricated inputs.
Week three goes to level calibration against trailing data. Score the whole system retroactively on the last two or three completed quarters before you publish anything. You are checking two things: that the composite distribution is not clustered (if 80% of units land between 2.9 and 3.1, the levels are too loose to discriminate) and that the ranking does not simply reproduce the sales ranking. If the composite correlates near-perfectly with total revenue, the weights are still concentrated on volume-driven lines and need rebalancing toward controllable, penetration-based lines.
Week four is the operator rollout. Publish the methodology before the first scores. Every franchisee should be able to reconstruct their own number from their own reports — if they cannot, they will dispute it, and a disputed score is a dead score.

On tooling cost: a spreadsheet genuinely works for the first several quarters and for systems under roughly 50 units. The composite is one SUMPRODUCT. The point at which a spreadsheet stops working is not unit count but refresh frequency — when someone is manually rebuilding it monthly, the labor cost exceeds a BI seat. From there the realistic options are a BI layer on existing data (the franchise management system or POS reporting many franchisors already pay for, which usually needs no new license), a general BI tool at typical per-seat rates, or a sales-performance and scorecard platform if you want the leaderboard, TV display, and coaching cadence automated on top of the scoring. Incentive-compensation platforms become relevant only when the composite actually drives payouts and you no longer want that calculated by hand. Vendor pricing in all of these categories is quote-driven and changes often enough that it is worth pricing directly rather than relying on any published figure.
Cadence: score quarterly for most systems, monthly only if you have monthly field contact to act on it. Weekly scoring produces noise — normal week-to-week variance in attach rates on low-count categories will swamp the actual signal, and operators will learn to ignore the number. Annual scoring is too slow to change behavior within a fiscal year. Re-weight on a fixed annual cycle plus whenever a major line launches, and give operators at least 30 days notice before a weight change lands in a scored period.

Realistic movement: expect the bottom quartile to improve fastest, because their gaps are the most fixable — usually signage, a script, staffing at the counter, or simple stock-outs on a category nobody was tracking. A location moving from level 1 to level 3 on a single 20%-weighted line gains 0.40 composite points, which in a tightly-distributed system is often 20 or more rank positions. That visible movement is what sells the system to skeptical operators in quarter two.
Where franchisors get this wrong
Weighting by revenue instead of by margin and control. The most common failure. If weights track how much revenue each line produces, the composite becomes a sales ranking wearing a costume, and the whole exercise reproduces the problem it was built to solve. Weight the add-on that is 6% of revenue and 20% of contribution accordingly.
Too many lines. Fifteen or twenty lines feels rigorous and is operationally useless. Operators cannot act on twenty priorities, so they act on none and the score becomes a report card nobody reads. Eight or nine is the practical ceiling; six is fine.

Levels defined after scoring starts. Defining thresholds while looking at results guarantees they get set where the current distribution is comfortable, which means the score confirms what you already believed. Write the level definitions down, in observable terms, before pulling a single number.
Ignoring trade-area context entirely. The opposite error from weighting by revenue. Some lines genuinely are demand-constrained — a category that simply does not sell in a given market is not an execution failure, and scoring it as one destroys operator trust in the whole instrument. The fix is not to abandon the line but to either weight it lower or score it against a regional peer group rather than the full system. Peer grouping by volume band, market type, or format is worth doing once the score matures.
Publishing the number without publishing the method. A composite that operators cannot reconstruct is experienced as an arbitrary judgment from corporate. Every franchisee should be able to open their own reports and arrive at their own score. Publish the weights, the level thresholds, and the formula together with the ranking, every time.

Wiring the bonus to the composite in period one. Tempting and usually a mistake. Run at least two quarters scored-and-published-but-not-paid so the data errors surface while the stakes are low. There will be data errors — a POS category mapped wrong in one region, a loyalty feed that drops a day. Discovering those after money has moved is expensive in trust.
Never re-weighting. A matrix frozen for three years is a matrix aimed at a strategy the brand has already left behind. The ability to raise a line's weight overnight when marketing launches a premium add-on, and have every operator's composite reflect whether they are actually moving it the next morning, is the main operational advantage of this design over any fixed KPI. Use it — but on a published cadence, not by surprise.
Scoring without routing. A score that does not change where field consultants spend their week is a vanity metric. The composite's real job is triage: it should determine visit order, visit agenda, and which support resource gets deployed.

Choosing the right configuration for your system
The right version of this depends on system size, data maturity, and how much of the operator's economics you are willing to tie to it.
Under 50 units with clean POS category data: build it in a spreadsheet, six to eight lines, percentile-based levels, published quarterly. Do not buy software. The entire value is in the weighting decision and the publication, neither of which requires a platform.
50 to 250 units: the spreadsheet still computes fine but the data refresh becomes the constraint. Move the calculation onto whatever reporting layer the franchise management system or POS already provides before buying anything new. Add peer grouping by volume band around this size, since the spread between a 400k unit and a 2M unit starts distorting absolute-threshold levels.

Above 250 units, or multi-brand: automate the refresh and the distribution. This is where a dedicated scorecard or sales-performance platform earns its cost, mainly through pushing the number to operators and field teams continuously rather than in a quarterly PDF. Keep the weighting decision human and centralized regardless of tooling.
On tying it to money: if the composite drives a bonus, a rebate, marketing-fund support, or reduced fees, the calculation needs an auditable trail and a documented dispute process. That is the point at which incentive-compensation tooling stops being optional. If the composite only drives rankings and coaching priority — which is a perfectly effective design — a spreadsheet and a published methodology are sufficient indefinitely.
On non-food systems: the method transfers unchanged. Replace product categories with service tiers, package levels, or inventory groups. Home services weight maintenance agreements and financing attach heavily because those carry the margin and the lifetime value. Fitness weights premium tier and training attach. Automotive weights the multi-point inspection conversion and the parts tier. The structural test is identical in every vertical: can a unit post a strong top line while scoring badly on the composite? If yes, the weights are right.
Related questions
Should the composite score be public across the whole system?
Yes for rankings and quartiles — peer visibility is the main behavioral lever in franchising. Consider showing full line-by-line detail only to the operator and their field consultant, since public per-line data can embarrass units on demand-constrained categories they cannot control.
How do I score a location that has been open under a year?
Exclude new units from ranked comparison for the first two to four full quarters and score them against opening-cohort benchmarks instead. A ramping unit scored against mature peers produces a meaningless number and a demoralized new franchisee.
What if operators dispute their level on a specific line?
Publish the data source and threshold for every line, and route disputes to a documented review. Most disputes trace to real data problems — miscategorized POS items, a missing feed — and fixing those improves the whole system's score integrity.
Can I use the same weights across every region?
Start with one set of weights system-wide for comparability, then introduce regional peer grouping rather than regional weights. Different weights per region make composites incomparable; peer groups keep one formula while accounting for genuinely different demand.
How does this connect to the field consultant's visit plan?
The composite sets visit order, and the two lowest weighted-line contributions set the agenda. The consultant arrives knowing which two categories to work on, which removes an hour of discovery from every visit.
FAQ
What does scoring on the full product mix actually mean?
It means grading each location on how completely it runs the brand's whole offering — core items, add-ons, seasonal or limited-time offers, loyalty enrollment, service plans — rather than on total dollars. A unit that sells one thing very well and everything else poorly should rank below a unit that runs the whole playbook adequately.
How do I set the weights without guessing?
Weight on three inputs: contribution margin per unit sold, current strategic priority, and how much the line is genuinely within operator control. Keep any single line under roughly 25–30% so the composite does not collapse into a one-metric ranking, keep nothing under about 5%, and make weights sum to 100%.
What composite score should a location be hitting?
On a 1–5 scale with weights summing to 1.0, a 3.00 means the unit is at system median on every line. Most franchisors treat 3.5 and above as strong, 2.5 to 3.5 as the coaching band, and below 2.5 as a support priority. Set your own thresholds from your actual distribution after scoring two trailing quarters.
How often should locations be re-scored?
Quarterly suits most systems. Monthly is defensible only if field contact is also monthly, since a score nobody acts on trains operators to ignore it. Weekly scoring produces noise from normal variance on low-count categories. Re-weight annually plus whenever a major new line launches, with at least 30 days notice.
Should the score drive franchisee compensation or fees?
Eventually, but not immediately. Run at least two quarters scored and published without money attached so data errors surface at low stakes. Once payouts are wired to the composite, you need an auditable calculation trail and a documented dispute process.
Does this work for non-food franchises?
Yes — the structure is vertical-agnostic. Swap product categories for service tiers, packages, or inventory groups. Home services weight maintenance agreements and financing attach; fitness weights premium tiers and training attach. The test is the same everywhere: a high-revenue unit must be able to score badly if it is skipping the mix.
Sources
- https://www.franchise.org/ — International Franchise Association, franchise operations standards and industry research
- https://hbr.org/ — Harvard Business Review, frameworks on retail assortment and multi-location performance measurement
- https://www.sba.gov/ — U.S. Small Business Administration, franchise business fundamentals and performance measurement guidance
- https://www.ftc.gov/business-guidance/industry/franchises — Federal Trade Commission guidance on the Franchise Disclosure Document
- https://restaurant.org/ — National Restaurant Association, foodservice operations research and industry benchmarks
- https://nrf.com/ — National Retail Federation, retail category performance and merchandising research
- https://www.entrepreneur.com/franchises — Entrepreneur, franchise system rankings and multi-unit operations coverage
- https://www.mckinsey.com/ — McKinsey & Company, research on retail assortment strategy and store performance variance
- https://www.qsrmagazine.com/ — QSR Magazine, multi-unit restaurant operations and menu mix reporting
Related on PULSE
- How Do I Know Where, When, and How Many People to Schedule at Each of My Multi-Unit Retail Locations?
- How Do I Get My Bank Staff to Cross-Sell the Full Product Set?
- How Do I Get My Retail Sales Team to Sell the Full Product Line?
- How Do I Get My Sales Reps to Sell the Full Product Line Instead of Just One or Two Products?
- How Do I Get My Distributors to Push the Full Catalog?
- How Do I Get My Distribution Sales Reps to Sell the Full Catalog?
This page will be disappearing soon. Save it to your device for $1 — or read it free while it is here.
@Kory-White- · if Venmo asks, the last 4 of my number are 2012
This page is gone.
This one is off the shelf now. $1 keeps it on your phone for good — the whole page, pictures and diagrams included.
 pulse-qHow Do I Make a Service Fee Tangible So It Adds Real Value in 2026?
 pulse-qWhat Service Fees Should a Junk Removal Company Charge in 2026?
 pulse-qDo I Need a Fractional CRO for My Multi-Unit Retail Business in 2026?
 pulse-qHow Do I Calculate the Right Service Fee to Charge in 2026?
 pulse-qHow Many Sales Reps Do I Need to Hire for My SaaS Company to Hit Next Year''s Goal in 2026?
 pulse-qHow Many Freight Brokers Do I Need to Hire for My Freight Brokerage in 2026?
 pulse-qHow Many Agents Do I Need to Recruit for My Real Estate Brokerage to Grow Production in 2026?
 pulse-qHow Many Sales Reps Do I Need to Hire for My Prefab Home Builder in 2026?
 pulse-qHow Many Employees Should I Schedule Each Shift at My Skate Park in 2026?
 pulse-qHow Do I Figure Out How Many Reps to Schedule at Each of My Multi-Unit Cell Phone Stores in 2026?