
How Do I Score My Sales Reps Across Multiple KPIs in 2026?
 Curated byKory White · Fractional CRO · Maryland
 PULSEKNOWLEDGE LIBRARY
Quality
Certified

Score reps with a weighted composite, not a flat average. List six to nine KPIs, assign each a weight reflecting business priority, rate every rep 1–5 per line, then sum weight × level into one number. Weighted scoring across multiple KPIs stops volume-only winners and makes sales performance genuinely comparable.
The outcome you should expect
The first thing a weighted multi-KPI scorecard buys you is separation. Under a flat average, reps cluster in a narrow band around the middle, because a high score on an easy line quietly cancels a low score on a hard one. When you weight the lines, that cancellation stops working. A rep who logs enormous activity volume but converts almost nothing no longer lands in the same bucket as a rep who does moderate activity and closes consistently. The composite spreads out, and the spread is the point — you can finally rank, coach, and pay against something that tracks the P&L.
Consider the pattern that shows up on almost every team. One rep hits activity targets month after month — call volume, email volume, demos booked — and looks like a star on the activity dashboard. Another rep runs a quieter motion but wins a higher share of what they touch and forecasts within a few points of actual. On a flat average of four lines, those two can land within a rounding error of each other. On a weighted composite where revenue carries a 4 and activity carries a 2, the gap becomes obvious and defensible. Take the second rep at level 4 across revenue, win rate, activity, and forecast accuracy: (4×4) + (3×4) + (2×4) + (1×4) = 40. Take the first at level 2 on revenue, level 2 on win rate, level 5 on activity, and level 3 on forecast: (4×2) + (3×2) + (2×5) + (1×3) = 27. The weighting did that, not the raw data. The raw data was identical in both models.
The second outcome is behavioral, and it arrives faster than most leaders expect. Once the matrix is published and reps can see exactly which lines carry weight, they re-aim. A rep sitting at 27 who wants 35 does not have to guess what to fix — the arithmetic tells them that another point of revenue is worth twice another point of activity. That is a coaching conversation with a number attached, which is a fundamentally different conversation from "you need to close more." I have watched reps who were previously written off as noise-generators ask for closing coaching within weeks of a weighted matrix going live, purely because the scorecard finally made the ask legible.

The third outcome is organizational. A weighted composite is one of the few artifacts that sales, RevOps, and customer success can all read the same way. CS cares that the deals landing are good fits; RevOps cares that forecast accuracy is real; sales leadership cares about bookings. Put retention or expansion on the matrix at a real weight and CS suddenly has a lever inside the sales scorecard instead of a complaint they file after the fact. Put forecast accuracy on at even a weight of 1 and RevOps gets a visible, low-drama nudge instead of a quarterly argument.
Expect the rollout to be uncomfortable for about a quarter. Reps who have been winning on the easy lines will see their number drop, and they will say the system is broken. It is not broken; it is finally measuring what you meant to measure. What you should watch for is the opposite failure — if your genuinely best revenue producers see their composite fall, your weights are wrong and you should fix them before defending them.
What drives that outcome
Four mechanics drive the result, and each one fails independently if you get it wrong.
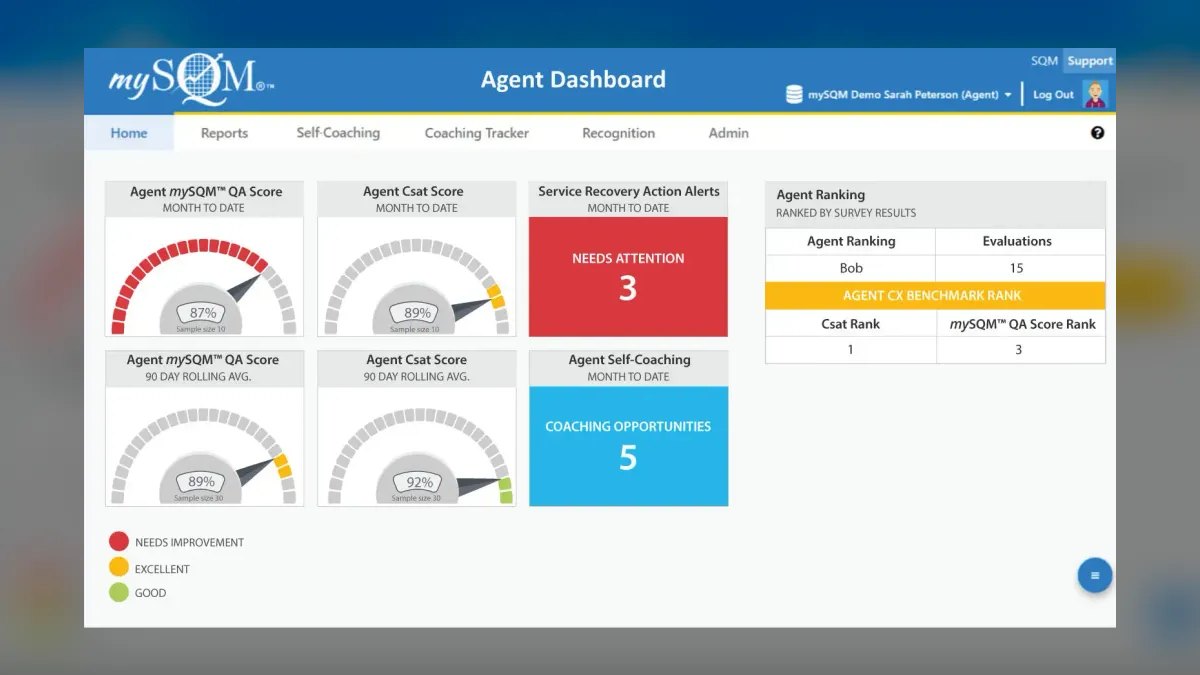
KPI selection. A complete rep is usually described by six to nine lines: new revenue, pipeline generated, win rate, average deal size, sales-cycle length, activity, retention or expansion, and forecast accuracy. Fewer than three lines and you are back to a single-metric leaderboard with extra steps. More than ten and nobody — including you — can hold the picture in their head, and the composite becomes a black box the team stops trusting. The practical band is five to seven for most teams, with eight or nine only if you genuinely have distinct roles feeding one scorecard.
Normalization. Raw KPIs live on wildly different scales. Revenue is in dollars, win rate is a percentage, sales cycle is in days, and activity is a count. You cannot sum them directly. Two normalization approaches work. The first is the 1-to-5 level scale: define what a level 1 through level 5 looks like for each KPI, in plain language, before the quarter starts. The second is percentile-to-100 within a peer group. The level scale is easier to explain and easier for reps to aim at; the percentile scale is more precise but recalibrates constantly, which can feel like moving goalposts. Pick one and hold it for at least two quarters.
Weighting. This is where the honesty lives. Derive weights from your own historical data, not from a template: pull your top performers' results across each KPI and see which lines actually track revenue. Those get the heavier weights. Whatever scheme you choose, publish it. A weight nobody can see is a weight reps will assume is rigged.
Payout linkage. Weights only change behavior if the money follows them. Wire the significant variable compensation to the composite rather than to any single line, and the matrix stops being a report and starts being a steering wheel.

An adjacent point worth absorbing: this is the same machinery that comp design, territory design, and headcount planning all run on. Once a weighted composite exists and the team believes it, you can use rep-level composites to model what a territory split would do, or to decide whether a struggling patch needs a different rep or a different coverage model. The scorecard becomes an input to decisions well upstream and downstream of individual performance reviews.
Benchmarks and realistic ranges
Treat every number below as a starting shape to calibrate against your own data, not a law.
Weight distribution. A workable default is that your top three KPIs collectively carry roughly 70–75% of the total weight, two supporting KPIs carry about 10% each, and a small remainder covers a stretch or qualitative line. In the 1-to-5 integer weight scheme, that translates to something like revenue at 4, win rate at 3, activity at 2, and forecast accuracy at 1, with the maximum possible composite at 50 and a level-3-everywhere rep landing at 30. Knowing your ceiling matters — reps will ask, and "out of 50" is a much better answer than "it depends."

Activity's share. Cap pure activity lines at roughly 30% of total weight, and often less. Activity is an input the rep controls directly, which makes it the easiest line to inflate and the least predictive of revenue. Below about 10%, though, it stops functioning as a leading indicator for new reps who genuinely need volume before they have a book.
The efficiency bridge. Rather than fighting the activity-versus-outcome tension, add a ratio line that sits between them — revenue per call, conversion rate per demo, or meetings-to-opportunity rate. A defensible split is roughly 30% activity, 50% outcome, 20% efficiency. The efficiency line is what prevents both failure modes: spray-and-pray on one end, and low-effort reps coasting on one lucky enterprise deal on the other.
KPI count. Five to seven lines is the sweet spot. Under three and the composite is barely different from a single metric. Over ten and the marginal line moves the composite by so little that it becomes decorative — reps ignore it, which means you have spent political capital defining a KPI that changes nothing.

Recalibration cadence. Review weights quarterly. Change them no more often than that in normal conditions. Reps need a stable target long enough to actually move it; a scorecard whose weights shift monthly reads as arbitrary regardless of how sound the reasoning is. The exception is a genuine market shift — if the business pivots from land-grab growth to margin protection, change the weights immediately, announce clearly that you are doing so and why, and accept one quarter of noise. That agility is a real advantage of this method: reweighting is an overnight change with no new comp deck and no retraining, and the team re-aims the following day.
Cohort structure. If your reps face materially different markets, segment before you score. A reasonable cut is by average deal size and cycle length — an enterprise band with large deals and multi-month cycles, a mid-market band, and an SMB band with small deals and short cycles. Score within cohort, not across it. Benchmarks that hold in one cohort will not hold in another: a demo-to-close conversion rate that is strong for enterprise may be mediocre for SMB, and comparing them directly measures territory, not skill.
Pilot size and duration. Run the new matrix in parallel with the existing system on five to ten reps for one full sales cycle — usually a quarter, longer if your enterprise cycle runs six months. Do not pay against it during the pilot. You are testing two things: whether the composite ranking matches what you already believe about those reps, and whether the behavior moves in the direction you intended.

Risks, edge cases, and failure modes
Equal weighting. The most common mistake is giving every KPI the same weight because equality feels fair. It is not fair — it is a statement that closing a deal matters exactly as much as sending an email. Equal weighting is how a flat average sneaks back in wearing a matrix costume.
Gaming the heavy line. Any single metric with dominant weight will be optimized, including in ways you did not intend. Weight revenue at 60% of the composite and you will get discounting, sandbagged forecasts, and deals crammed into the current quarter. The defense is structural: never let one line exceed roughly 40% of the total, and pair every volume line with a quality line. Revenue pairs with deal profitability or retention. Pipeline generated pairs with pipeline conversion. Meetings booked pairs with meeting-to-opportunity rate.
Territory inequity. A rep working a saturated enterprise patch and a rep working a growing SMB region are not running the same race. Absolute targets across both measure territory quality, not rep skill. Cohort scoring fixes this, at the cost of more data work and more frequent recalibration. Skipping it hands every underperformer a legitimate excuse and quietly corrodes trust in the whole scorecard.

Role blindness. A hunter and an account manager should not share a weight profile. The hunter's matrix leans toward prospecting, first meetings, and new revenue; the AM's leans toward expansion, retention, and net revenue retention. Use the same KPI vocabulary and the same 1-to-5 level scale across roles so the numbers stay legible, but vary the weights by role and publish both matrices. Reps comparing composites across different roles is a predictable source of friction — head it off by being explicit that the two profiles are different instruments measuring different jobs.
Small-sample noise. With short measurement windows or long sales cycles, one deal can swing a rep's revenue level by two full points. Use rolling windows — trailing two or three quarters for revenue and win rate — rather than single-period snapshots. For enterprise reps whose cycles exceed the review period, weight leading indicators more heavily and lagging indicators less, or you are scoring luck.
Ramping reps. New hires will score badly on outcome lines for reasons that have nothing to do with capability. Either exclude reps under full ramp from composite-based pay entirely, or run a ramp-specific matrix that weights activity and skill-milestone completion far more heavily, then transition them onto the standard matrix at a published date they know in advance.

Data quality. The composite inherits every flaw in your CRM. If opportunity stages are applied inconsistently, win rate is fiction. If activity logging is partly manual, activity counts measure diligence about logging. Audit the underlying data before you attach a paycheck to it. This is the failure mode that kills scorecards quietly — nobody says the data is bad, they just stop believing the number.
Score-as-verdict. A composite is a conversation starter, not a judgment. A rep can be genuinely valuable and score mid-pack because their strength sits on a low-weight line. Read the component levels, not just the total, and coach to the specific line where a one-level improvement buys the most weighted points. That is the single most useful thing the arithmetic gives you.
Overcorrection. Do not chase every quarter's result with a weight change. If the composite told you something uncomfortable, sit with it for a cycle before rewriting the instrument. Scorecards that change every time leadership is unhappy with the output train reps to wait out the next revision.
A practical rollout plan
Run this over roughly one quarter, in five stages.

Stage one — audit the data, two weeks. Before defining anything, confirm you can actually compute each candidate KPI cleanly for every rep. Pull twelve months of history. Check for stage-application inconsistency, missing close reasons, and manual-logging gaps. Any KPI you cannot compute reliably is not a KPI yet; either fix the instrumentation or leave the line off the matrix. Shipping a scorecard on bad data is worse than shipping no scorecard.
Stage two — define lines and levels, one week. Choose your five to seven KPIs. For each, write plain-language criteria for levels 1 through 5, using your own historical distribution: level 3 should describe the median rep, level 5 the top decile, level 1 the clear underperformer. Write these out fully — vague level definitions are where scorecards become political.
Stage three — derive weights, one week. Correlate each KPI against revenue outcomes across your top performers. The lines that actually track revenue earn the heavy weights. Then sanity-check against strategy: a company protecting margin should weight deal profitability and retention more heavily than raw new revenue, regardless of what last year's correlation says. Get explicit leadership sign-off before anything is published, because the first rep who dislikes their number will escalate.

Stage four — pilot in parallel, one full cycle. Score five to ten reps on both the old and new systems. Do not pay against the new one yet. Compare rankings. If the composite disagrees with your informed judgment about a rep, find out which line drove the gap — sometimes the scorecard is right and your judgment was anchored on visibility rather than results, and sometimes the weights are genuinely off.
Stage five — publish, wire the comp, and coach. Roll out the full matrix to the team with the weights visible. Hold a session walking through the arithmetic on two anonymized example profiles so everyone sees how a level changes the composite. Then wire variable compensation to the composite. In every one-on-one from that point, open with the component breakdown and identify the highest-leverage line — the one where a single level improvement yields the most weighted points.
Two adjacent workflows are worth wiring in while you are here. First, feed composites into your quota and territory planning cycle — rep-level component scores tell you whether a weak patch needs different coverage or a different rep. Second, connect the scorecard to enablement: if six reps all sit at level 2 on win rate, that is a curriculum problem, not six individual coaching problems, and the matrix is the fastest way to spot it.
Related questions
How many KPIs should a rep scorecard include?
Five to seven for most teams. Under three, the composite behaves like a single-metric leaderboard. Over ten, individual lines move the total so little that reps stop attending to them and the score becomes a black box nobody trusts or aims at.
Should hunters and account managers share one matrix?
Share the KPI vocabulary and the 1-to-5 level scale, but not the weights. Hunters weight toward new revenue and first meetings; account managers weight toward expansion and retention. Publish both profiles so nobody assumes the other role has an easier scorecard.
How do I stop reps gaming the heaviest-weighted metric?
Cap any single line at roughly 40% of total weight and pair every volume metric with a quality metric — revenue with profitability or retention, pipeline generated with pipeline conversion, meetings booked with meeting-to-opportunity rate.
Can I change weights mid-quarter if strategy shifts?
Yes, and that flexibility is a genuine advantage of weighted scoring — no new comp deck required. But announce the change and the reasoning explicitly, and avoid doing it more than once a quarter in normal conditions or the targets read as arbitrary.
What should new reps be scored on during ramp?
Run a ramp-specific matrix weighted toward activity and skill-milestone completion, or exclude them from composite-based pay until full ramp. Scoring an unramped rep on outcome lines measures tenure, not capability.
FAQ
What's the biggest mistake when scoring sales reps across multiple KPIs?
Weighting activity metrics — calls, emails, meetings booked — as heavily as outcomes like closed revenue and retention. It makes a high-volume, low-conversion rep look like a star while a quieter closer looks average. Cap activity's share of the composite and pair it with an efficiency ratio that measures output per unit of effort.
Should I use the same KPI weights for every rep?
No. Weights should follow the role. A new-business hunter's matrix leans toward prospecting volume, first meetings, and new revenue; an account manager's leans toward expansion, retention, and net revenue retention. Keep the KPI vocabulary and level scale identical across roles so the numbers stay comparable in structure, but publish each role's weight profile openly.
How often should I update the scoring system?
Review quarterly and change no more often than that under normal conditions — reps need a stable target long enough to move it. The exception is a real strategic shift, such as pivoting from growth to margin protection. In that case reweight immediately, explain why, and expect one noisy quarter while the team re-aims.
Can I use a simple average of KPI scores instead of a weighted formula?
Only if every KPI genuinely matters equally, which is almost never true. A flat average lets a strong score on an easy line cancel a weak score on a critical one, compressing everyone toward the middle. A weighted formula preserves the differences that matter. Just make sure leadership signs off on the weights and the whole team can see them.
What if a rep excels at one KPI but struggles with others?
That is normal and expected. Read the component levels rather than the total, then coach to the line where a one-level improvement buys the most weighted points. If the weak lines carry low weight and the strong lines carry high weight, the rep may legitimately be a strong contributor despite an uneven profile.
How do I score reps fairly when territories differ?
Segment into cohorts by average deal size and sales-cycle length, then score within cohort rather than across the whole team. A conversion rate that is excellent for enterprise may be below average for SMB. Cohort scoring costs more data work and needs quarterly recalibration, but it removes the territory excuse and measures skill instead of patch quality.
Sources
- https://hbr.org/2017/12/how-to-set-sales-goals-that-actually-motivate-your-team
- https://www.mckinsey.com/capabilities/growth-marketing-and-sales/our-insights
- https://www.gartner.com/en/sales/topics/sales-performance-management
- https://www.salesforce.com/resources/articles/sales-metrics/
- https://www.shrm.org/topics-tools/tools/toolkits/performance-management-appraisal
- https://www.investopedia.com/terms/b/balancedscorecard.asp
- https://hbr.org/1992/01/the-balanced-scorecard-measures-that-drive-performance
- https://www.hubspot.com/sales-metrics
Related on PULSE
This page will be disappearing soon. Save it to your device for $1 — or read it free while it is here.
@Kory-White- · if Venmo asks, the last 4 of my number are 2012
This page is gone.
This one is off the shelf now. $1 keeps it on your phone for good — the whole page, pictures and diagrams included.
 pulse-qHow Do I Get My Jewelry Staff to Offer Financing on Every Sale in 2026?
 pulse-qWhat Service Fees Should a Gym or Fitness Studio Charge in 2026?
 pulse-qWhat Service Fees Should a Locksmith Charge in 2026?
 pulse-qHow Many Agents Do I Need to Recruit for My Real Estate Brokerage to Grow Production in 2026?
 pulse-qHow Do I Calculate the Right Service Fee to Charge in 2026?
 pulse-qHow Many Sales Reps Do I Need to Hire for My Hot Tub and Spa Retailer in 2026?
 pulse-qHow Do I Figure Out How Many Reps to Schedule at Each of My Multi-Unit Cell Phone Stores in 2026?
 pulse-qHow Many Employees Should I Schedule Each Shift at My Skate Park in 2026?
 pulse-qWhat Service Fees Should a Plumbing Company Charge in 2026?
 pulse-qHow Many Sales Reps Do I Need to Hire for My VoIP Company in 2026?