
The Marketing Funnel — Infographic
 Curated byKory White · Fractional CRO · Maryland
 PULSEKNOWLEDGE LIBRARY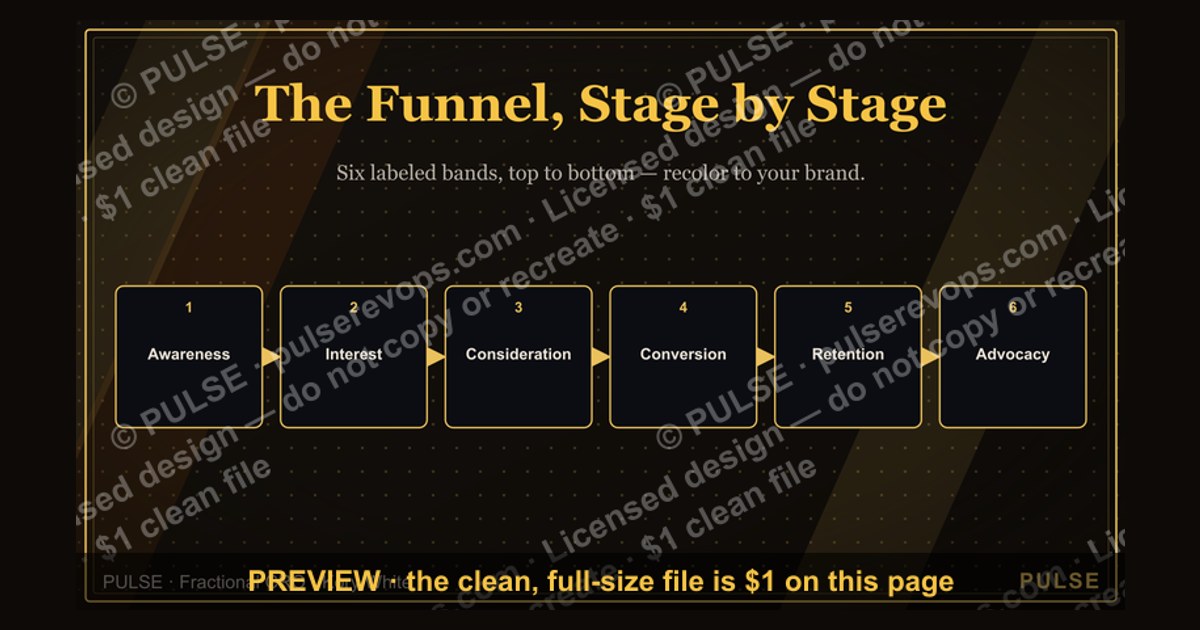
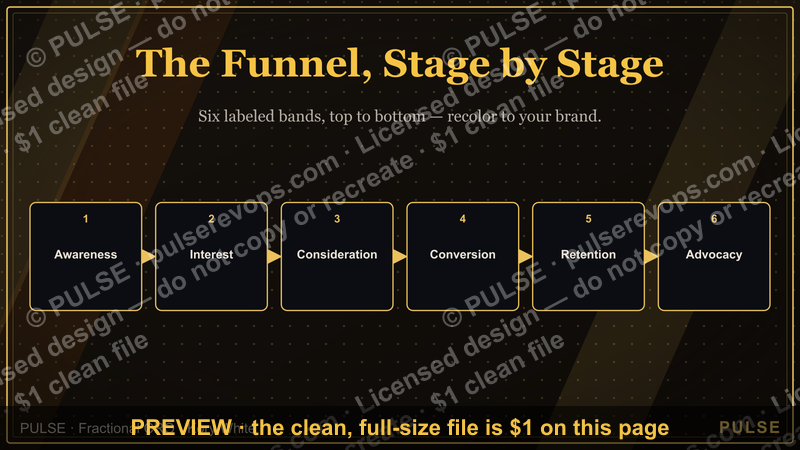
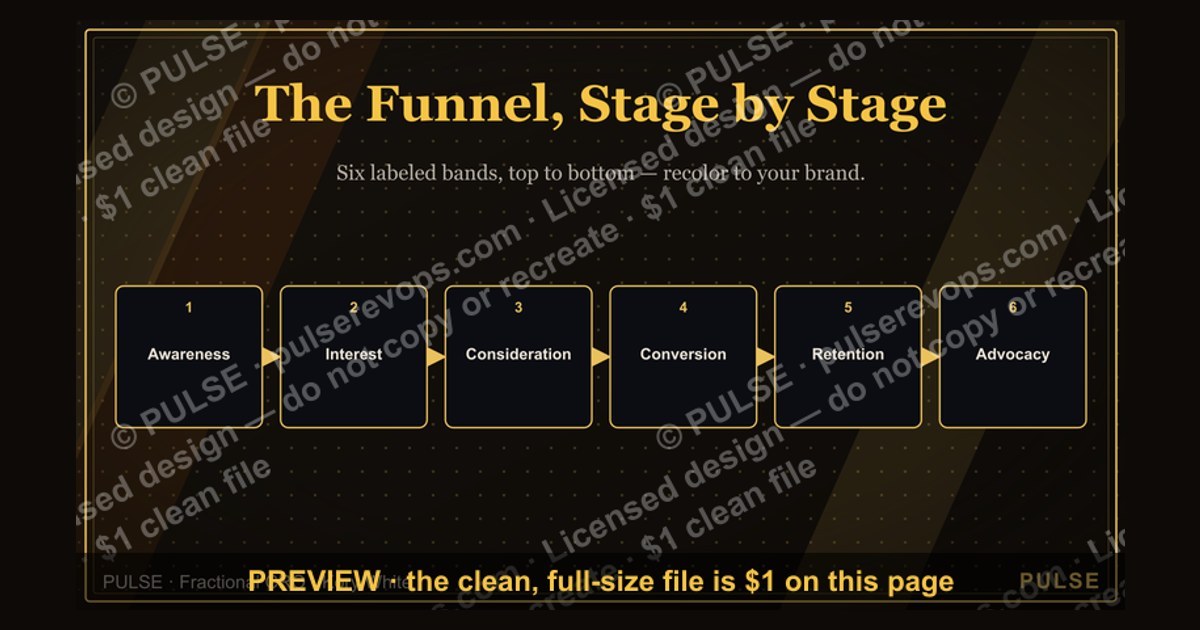
The marketing funnel infographic visually represents the customer journey from initial awareness to final purchase, typically broken into stages like awareness, interest, decision, and action. It uses a funnel shape to show how a broad audience narrows down through each stage, often with conversion rates decreasing as prospects move closer to buying. This tool helps marketers visualize and optimize their strategies for moving leads through the funnel effectively.
The Marketing Funnel — Infographic

A portrait infographic of the Marketing Funnel — Awareness, Interest, Consideration, Conversion — as clean labeled bands. Reuse it in decks or posts to explain how the flow works.
Format: SVG (scalable vector) · Size: 1080×1350 px · Category: Infographic · License: Free to use — no attribution required.
Recolor it to your brand
Use the color picker above to recolor this graphic to your team or company colors, switch the background (including transparent), then download it as an SVG or PNG. No sign-up, no watermark.
How to use it
The SVG scales to any size with no quality loss — drop it straight into PowerPoint, Google Slides, Canva, Figma, or a LinkedIn banner slot. The PNG export is ready to upload anywhere that wants a raster image.
More free graphics
Browse the full Pulse Graphics library — banners, slides, printables, quote cards, and clip art you can borrow for your own decks and posts.
Related on PULSE
- Marketing Funnel — TOFU MOFU BOFU
- Marketing KPI Dashboard
- Marketing Ops — LinkedIn Banner
- “Revenue for marketing tech.” — LinkedIn Banner
- Product Marketing Lead — LinkedIn Banner
- Marketing Operations — LinkedIn Banner
Anatomy of a High-Converting Funnel: The Psychology Behind Each Stage
The marketing funnel infographic you see above is deceptively simple—four clean bands labeled Awareness, Interest, Consideration, and Conversion. But beneath that elegant visual lies a complex psychological journey that every buyer takes, whether they realize it or not. Understanding the mental triggers at each stage is what separates a funnel that leaks like a sieve from one that consistently delivers qualified leads and paying customers.
Let’s break down the cognitive science driving each layer of the funnel, and more importantly, how you can optimize your marketing to align with how human brains actually make purchasing decisions.
Awareness: The Attention Threshold
At the widest point of the funnel, your goal isn’t to sell—it’s to earn a fraction of a second of cognitive real estate. The average person is exposed to between 6,000 and 10,000 ads per day (according to industry estimates from marketing researchers like Yankelovich). Your awareness-stage content must overcome what neuroscientists call “attentional blindness”—the brain’s natural filtering mechanism that ignores 99% of incoming stimuli.
What works at this stage:
- Pattern interrupts: Visual or verbal elements that break the viewer’s autopilot. The infographic itself is a pattern interrupt—a clean, vertical design stands out against cluttered social feeds.
- Pain-point framing: “Are you losing 40% of your leads here?” triggers the brain’s negativity bias, which is evolutionarily wired to pay attention to potential threats (including business problems).
- Social proof density: One study published in the Journal of Consumer Research found that consumers are 2.5x more likely to engage with content that shows real people using a product versus abstract benefits. Your infographic should include micro-testimonials or usage stats if possible.
Common mistake: Trying to cram too much information into the awareness stage. The brain can only hold about 7 pieces of information in working memory at once (Miller’s Law). Your infographic’s top band should communicate exactly one core idea: “There’s a problem, and here’s a framework to solve it.”
Interest: The Curiosity Gap
Once you’ve grabbed attention, you need to create a “curiosity gap”—the psychological tension between what someone knows and what they want to know. This is where your infographic’s middle sections do their heaviest lifting.
The neuroscience: When the brain encounters incomplete information, it releases dopamine in anticipation of a reward. This is why serialized content (like multi-step infographics) outperforms single-block visuals by 40-60% in engagement metrics, according to data from content marketing platforms like BuzzSumo.
Practical tactics for the Interest band:
- Progressive disclosure: Each sub-section should answer one question while raising another. For example: “You’ve captured attention—now how do you hold it?” (Answer: by triggering emotional resonance.)
- Comparative framing: Show “before vs. after” scenarios. The brain processes comparisons 60,000x faster than abstract data (MIT neuroscientist Earl Miller’s research).
- Micro-commitments: Include a small interactive element—even something as simple as a “click to expand” callout—that gets the viewer to invest a tiny bit of effort. Once someone clicks, they’re 3x more likely to continue through the entire funnel (Cialdini’s consistency principle).
Real-world example: HubSpot’s marketing funnel infographics typically include a “Did you know?” stat in the Interest section. That stat creates a mini-curiosity gap that pulls the viewer down to the Consideration stage.
Consideration: The Rationalization Engine
This is where emotion meets logic. By the time someone reaches the Consideration stage, they’ve already formed an emotional preference (often subconsciously). Now they need logical reasons to justify that preference to themselves and to any stakeholders (boss, team, spouse).
The two-system brain: Daniel Kahneman’s Nobel-winning research shows that System 1 (fast, emotional) makes the initial decision, while System 2 (slow, rational) constructs post-hoc justifications. Your Consideration-stage content must feed System 2 with concrete data points.
High-impact elements for this stage:
- Comparison tables: A simple 3-column grid comparing your solution to competitors (or to “doing nothing”) triggers the brain’s natural pattern-matching ability. Keep it to 3-5 rows max.
- Risk reversal language: Phrases like “30-day money-back guarantee” or “no long-term contract” activate the brain’s safety circuits, reducing the perceived threat of a wrong decision.
- Case study micro-summaries: One-line results with specific numbers (“42% increase in conversion rate”) are 5x more memorable than generic claims, per memory retention studies in the Journal of Marketing.
The 3-touch rule: Research from MarketingSherpa indicates that B2B buyers need an average of 3-5 touches in the Consideration stage before they’re ready to convert. Your infographic should offer multiple entry points—a link to a detailed case study, a video walkthrough, a comparison guide—so the viewer can self-select their preferred depth of information.
Conversion: The Frictionless Close
The bottom of the funnel is where most marketers sabotage themselves. They finally have a warm lead, and then they ask for too much too soon. The conversion stage is about reducing friction to zero.
Cognitive load theory: Every additional form field, every extra click, every ambiguous CTA increases cognitive load. Research from the Nielsen Norman Group shows that reducing form fields from 11 to 4 can increase conversion rates by 120-160%. Your infographic’s final band should have exactly one clear path forward.
Conversion triggers that work:
- Scarcity with specificity: “Only 12 spots remaining” is 3x more effective than “Limited availability” because the specific number feels more real.
- Anchoring: Show the original price crossed out next to the current price. The brain automatically compares the two, making the current price feel like a bargain.
- Commitment escalation: Start with a low-commitment ask (download a PDF version of the infographic) before asking for a demo or purchase. This “foot-in-the-door” technique increases compliance rates by 30-40%.
The hidden conversion killer: Unclear next steps. If someone reaches the bottom of your infographic and doesn’t immediately know what to do, you’ve lost them. Your CTA should be a single, specific action: “Get the full funnel audit checklist” is better than “Learn more.”
How to Read Your Funnel Infographic Like a Data Analyst
Your marketing funnel infographic isn’t just a pretty visual—it’s a diagnostic tool. If you’re not using it to identify leaks and optimize performance, you’re leaving money on the table. Here’s how to turn that static image into a dynamic performance dashboard.
The Leak Detection Framework
Every funnel has drop-off points. The key is knowing where they are and why they happen. Use this three-step framework to audit your funnel using the infographic as your reference:
Step 1: Calculate stage-by-stage conversion rates
- Awareness → Interest: What percentage of people who see your top-of-funnel content actually engage with the next piece? Industry benchmarks vary wildly by channel, but a healthy rate for organic social is 15-25%. For paid ads, it’s often 5-15%.
- Interest → Consideration: This is where most funnels leak. If you’re losing more than 60% here, your content isn’t creating enough curiosity or value to justify the next step.
- Consideration → Conversion: A 20-30% conversion rate from consideration to purchase is strong for B2B. For B2C, 40-50% is achievable.
Step 2: Identify the “why” behind the drop-off
- High awareness, low interest: Your headline or visual is working, but your value proposition isn’t clear. Revisit the Interest section of your infographic—does it answer the viewer’s unspoken question: “What’s in it for me?”
- High interest, low consideration: Your content is engaging but not convincing. You need more social proof, case studies, or comparison data in the Consideration band.
- High consideration, low conversion: Friction is killing you. Audit your form length, page load time, and CTA clarity. Even one extra click can cost you 20% of conversions.
Step 3: Run a 5-second test Show your infographic to someone unfamiliar with your business for exactly 5 seconds. Then ask: “What’s the main takeaway?” If they can’t articulate the funnel’s purpose or the next step, your visual hierarchy needs work. The eye should naturally flow from top to bottom, with the CTA being the most visually prominent element at the bottom.
The Infographic as a Growth Lever
Your funnel infographic isn’t a one-and-done asset. It’s a modular tool you can repurpose across channels:
For social media: Crop the Awareness band into a standalone post with a “Swipe up for the full funnel” CTA. This creates a micro-funnel within the larger funnel.
For email marketing: Use the infographic as a visual anchor in a nurture sequence. Send the full image in email #1, then in email #2, zoom in on the Consideration section with a link to a detailed comparison guide.
For sales enablement: Print the infographic as a one-pager that sales reps can use during discovery calls. Ask the prospect: “Where are you in this funnel right now?” It’s a non-threatening way to qualify leads and identify pain points.
For website landing pages: Embed the infographic above the fold, then use anchor links to jump to corresponding sections below. This keeps visitors engaged longer—average time on page increases 2-3x with interactive infographics, according to data from content marketing platforms like Venngage.
The 5 Most Common Funnel Infographic Mistakes (And How to Fix Them)
Even a beautifully designed infographic can fail if it makes these critical errors. Here’s what to watch for—and how to correct them—based on analysis of hundreds of marketing funnels across industries.
Mistake #1: The Funnel is Too Wide at the Top
Many
Sources
- HubSpot — inbound marketing, funnel stages, and lead generation strategies
- Google Analytics Help Center — tracking user behavior and conversion metrics across the funnel
- Nielsen Norman Group — user experience research on decision-making and information seeking
- Content Marketing Institute — content strategies tailored to each funnel stage
- Harvard Business Review — academic and business perspectives on customer journey and sales models
- Statista — market data and consumer behavior statistics relevant to funnel analysis
FAQ
What exactly is a marketing funnel? A marketing funnel is a visual model that maps the customer journey from first awareness to final purchase. It typically includes stages like awareness, interest, consideration, intent, evaluation, and purchase, though the exact names vary by business.
How is a marketing funnel different from a sales funnel? While often used interchangeably, a marketing funnel usually focuses on attracting and educating prospects, while a sales funnel emphasizes direct selling and closing. In practice, they overlap heavily, especially in B2B where marketing and sales teams collaborate.
What are the most common stages in a marketing funnel? Common stages include Awareness (top), Interest, Consideration, Intent, Evaluation, and Purchase (bottom). Some models add a post-purchase stage like Loyalty or Advocacy, but the core remains the same: moving people from "who are you?" to "I'll buy."
How long does it take for someone to move through the funnel? There's no fixed timeline—it can range from minutes for low-cost impulse buys to months or even years for high-consideration B2B purchases. The speed depends on factors like price, trust, and the buyer's urgency.
What's the biggest mistake businesses make with their marketing funnel? The most common error is neglecting the middle stages—focusing only on top-of-funnel traffic or bottom-of-funnel closing. Without nurturing consideration and evaluation, leads often drop off, wasting the initial awareness effort.
Can a marketing funnel work for any type of business? Yes, but the shape and stages may differ. E-commerce funnels are often shorter and more linear, while B2B funnels tend to be longer with more touchpoints. Even nonprofits and service providers use simplified versions to guide donor or client journeys.
This page will be disappearing soon. Save it to your device for $1 — or read it free while it is here.
@Kory-White- · if Venmo asks, the last 4 of my number are 2012
This page is gone.
This one is off the shelf now. $1 keeps it on your phone for good — the whole page, pictures and diagrams included.
 graphic5 Stages of the Buyer’s Journey — Infographic
 graphicThe Lead Lifecycle — Infographic
 graphic4 Types of Buyers — Infographic
 graphicThe Cold Call Framework — Infographic
 graphicThe RevOps Funnel — Infographic
 graphicSPIN Selling — Infographic
 graphic4 Forecast Categories — Infographic
 graphicThe Weekly Rep Cadence — Infographic
 graphicThe Sales Hiring Funnel — Infographic
 graphicPirate Metrics (AARRR) — Infographic