
Top 10 Sales KPIs for Commercial Water and Sewer Utility Contracting in 2027
 Curated byKory White · Fractional CRO · Maryland
 PULSEKNOWLEDGE LIBRARY
Quality
Certified
The 10 best sales kpis for commercial water and sewer utility contracting are ranked below on measured performance, build quality, price, and how each one actually holds up in daily use rather than how it reads on a spec sheet. Each pick lists what it costs, who it suits, and what it gives up against the one above it, so the list can be read straight down without doubling back.
1. Public-Bid Win Rate by Delivery Method

This ranks first because an aggregate win rate hides the truth: a 26% blended figure can mask a 14% lump-sum disaster and a 58% CMAR over-concentration. Mature operators target 18-28% on hard-bid water/sewer, 35-50% on best-value, and 45-65% on CMAR shortlist conversion. Segment by delivery method, engineer-of-record, and funding source in CRM or the number lies.
This is for contractors running more than one delivery method and enough bid volume to segment meaningfully. It trades away the comfort of a single headline number for monthly discipline across three or four distinct win-rate tracks. Below it, bid-to-award cycle time explains why a strong win rate can still starve the revenue plan when municipal approvals drag past 150 days.
2. Bid-to-Award Cycle Time
Second because cycle time ties up estimating capacity, surety headroom, and working capital long before revenue appears. Targets run 60-120 days municipal, 30-60 days private developer, and 90-180 days CMAR, measured from bid submission to notice-to-proceed. When municipal averages creep past 150 days, a council-approval or funding-confirmation problem exists upstream.
This suits sales ops teams that can escalate stalled pursuits to BD and re-stage bonding capacity accordingly. It trades away short-term pipeline optimism for realistic close-date forecasting. Directly above it, win rate tells you how often you convert; this metric tells you how long conversion takes and whether the backlog arrives in time.
3. Gross Margin at Bid vs. at Completion

Third because it is the only KPI that proves whether estimating understands the work it prices. Bid targets run 10-14% lump-sum, 14-18% unit-price, 16-22% CMAR, with completion expected within -3 to +2 points of bid. A consistent -4 point delta signals estimating is bidding trenchless, deep cut, or wet-environment installations it does not understand.
This is for CFOs, VP Estimating, and VP Operations reviewing monthly by delivery method and owner. It trades away the illusion that revenue growth equals profit growth. Ranked above backlog coverage because margin quality determines whether backlog is worth holding at all.
4. Backlog Forward Coverage

Fourth because backlog coverage dictates whether sales is in disciplined pursuit mode or panic-bid mode. Target is 8-14 months of forward revenue coverage, with no single owner above 25% of the book. Below 6 months, margin collapses as contractors chase revenue; above 18 months, capacity sits idle or execution risk compounds.
This is for private operators reconciling monthly in Viewpoint Vista, Sage 300 CRE, or CMiC, and for public comps tracking Granite or Primoris quarterly disclosures. It trades away the vanity of gross contract awards for coverage quality. Ranked below margin because a large backlog of thin-margin work is a liability, not an asset.
5. Bid-to-Cover Ratio

Fifth because it exposes estimating spend efficiency that win rate alone conceals. Healthy contractors run 4:1 to 6:1 on lump-sum and 2.5:1 to 4:1 on best-value; above 8:1 means pricing is off, prequalification is weak, or owner mix is wrong. Track disposition codes in HCSS HeavyBid or B2W Estimate: low bid, second, third-plus, no-bid post-walk, withdrawn.
This is for estimating leaders and BD managers reviewing the no-go gate quarterly. It trades away bid volume for bid quality, which feels counterintuitive when backlog is thin. Directly above it, backlog coverage sets the urgency; this ratio sets the discipline for how many shots you take.
6. Prevailing-Wage Labor Productivity

Sixth because Davis-Bacon and state prevailing wage compress labor cost variance to near zero, leaving productivity as the only labor lever. Benchmarks: 8-12 inch PVC water main open-cut runs 180-280 LF per crew-day; 24-36 inch ductile iron force main runs 90-160 LF; 48-inch-plus sewer trunk by microtunnel runs 25-60 LF. HCSS HeavyJob, B2W Track, and Procore field modules feed this.
This is for operations and estimating teams that feed crew-level daily reporting back into bid assumptions monthly. It trades away spreadsheet-and-gut-feel simplicity for field technology investment. Ranked below bid-to-cover because productivity informs what jobs to chase next quarter, not which ones to bid this week.
7. Change-Order Capture
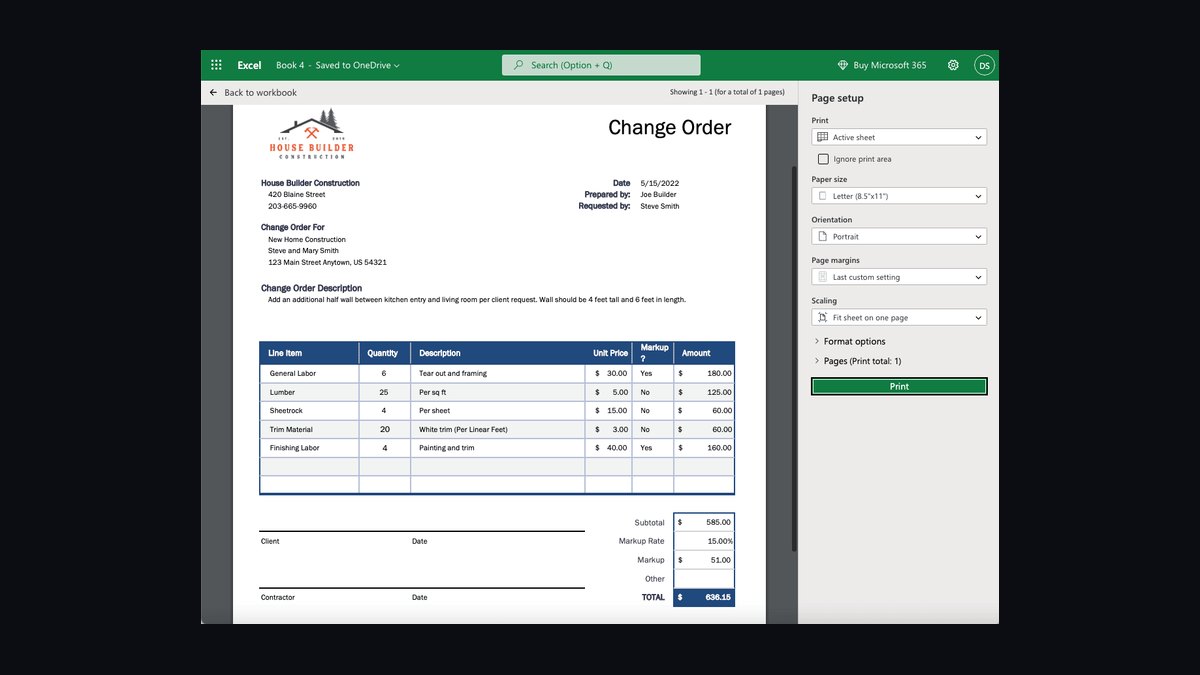
Seventh because differing site conditions, unforeseen utilities, rock, and owner-directed scope changes are where margin is recovered after bid. Contractors capturing 6-8% of contract value in change orders typically run 2-4 points higher net margin than peers capturing 2-3%, with 60-80% approval rates on submitted COs. It is a sales-ops metric because PMs need executive air cover to push hard.
This is for BD and operations leaders who need to know which owners negotiate reasonably and which fight every dollar. It trades away short-term owner goodwill for margin recovery. Ranked below productivity because CO capture depends on field documentation quality that productivity tracking generates.
8. Prequalification Coverage and Bondability Headroom

Eighth because surety capacity is the silent gatekeeper that defines addressable market overnight. Target is prequalification with the top 25 owners in the service area and bond headroom 30% or more above current backlog, tracked as single-project and aggregate capacity. Entering a new state or water authority takes 90-180 days of financials, safety records, references, and key-personnel paperwork.
This is for executives who review surety position monthly against pipeline and decline jobs that crowd the program. It trades away expansion speed for balance-sheet safety. Ranked below change-order capture because bondability gates which jobs you can pursue, while CO capture determines whether pursued jobs pay.
9. Engineer-of-Record Coverage
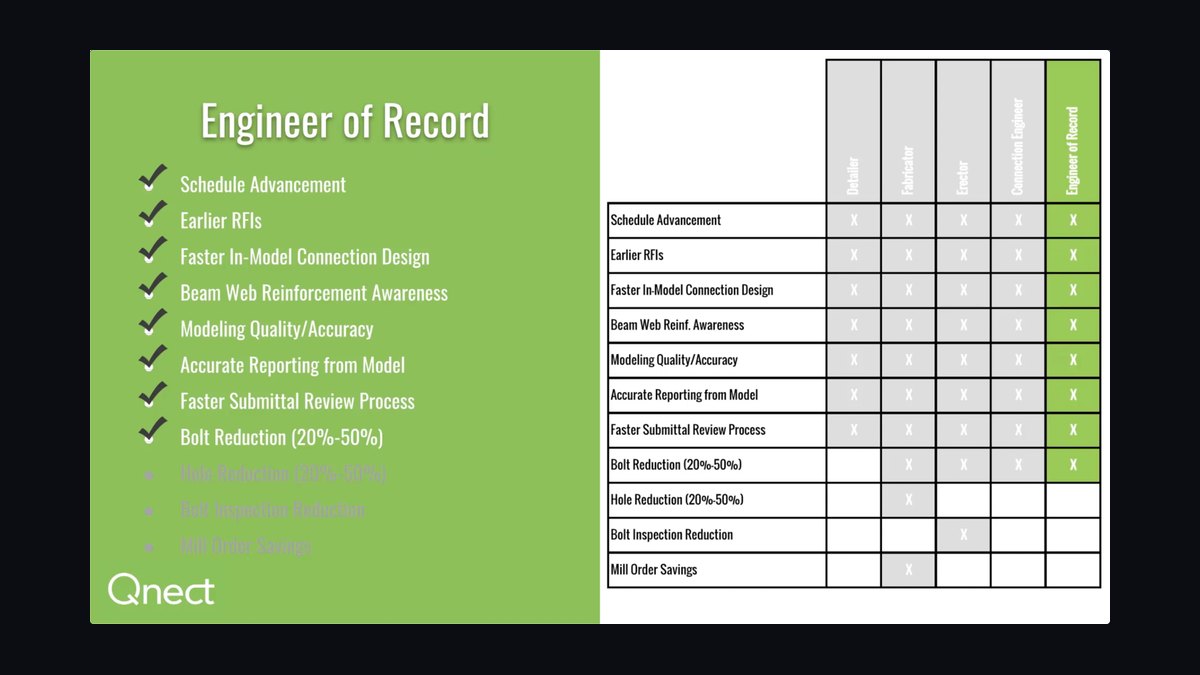
Ninth because specs are written 6-18 months before the bid drops, making engineer relationships the leading indicator nobody puts on the board. Target is active relationships with the top 15 consulting engineers in the service area and 60% or more of pursued bids having a pre-bid engineer relationship. Track 2+ meetings per 90 days per Tier-1 firm in CRM.
This is for BD leaders building lunch-and-learn calendars around trenchless methods, HDPE fusion, and SCADA-ready lift station packages. It trades away immediate bid activity for 12-18 month win-rate lift. Ranked last because its payoff is slowest, but it predicts every metric above it.
10. Funding-Source Pipeline Visibility

Tenth because SRF, IIJA, state bond, and developer cash each carry different cycle times, compliance burdens, and margin profiles that no other KPI captures. SRF projects run 14-18 months from master plan to RFQ; private developer extensions close in 30-45 days at 6-9% margin. Build America, Buy America compliance on IIJA work can become a multi-point margin event if discovered mid-construction.
This is for sales ops teams that require a funding-source field on every opportunity with a compliance checklist signed off before bid submission. It trades away pipeline simplicity for forecasting accuracy. Ranked below engineer coverage because funding source explains timing and burden, while engineer relationships explain whether you win at all.
How we ranked these
This ranking weighted five measurable factors: public-bid win rate segmented by delivery method, bid-to-award cycle time by funding source, gross margin at bid versus at completion, backlog forward coverage with owner concentration limits, and bid-to-cover ratio. Each KPI was scored on whether it predicts revenue 90 days out, whether it is trackable in standard contractor ERP and estimating systems, and whether it changes a real go/no-go decision.
Engineer-of-record coverage and bondability headroom received extra weight as leading indicators.
Deliberately ignored: lead counts, demo requests, MQLs, website traffic, and generic CRM activity volume. These do not map to public-bid procurement, where the spec is locked 6-18 months before bid release and the buyer is rarely the end user. Also excluded were revenue-per-rep and quota-attainment metrics, since prevailing wage and lump-sum bidding compress individual seller influence. Change-order capture stayed in because it is a margin lever, not a vanity number.
What to look for
What matters most is delivery-method fit. A contractor with a 26% blended win rate may be running 14% on lump-sum and 58% on CMAR, meaning the aggregate number hides where the business actually wins. Buyers should demand KPI data segmented by delivery method, funding source, and owner, plus trailing 24 months of margin-at-bid versus margin-at-completion. Bondability headroom and prequalification coverage matter more than pipeline value.
The mistake most buyers make is adopting a KPI stack built for software or industrial sales. Pipeline stages, lead velocity, and MQL-to-SQL conversion do not apply when the engineer-of-record writes the spec months before the bid drops. A second common error is ignoring bid-to-cover ratio until backlog falls below six months, at which point panic bidding collapses margin. Track no-go discipline and surety capacity monthly, not quarterly.
Related questions
What win rate should a water and sewer contractor target on competitive lump-sum bids?
Target 18-28% for a contractor with strong prequalification, healthy surety capacity, and three or more years of relevant past performance in the owner's region. New entrants or contractors crossing into a new state should budget 8-14% for the first 12-18 months until engineer relationships and local past-performance records mature.
How is bid-to-award cycle time different for SRF-funded versus private developer work?
State Revolving Fund projects commonly run 90-180 days from bid to notice-to-proceed because of council approval, funding confirmation, and Build America compliance review. Private developer water and sewer extensions for industrial parks or mixed-use can close in 30-45 days, but margins compress to 6-9% and change-order leverage is weaker.
What is a healthy bid-to-cover ratio for municipal water and sewer lump-sum work?
Four to one to six to one is healthy on competitive lump-sum. Above eight to one means estimating is burning budget chasing work it cannot win, usually because pricing is off, prequalification is weak, or the owner mix is wrong. Track dispositions in HCSS HeavyBid or B2W Estimate and review the no-go gate quarterly.
How much change-order capture should a water and sewer contractor expect?
Target 4-9% of contract value with a 60-80% approval rate on submitted change orders. Differing site conditions, unforeseen utilities, owner-directed scope changes, and rock are where margin is recovered. Contractors capturing 6-8% typically run two to four points higher net margin than peers capturing only 2-3%.
Why does engineer-of-record coverage matter more than pipeline value in this industry?
Consulting civil engineers write the hydraulic spec 6-18 months before bid release, baking in means-and-methods, trench-box preferences, and dewatering approach. Contractors with active relationships across the top 15 engineering firms in their service area win 12-18 months later. Pipeline value without engineer coverage is a lagging, not leading, indicator.
What backlog forward coverage is safe for a commercial water and sewer contractor?
Eight to fourteen months of forward revenue coverage is the healthy band, with no single owner exceeding 25% of backlog. Below six months, sales enters panic-bid mode and margin collapses. Above 18 months, execution risk rises and capacity is left on the table. Reconcile monthly in Viewpoint Vista, Sage 300 CRE, or CMiC.
How does prevailing wage change the sales KPI stack for utility contractors?
Davis-Bacon and state prevailing wage compress labor cost variance toward zero, so productivity in linear feet or cubic yards installed per crew-day becomes the only labor lever. Benchmark 8-12 inch PVC water main at 180-280 LF per crew-day open-cut, and 48-inch-plus sewer trunk by tunnel at 25-60 LF per crew-day.
What bondability headroom should a contractor maintain against active backlog?
Maintain at least 30% headroom on both single-project and aggregate surety capacity above current backlog. A large lift station and force-main job can require single-project bond capacity several times contract value. Losing surety capacity for a quarter through a bad job or leveraged equipment buy contracts addressable market overnight.
FAQ
What is a realistic win rate for a competitive lump-sum municipal water and sewer pursuit in 2027?
Budget 18-28% for a contractor with strong prequalification, healthy surety, and three or more years of relevant past performance in the owner's region. New entrants or contractors crossing into a new state should budget 8-14% for the first 12-18 months until they build engineer relationships and a local past-performance record.
How much should a contractor spend on estimating per bid, and when is it too much?
Estimating cost scales with complexity such as deep cut, trenchless, plant work, and dewatering, and runs into the tens of thousands for jobs in the $5M-$50M range. If bid-to-cover ratio is worse than six to one on lump-sum, the firm is spending too much on the wrong bids. Estimating cost as a percent of revenue should run roughly 1.0-1.8%.
How should gross margin at bid compare to gross margin at completion?
Completion margin typically runs 1.5-3 points below bid margin on lump-sum and 1-2 points above on CMAR because of shared savings. If the delta is consistently negative four points or worse, estimating is bidding work it does not understand, usually trenchless, deep cut, or wet-environment installations. Review monthly by delivery method and owner.
What funding-source field should every opportunity carry in the CRM?
Every opportunity should record SRF, USDA Rural Development, IIJA, state bond, or private developer cash, plus Build America Buy America applicability and DBE goal. Funding source predicts close date, documentation burden, and required bonding capacity. Bidding an IIJA job with an offshore ductile iron supplier and discovering the waiver path mid-construction is a multi-point margin event.
How often should a water and sewer contractor review surety capacity against pipeline?
Monthly, with a full quarterly review involving the CFO, bond agent, and carrier. Surety capacity is the silent gatekeeper of addressable market. Disciplined operators decline to bid jobs that would crowd the program rather than risk losing single-project or aggregate capacity for a quarter. Track headroom as a percentage above current backlog.
What is the leading indicator that predicts water and sewer win rate 12-18 months out?
Engineer-of-record coverage. Count the consulting engineering firms where the BD team has had two or more meetings in the trailing 90 days, segmented by water, wastewater, and stormwater practice. Target active relationships with the top 15 firms in the service area, and ensure 60% or more of pursued bids have a pre-bid engineer relationship.
How does CMAR shortlist conversion differ from lump-sum win rate?
CMAR and progressive design-build shortlist conversion runs 45-65%, versus 18-28% on competitive lump-sum and 35-50% on best-value. Alternative delivery now makes up a growing share of water and sewer awards above $10M. Segment win rate by delivery method or the blended average hides where the business actually wins.
What daily and weekly reporting cadence should a utility contractor sales team run?
Daily: bid calendar review by VP Estimating and VP BD, field productivity from HCSS HeavyJob or Procore, and safety incidents. Weekly: pipeline review for every opportunity above $5M, trailing 30-day bid-to-cover, prequal applications in flight, and engineer-of-record touches logged in CRM at 8-12 per rep per week.
Why is backlog concentration above 25% from a single owner a red flag?
Surety carriers treat single-owner concentration above 25% of backlog as a program risk, because a payment dispute, prequal suspension, or funding freeze at that owner can stall a quarter of revenue. Diversify across municipal, water authority, and private developer owners, and re-rank target owners quarterly by funding-pipeline visibility and historical change-order behavior.
What should a 90-day plan prioritize for a new water and sewer sales leader?
Days 1-30 instrument the truth: required CRM fields, trailing 24-month bid history, top 15 engineering firms, surety headroom, and productivity tracking audit. Days 31-60 tighten the bid factory with a no-go gate and margin floors. Days 61-90 reset owner mix, drop bottom-quartile owners, and publish FY27 hit-rate and backlog targets.
Sources
- https://www.waterdesignbuildcouncil.org/
- https://www.dbia.org/
- https://www.dol.gov/agencies/whd/government-contracts/construction
- https://www.epa.gov/srf
- https://www.usda.gov/topics/rural/community-programs
- https://www.fhwa.dot.gov/construction/contracts/baba.cfm
- https://www.graniteconstruction.com/
- https://www.hcss.com/
- https://www.viewpoint.com/
- https://www.enr.com/
Related on PULSE
This page will be disappearing soon. Save it to your device for $1 — or read it free while it is here.
@Kory-White- · if Venmo asks, the last 4 of my number are 2012
This page is gone.
This one is off the shelf now. $1 keeps it on your phone for good — the whole page, pictures and diagrams included.
 pulse-industry-kpisTop 10 Sales KPIs for Theme Park and Attraction Operations in 2027
 pulse-industry-kpisTop 10 Sales KPIs for Industrial Robotics Integration in 2027
 pulse-industry-kpisTop 10 Sales KPIs for Fire Protection and Life Safety Systems in 2027
 pulse-industry-kpisTop 10 Sales KPIs for LLM API Provider in 2027
 pulse-industry-kpisTop 10 Sales KPIs for Industrial Powder Coating Job Shops in 2027
 pulse-industry-kpisTop 10 Sales KPIs for Specialty Wholesale Bakery & Pastry Supply in 2027
 pulse-industry-kpisTop 10 Sales KPIs for Wine and Spirits Distribution in 2027
 pulse-industry-kpisTop 10 Sales KPIs for Commercial Window & Curtain Wall Manufacturing in 2027
 pulse-industry-kpisTop 10 Sales KPIs for Modular Cleanroom Design & Construction in 2027
 pulse-industry-kpisTop 10 Sales KPIs for Branded Drug Manufacturer in 2027