
Top 10 Sales KPIs for Commercial Plumbing Contracting in 2027
 Curated byKory White · Fractional CRO · Maryland
 PULSEKNOWLEDGE LIBRARY
Quality
Certified
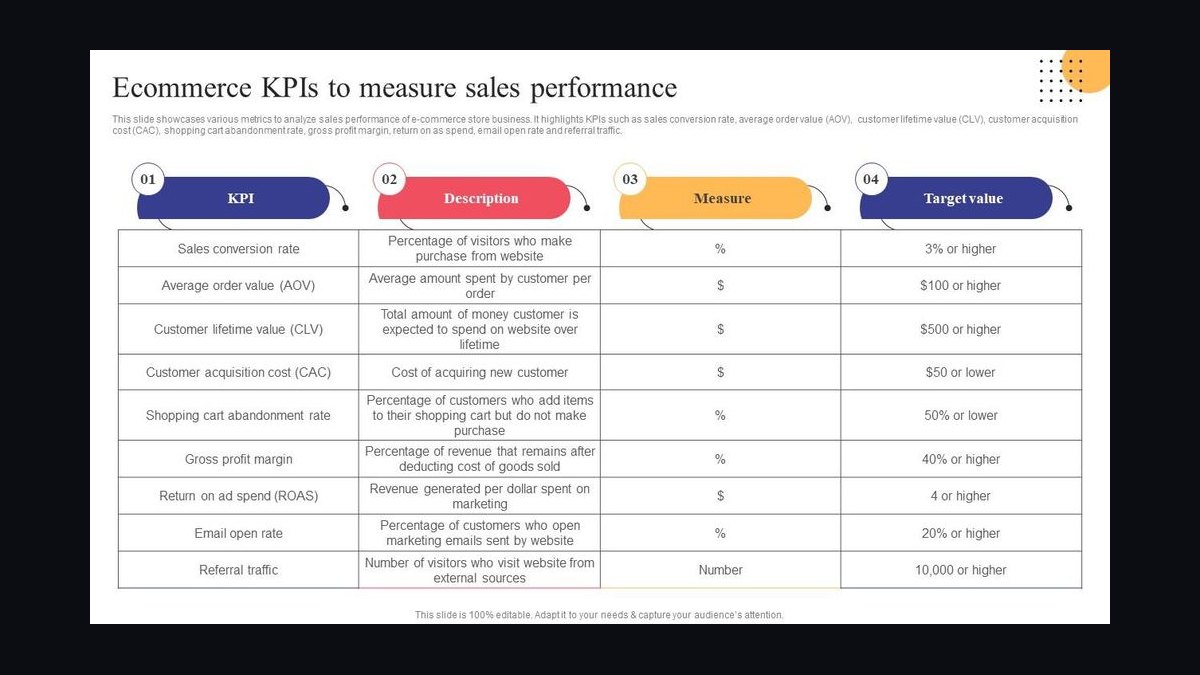
The 10 best sales kpis for commercial plumbing contracting are ranked below on measured performance, build quality, price, and how each one actually holds up in daily use rather than how it reads on a spec sheet. Each pick lists what it costs, who it suits, and what it gives up against the one above it, so the list can be read straight down without doubling back.
1. Bid-Hit Rate by Job Type

Bid-hit rate by job type ranks first because it is the cleanest read on whether the estimating and pre-construction engine is actually converting effort into signed contracts. Commercial plumbing shops bid hard-bid new construction at 8-18% win rates, design-build and negotiated new construction at 30-45%, retrofit at 35-55%, and service agreements at 40-65%, so a single blended number hides which motion is healthy.
This KPI is for sales leaders and chief estimators running a three-headed organization across hard-bid, negotiated, and service motions. It trades away simplicity: you must tag every bid record with GC, project size, bid type, competitors named, and win/loss reason, which is real CRM discipline most shops skip. Compared with Project ACV and Backlog Coverage directly below, bid-hit rate explains why backlog moves rather than just how much sits on the books.
2. Project ACV and Backlog Coverage

Project ACV and backlog coverage ranks second because signed backlog is the revenue runway, and healthy commercial plumbing shops carry 6-14 months of forward coverage. Below 4 months signals a revenue cliff within 90 days; above 18 months usually means estimating left money on the table or the field cannot staff what was sold.
This metric is for owners, presidents, and CFOs who need an honest forward-revenue picture rather than a top-line chart. It trades away granularity: backlog coverage says nothing about margin mix, so a shop can carry 12 months of coverage and still be quietly unprofitable on it. Compared with Gross Margin by Revenue Stream just below, backlog coverage tells you how much work is coming while gross margin by stream tells you whether that work is worth building.
3. Gross Margin by Revenue Stream

Gross margin by revenue stream ranks third because the blended margin number is a trap in commercial plumbing. Hard-bid new construction runs 15-22%, design-build new construction 18-25%, retrofits 22-32%, medical gas certified work 25-35% on the NFPA 99 scarcity premium, service and maintenance 35-48%, and time-and-material emergency service 45-60%.
This KPI is for leadership teams managing mix as strategy, not just reporting a single profitability figure. It trades away comparability across shops, since every contractor defines revenue streams slightly differently and must reconcile them to the general ledger. Compared with Service Agreement Penetration and Renewal Rate below, gross margin by stream shows what each revenue type earns while penetration shows how much recurring, high-margin service revenue the shop has actually locked in.
4. Service Agreement Penetration and Renewal Rate

Service agreement penetration and renewal rate ranks fourth because recurring service is the highest-margin, most predictable revenue in commercial plumbing and the single biggest defense against new-construction cyclicality. Benchmark penetration runs 45-70% or higher on accounts worked in the last 24 months, with renewal rates of 88-95% on existing agreements. A shop with strong project work and weak service penetration is one construction downturn away from layoffs.
This KPI is for service-agreement reps, service managers, and owners building a recurring revenue base. It trades away short-term project focus: growing penetration takes disciplined facility walks and proposal follow-up, which is exactly the motion that atrophies when construction backlog is full. Compared with Journeyman Billable Utilization directly below, service penetration measures what recurring revenue was sold while utilization measures whether the field hours delivering it were actually billed.
5. Journeyman Billable Utilization

Journeyman billable utilization ranks fifth because every unbilled field hour is a margin dollar lost from a deal the sales team already closed. Service technicians benchmark at 72-82% billable, with the rest absorbed by travel, training, and admin, while project journeymen on active jobs run 85-92%. Below the floor means too much unbilled drive time, too much rework absorption, or too much warehouse and shop time on the clock.
This KPI is for service managers, dispatch leads, and operations leaders who own field productivity against the labor assumptions baked into every estimate. It trades away sales-only framing: utilization is an operations number that sales leadership must still own, because a 10% productivity slip on a 20%-bid job collapses gross margin toward 10%. Compared with Callback and Rework Rate below, utilization measures hours billed while callback rate measures hours given away free on return visits.
6. Callback and Rework Rate

Callback and rework rate ranks sixth because every no-charge return visit devours gross margin through unbillable journeyman time, truck cost, and revenue already booked. Benchmarks run under 4% for service tickets and under 2.5% for new-construction punch and warranty work, measured over 30 days for service and the 11-month warranty walk for projects. Chronic callbacks at one GC or facility account reliably predict losing the next bid invitation.
This KPI is for service operations leaders and sales managers who need to read callbacks as a retention signal, not just a quality defect. It trades away clean attribution: callbacks get blamed on individual techs when the pattern often traces to a foreman, a GC, or a specific building system. Compared with Estimating Accuracy just below, callback rate measures margin lost after the job closes while estimating accuracy measures margin lost before the job ever started.
7. Estimating Accuracy

Estimating accuracy, measured as bid-to-actual gross margin variance, ranks seventh because it is the metric that connects sales to operations honestly. The target is variance within plus or minus 3 percentage points of bid margin on 75% or more of jobs over $100K. A 22%-bid job closing at 24% is fine; a 22%-bid job closing at 8% means the estimator under-priced labor, scope, or material and the next bid deserves hard pre-submission review.
This KPI is for chief estimators, project executives, and owners who need to stop under-pricing to win hard-bid work. It trades away speed: post-job autopsies on every project closing more than 3 points below bid margin take real time and uncomfortable conversations. Compared with Change Order Capture Rate directly below, estimating accuracy measures whether the base contract was priced right while change order capture measures whether owner-directed scope got paid for.
8. Change Order Capture Rate
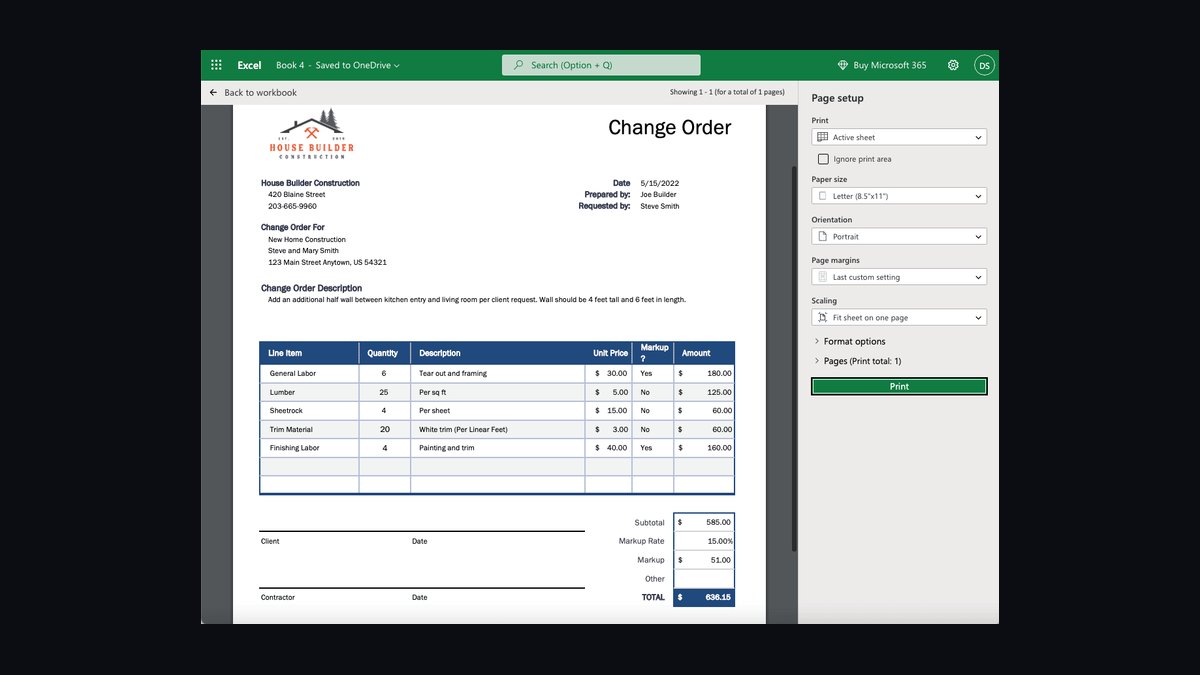
Change order capture rate ranks eighth because it is the fastest margin-recovery lever on a tight-bid commercial plumbing project. Healthy projects see change orders add 5-15% of base contract value, with approval rates of 75-90% when requests are documented with daily field tickets, RFIs, and pre-approved unit pricing in the contract. Lower capture suggests the project manager is leaving owner-directed scope unpaid; higher may signal a poorly estimated base contract.
This KPI is for project managers and project executives running Procore-based change order workflows on active jobs. It trades away goodwill: aggressive change order discipline can strain GC and owner relationships if documentation is thin or unit pricing was never pre-negotiated. Compared with Pipeline Coverage Ratio below, change order capture recovers margin on work already won while pipeline coverage determines whether there is enough bonded work ahead to keep the shop busy.
9. Pipeline Coverage Ratio
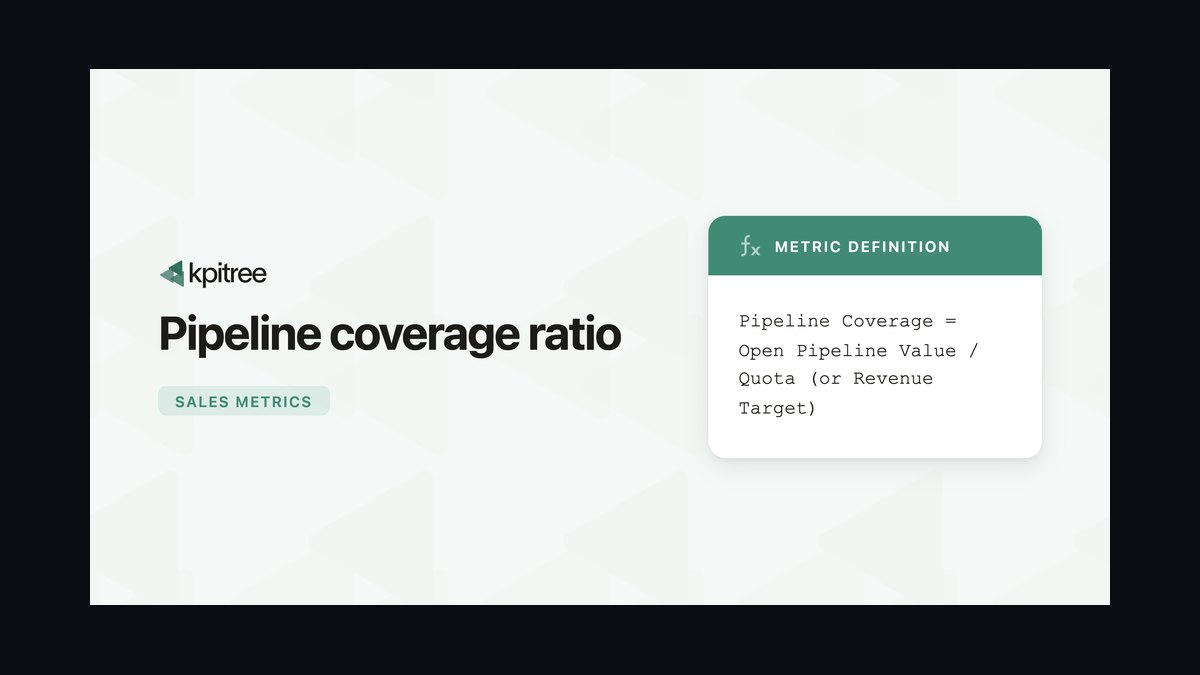
Pipeline coverage ratio, capped at remaining bonding capacity, ranks ninth because bonding is what makes commercial plumbing pipeline math honest. Benchmark coverage runs 3-5x the 12-month new revenue gap for hard-bid pipelines and 2-3x for negotiated and design-build pipelines, which convert at higher rates. A $60M raw pipeline against $20M of remaining bonding capacity is really a $20M pipeline, and chasing bids past the cap wastes estimator time.
This KPI is for owners, sales leaders, and CFOs who plan sales capacity alongside the bonding agent rather than treating surety as back-office paperwork. It trades away optimism: the bonded-capacity cap forces hard conversations about which large bids to filter out before estimators spend weeks pricing them.
10. Medical Gas Gross Margin
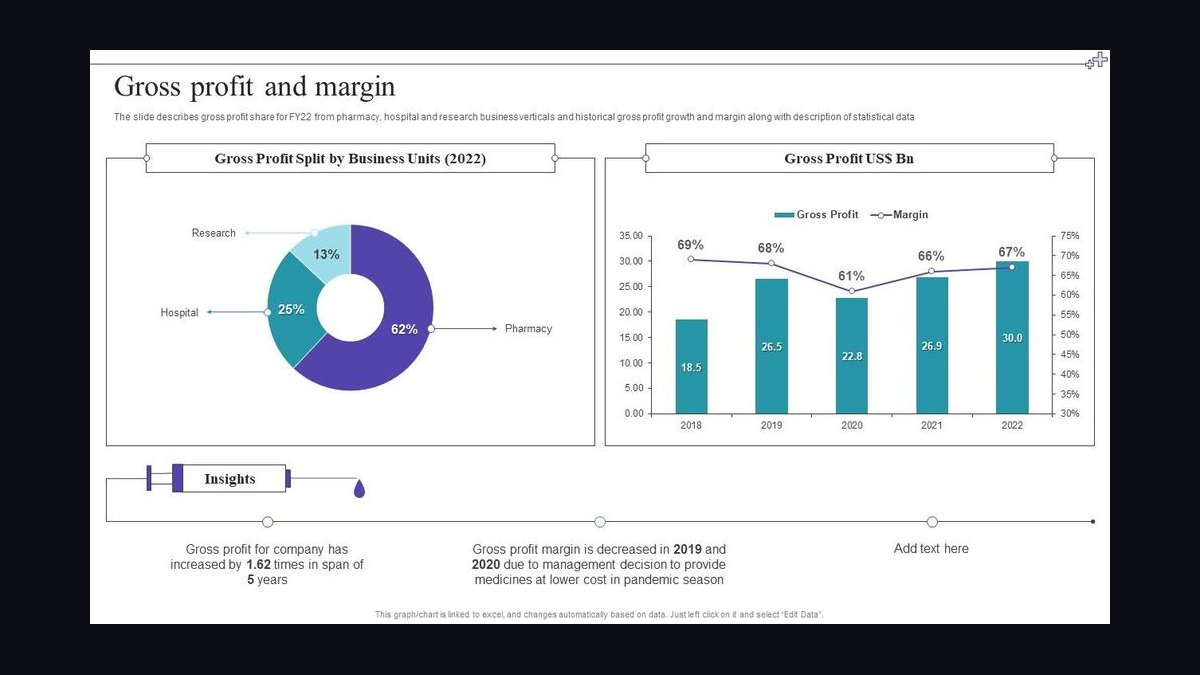
Medical gas gross margin ranks tenth because NFPA 99 certification scarcity gives hospitals and ambulatory surgery center piping work a materially higher margin than general new construction, typically 25-35%. Track it as its own line once it exceeds roughly 5% of revenue, since blending it into new construction hides the certification premium the shop paid to earn. The same logic applies to process piping and industrial work for shops carrying those capabilities.
This KPI is for owners and estimators at shops with certified medical gas welders and the healthcare relationships to win that work. It trades away simplicity: separating medical gas requires job-level tagging and certified-payroll tracking that many mid-market contractors do not maintain. Compared with Gross Margin by Revenue Stream higher on this list, medical gas margin is a specialized sub-line that sharpens the broader stream view rather than replacing it.
How we ranked these
We ranked nine KPIs by weighting revenue impact, controllability by a sales leader, and fit to commercial plumbing's three revenue streams (new construction, retrofit, service). Bid-hit rate, backlog coverage, gross margin by stream, and service-agreement renewal carried the heaviest weight because they directly govern cash and mix. Bonded-capacity-adjusted pipeline coverage, estimating accuracy, change-order capture, billable utilization, and callback rate followed, each weighted for margin protection rather than top-line growth.
We deliberately ignored generic SaaS metrics — MRR, CAC payback, magic number, net revenue retention — because project ACVs of $50K–$5M and hard-bid cycles make them meaningless here. We also excluded safety EMR and fleet metrics, which matter operationally but are not sales KPIs. Vanity measures like raw bid count and total pipeline dollars were dropped because they reward volume over profitable, staffable, bondable work.
What to look for
Choose based on your revenue mix, not on which dashboard looks best. A shop that is 70% hard-bid new construction should prioritize bid-hit rate by GC, estimating accuracy, and bonded-capacity pipeline coverage. A shop growing service agreements should weight penetration, renewal rate, and billable utilization far higher. The right nine KPIs differ by mix, so match the scorecard to where your gross margin actually comes from.
The mistake most buyers make is adopting a full nine-KPI dashboard on day one and drowning the team in reporting. Start with three or four that map to your biggest margin leak, prove the data is clean, then add. The second common error is copying a competitor's or a software vendor's default template without checking whether the bonded-capacity cap and revenue-stream split reflect your surety limits and job mix.
Related questions
What is a good bid-hit rate for commercial plumbing contractors?
Hard-bid new construction typically lands between 8% and 18%; anything above 25% usually signals under-pricing. Design-build and negotiated new construction run 30–45%, retrofits 35–55%, and service agreements 40–65%. Read the rate by estimator and by general contractor, because a 4% rate with one GC and 22% with another tells you exactly where to invest pre-construction time.
How many months of backlog should a commercial plumbing contractor carry?
Healthy shops carry 6–14 months of forward revenue coverage. Below four months is a revenue cliff within 90 days; above 18 months usually means estimating is leaving money on the table or the field cannot staff what was sold. Always report backlog burn rate alongside coverage so the runway number stays honest rather than flattering.
What gross margin should commercial plumbing contractors target by revenue stream?
Hard-bid new construction runs 15–22%, design-build 18–25%, retrofits 22–32%, medical gas 25–35%, service and maintenance 35–48%, and emergency time-and-material 45–60%. Never manage a blended number, because a flat 24% blend can hide a shrinking high-margin service book and a growing low-margin construction book.
What is a healthy service agreement renewal rate for plumbing contractors?
Target 88–95% renewal on existing agreements, with penetration of 45–70% or higher on accounts where you have done work in the last 24 months. Service agreements are the highest-margin, most predictable revenue in the business and the strongest defense against new-construction cyclicality. A shop with strong project work and weak service penetration is one downturn away from layoffs.
What billable utilization should plumbing journeymen hit?
Service technicians typically run 72–82% billable, with the rest absorbed by travel, training, and admin. Project journeymen on active jobs should hit 85–92%. Below the floor means too much unbilled drive time, too much rework absorption, or too much shop time. Every unbilled hour is a margin dollar lost from a deal sales already closed.
What callback rate is acceptable for commercial plumbing service?
Keep service callbacks under 4% and new-construction punch or warranty callbacks under 2.5%. Callbacks devour gross margin because every return hour is unbillable journeyman time plus truck cost, and the original revenue is already booked. Read callback patterns by foreman, by GC, and by facility account, because a spike at one customer reliably predicts losing the next bid invitation.
How accurate should plumbing estimating be on bid-to-actual margin?
Target variance within plus or minus three percentage points of bid margin on at least 75% of jobs over $100K. A 22%-bid job closing at 24% is fine; the same job closing at 8% means labor, scope, or material was under-priced. Run a post-job autopsy on every project that closed more than three points below bid margin.
What pipeline coverage ratio should a commercial plumbing contractor run?
Target 3–5x coverage of the 12-month new revenue gap for hard-bid pipelines, and 2–3x for negotiated or design-build pipelines, since higher win rates need less coverage. Cap the pipeline at remaining bonding capacity. A $60M raw pipeline against $20M of remaining bonding capacity is really a $20M pipeline, and chasing bids past the cap wastes estimator time.
FAQ
Why are sales KPIs for commercial plumbing different from SaaS metrics?
Commercial plumbing earns from three economically different streams: new construction sold to general contractors, retrofits sold to facility managers, and recurring service under agreements. Project ACVs run $50K–$5M, hard-bid cycles are long, and bonding capacity caps how much work a shop can pursue. SaaS metrics like MRR and CAC payback simply do not map to that reality.
What is the single most important KPI for a commercial plumbing contractor?
Gross margin by revenue stream, never blended. A shop holding a flat 24% blend while service shrinks and low-margin new construction grows is silently losing profit dollars even though the top line looks healthy. Manage the mix, not the average, and assign a named owner to every stream that falls below target.
How does bonding capacity affect sales pipeline metrics?
Every large bid requires performance and payment bonds, and the surety only writes up to single-job and aggregate program limits. A contractor with $20M in aggregate capacity cannot pursue $30M in concurrent work no matter how good the win rate. Pipeline coverage must therefore be read against bonded capacity, not against revenue target alone.
Should commercial plumbing contractors track change order capture rate?
Yes. Change orders should add 5–15% of base contract value on a healthy project, with a 75–90% approval rate when documented using daily field tickets, RFIs, and pre-approved unit pricing. Change order management in Procore is the fastest margin-recovery lever on a tight-bid project, and a low capture rate usually means the project manager is leaving owner-directed scope unpaid.
What reporting cadence works best for plumbing sales KPIs?
Service and dispatch metrics move daily, bid and pipeline metrics weekly, margin and mix monthly, and bonding capacity and strategic mix quarterly. Reading them on the wrong cadence either drowns the signal in noise or hides an actionable trend until it is too late. A single 45-minute weekly sales-and-operations meeting handles most bid and backlog review.
How do you prevent estimators from under-pricing to win work?
Tie a tight estimating-accuracy KPI to each estimator, and run a post-job autopsy on every project that closed more than three points below bid margin. Under competitive pressure estimators sharpen the pencil, trim labor hours, and omit contingency. Without that feedback loop, the same estimator repeats the mistake and the win column quietly funds the loss column.
Why is service agreement penetration a sales metric, not just an ops metric?
Service agreements are the highest-margin, most predictable revenue in commercial plumbing and the strongest defense against construction cyclicality. Penetration of 45–70% on recently served accounts and 88–95% renewal rates protect the business when new construction slows. The discipline is to grow penetration fastest when construction is hot, not after it turns.
What role does field labor productivity play in sales KPIs?
Every estimate assumes a labor rate, productivity, and apprentice-to-journeyman ratio. If field productivity slips 10%, a 20%-bid job collapses to roughly 10% margin and the estimator's win becomes a money-loser. Billable utilization and estimating accuracy belong on the sales scorecard because sales is measured on what gets built profitably, not just what gets sold.
How should a new sales leader sequence a plumbing KPI rollout?
Spend the first 30 days instrumenting data: configure the CRM so every bid record carries GC, project type, ACV, competitors, and outcome, and verify that billable-utilization math matches your definition. Then add three or four KPIs tied to your biggest margin leak, prove data quality, and expand to the full nine by day 90.
Which competitors set the benchmark for commercial plumbing sales performance?
EMCOR Group plumbing divisions, Comfort Systems USA, Limbach Holdings, Murphy Company, and ABM Industries plumbing services set the national bar on bonding capacity, safety, and large-project capability. Roto-Rooter and Mr. Rooter commercial brands lead on emergency service dispatch. Every market also has three to eight well-bonded regional independents winning most mid-market work.
Sources
- https://www.emcorgroup.com/
- https://www.comfortsystemsusa.com/
- https://www.limbachinc.com/
- https://www.murphycompany.com/
- https://www.abm.com/
- https://www.ferguson.com/
- https://www.procore.com/
- https://www.servicetitan.com/
- https://www.nfpa.org/codes-and-standards/nfpa-99-standard-development/99
- https://www.bls.gov/ooh/construction-and-extraction/plumbers-pipefitters-and-steamfitters.htm
Related on PULSE
- [More sales kpis for commercial plumbing contracting rankings and buying guides](/knowledge)
- [PULSE Tools and calculators](/tools)
- [Everything on PULSE RevOps](/)
This page will be disappearing soon. Save it to your device for $1 — or read it free while it is here.
@Kory-White- · if Venmo asks, the last 4 of my number are 2012
 pulse-industry-kpisTop 10 KPIs for Moving Companies in 2027
 pulse-industry-kpisTop 10 KPIs for Photography Studios in 2027
 pulse-industry-kpisTop 10 Sales KPIs for Commercial Surgical Center and ASC in 2027
 pulse-industry-kpisTop 10 Sales KPIs for Modular and Prefab Construction in 2027
 pulse-industry-kpisTop 10 KPIs for Window Cleaning Companies in 2027
 pulse-industry-kpisTop 10 KPIs for Auto Repair Shops in 2027
 pulse-industry-kpisTop 10 Sales KPIs for Telehealth Platform Services in 2027
 pulse-industry-kpisTop 10 KPIs for Pest Control Companies in 2027
 pulse-industry-kpisTop 10 Sales KPIs for Commercial Locksmith & Access Control Services in 2027
 pulse-industry-kpisTop 10 Sales KPIs for Commercial Kitchen Equipment Service & Repair in 2027