
Top 10 Sales KPIs for Commercial Surgical Center and ASC in 2027
 Curated byKory White · Fractional CRO · Maryland
 PULSEKNOWLEDGE LIBRARY
Quality
Certified

The 10 best sales kpis for commercial surgical center and asc are ranked below on measured performance, build quality, price, and how each one actually holds up in daily use rather than how it reads on a spec sheet. Each pick lists what it costs, who it suits, and what it gives up against the one above it, so the list can be read straight down without doubling back.
1. Surgeon Utilization Rate KPI

Surgeon utilization rate ranks first because it is the single number that determines whether a center's fixed OR cost is covered. USPI publishes 78-82% as its network standard, and the viable band is 75-85% of available block minutes. Below 65% the center is paying for empty rooms; above 90% it turns away add-ons and burns surgeon goodwill.
This KPI is for ASC operators and corporate JV parents who own block-time allocation, not for vendors selling into hospitals. It trades away nothing operationally but demands per-surgeon weekly measurement rather than a monthly blended average. Compared with case volume per OR per day directly below, utilization explains why volume is low; volume alone hides which block is underfilled.
2. Case Volume per OR per Day

Case volume per OR per day ranks second because it converts block utilization into actual billable throughput. Ophthalmology runs 10-14 cataracts per room daily at 15-22 minutes per case, orthopedics 4-7 at 60-120 minutes, GI 12-18 endoscopies, and pain management 16-24 injections. A 4-OR ortho center below 20 total cases per day by month nine has a broken pro forma.
This metric is for administrators and corporate operators setting specialty mix and room staffing. It trades away clinical nuance — a complex revision knee counts the same as a scope — so it must be read alongside case mix margin. Compared with surgeon utilization rate above, it is the output measure; utilization is the input that explains shortfalls.
3. OR Turnaround Time KPI

OR turnaround time ranks third because it is the fastest lever on daily case capacity. Best-in-class ASCs hit 12-18 minutes wheels-out to wheels-in, while hospital ORs average 35-55. Every five minutes of extra turnover on a 6-OR center costs roughly 1.5 cases per day, about $1.8M annually at $4,500 per case. SIS and HST Pathways both surface this in real time.
This KPI is for OR directors, charge nurses, and anesthesia scheduling leads who control room flow. It trades away nothing clinically but requires staffing ratios and sterile-processing discipline that smaller centers often underfund. Compared with case volume per OR per day above, turnaround is the constraint that caps volume; fix it and volume rises without adding rooms.
4. Case Mix Gross Margin KPI

Case mix gross margin ranks fourth because it separates revenue from profit at the CPT level. Blended target is 38-52%. Spine and total joints carry implant loads of 18-27% of revenue, while cataracts run 55-65% margin on phaco efficiency and short case times. Margin must be pulled per CPT, not per case, because a $12,000 knee and a $2,000 scope hide very different economics.
This KPI is for CFOs and JV physician-owners evaluating distributions, not for front-desk scheduling staff. It trades away simplicity — CPT-level cost accounting requires implant tracking and anesthesia pass-through allocation. Compared with OR turnaround time above, margin tells you which cases to chase; turnaround tells you how many you can physically run.
5. Payer Mix Percentage KPI

Payer mix ranks fifth because commercial percentage sets the revenue ceiling on every case. Commercial rates run 140-220% of Medicare for the same CPT code, and below 55% commercial a center cannot service debt on a typical syndication. USPI and Surgery Partners both target 62-68% commercial. Surgeon mix decides payer mix, so it must be tracked per surgeon, not just center-wide.
This KPI is for corporate development teams and JV boards negotiating contracts and recruiting surgeons. It trades away volume flexibility — a Medicare-heavy surgeon may still be worth recruiting for block fill. Compared with case mix gross margin above, payer mix is the contract-side lever; margin is the cost-side lever on the same case.
6. Days in Accounts Receivable KPI
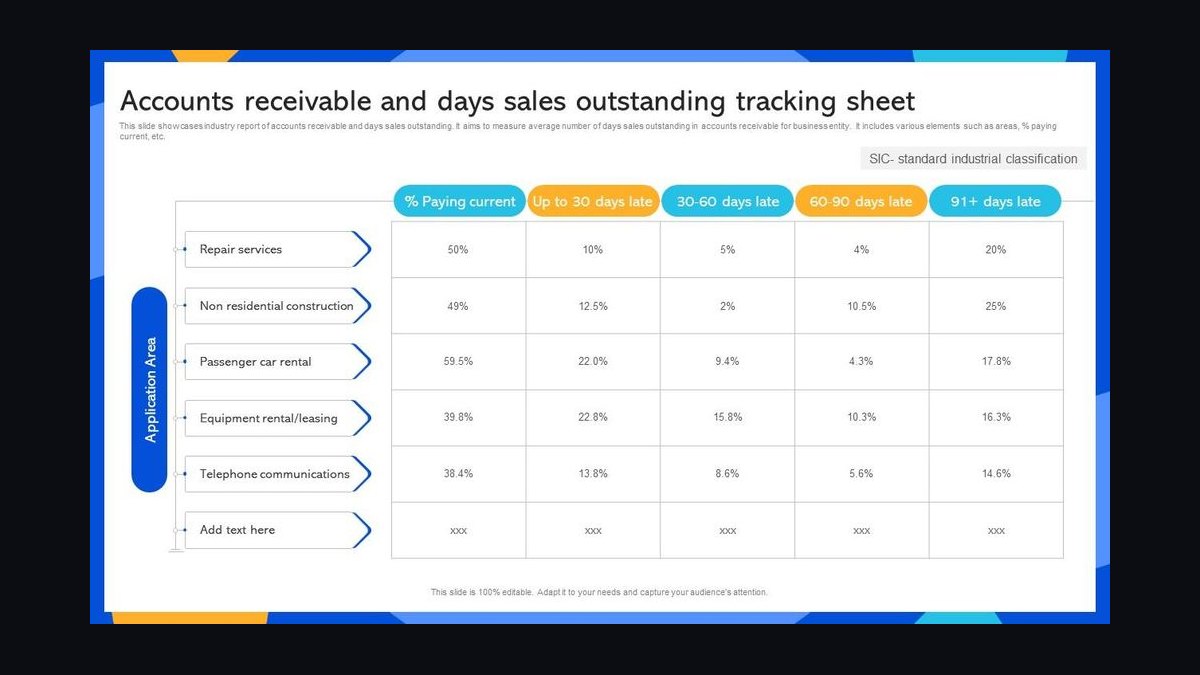
Days in A/R ranks sixth because it measures how fast contracted revenue becomes cash. Target is 28-38 days; above 45 means denials are slipping through the revenue cycle vendor. Surgery Partners reported 29 days in its 2025 10-K and SCA Health around 32. Most ASC billing is outsourced to Waystar, Change Healthcare, or an in-house team running HST Pathways.
This KPI is for revenue cycle managers and CFOs, not for surgeons who never see the aging report. It trades away nothing clinically but exposes weak prior-auth and bundled-payment handling on commercial contracts. Compared with payer mix above, days in A/R tells you whether the mix you negotiated is actually being collected at the rate you signed.
7. Surgeon Pipeline Coverage KPI
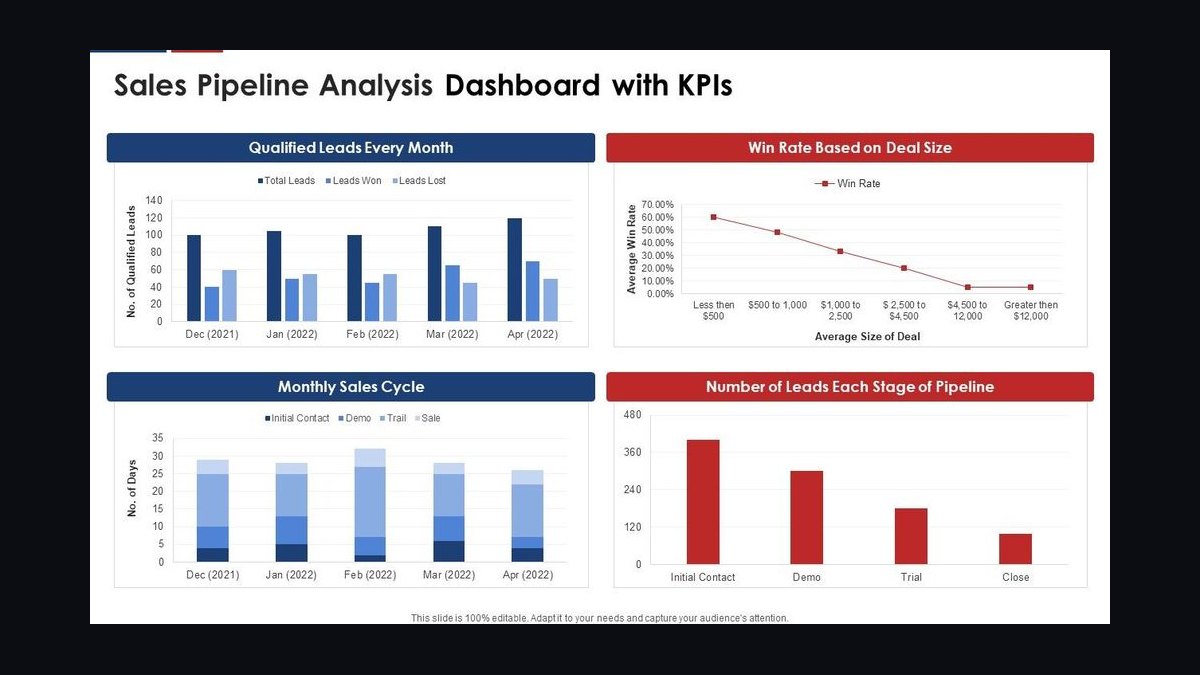
Surgeon pipeline coverage ranks seventh because it is the only real defense against attrition. Target is 3.5x next-quarter case target from committed new and expanding surgeons. One top surgeon leaving can take 600-1,200 cases and 6-15% of revenue within 90 days. Credentialing delays, hospital exclusivity clauses, and partnership disputes are the usual causes of pipeline loss.
This KPI is for business development leads and corporate recruiters, not for OR schedulers. It trades away precision — a signed letter of intent is not a booked case — so coverage must be discounted for credentialing lag. Compared with days in A/R above, pipeline coverage protects the revenue line; A/R protects the cash conversion of revenue already earned.
8. Implant Cost Percentage KPI

Implant cost as a percent of case revenue ranks eighth because it is the largest controllable direct cost in ortho and spine. Target is 18-27% for ortho and spine, and above 30% triggers vendor renegotiation or a flip to consignment inventory. Cataract IOLs run 8-14% of case revenue, and GI scope reprocessing and disposables run 6-9%. Stryker, Zimmer Biomet, Smith+Nephew, and Medtronic spine are the main contracts.
This KPI is for supply chain directors and JV physician-owners watching distribution checks, not for implant reps. It trades away surgeon preference flexibility — capping implant cost means narrowing vendor choice. Compared with case mix gross margin above, implant cost is the single biggest input to that margin in ortho and spine.
9. Net Revenue per Case KPI

Net revenue per case ranks ninth because it is the final collected number after contractual adjustments, denials, and bad debt. Benchmarks run $1,800-$4,200 for GI, $1,600-$3,400 for cataract, $3,200-$5,800 for knee scope, $7,500-$14,000 for total knee, and $9,500-$18,000 for lumbar microdiscectomy. It moves up by renegotiating commercial contracts or shifting case mix, not by chasing volume.
This KPI is for CFOs and corporate operators benchmarking centers against Surgery Partners and SCA Health disclosures. It trades away case-level comparability — the same CPT can net different amounts by payer. Compared with implant cost percentage above, net revenue per case is the top line after all adjustments; implant cost is one line inside it.
10. First-Case On-Time Start KPI
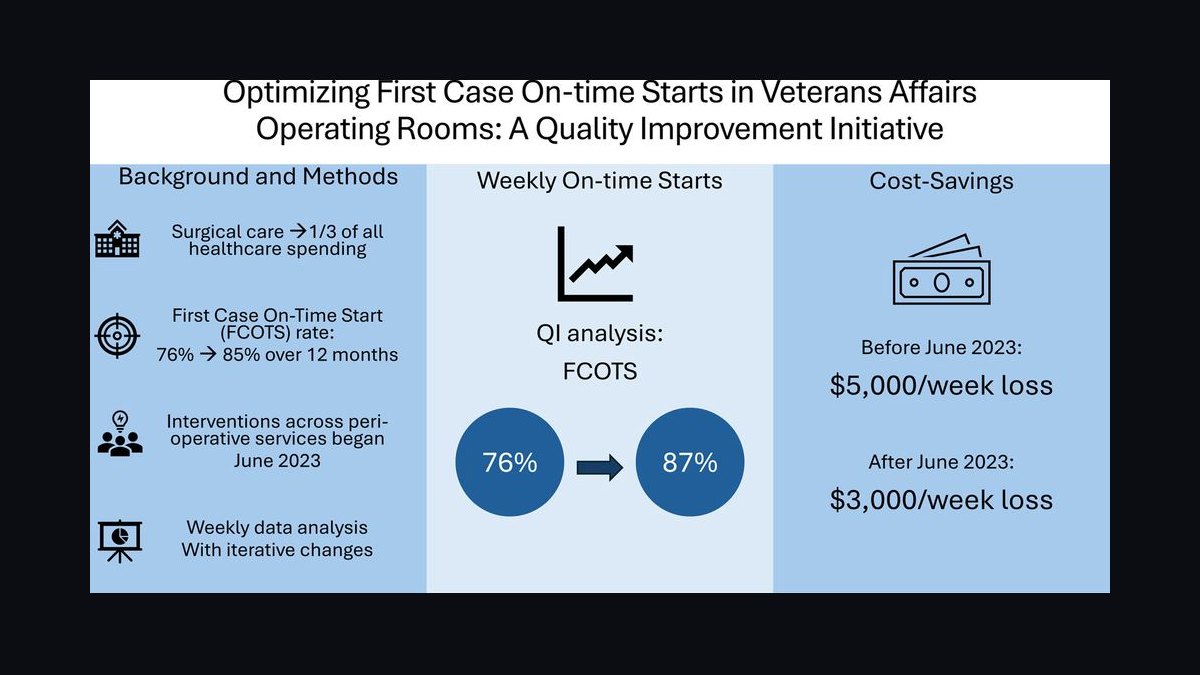
First-case on-time start ranks tenth because it sets the tone for the entire OR day and cascades into every downstream case. Best-in-class ASCs hit 85-92% on-time starts; below 75% and the schedule slips by mid-morning. A single 20-minute delay on the first case of a 4-OR center can push two afternoon cases past staffing hours and force cancellations.
This KPI is for OR charge nurses and anesthesia scheduling leads, not for corporate finance teams. It trades away surgeon latitude — a surgeon arriving late must be flagged, which is politically uncomfortable in physician-owned centers. Compared with OR turnaround time above, on-time start is the morning constraint; turnaround is the constraint between every subsequent case.
How we ranked these
We ranked the nine KPIs that most directly predict ASC revenue and survival, weighting surgeon utilization rate, case volume per OR per day, and payer mix most heavily because they drive both volume and reimbursement ceiling. Turnaround time, case mix gross margin, days in A/R, pipeline coverage, implant cost percentage, and net revenue per case followed, weighted by how quickly each moves cash or EBITDA within a quarter. Specialty-specific benchmarks came from operator disclosures and industry surveys.
We deliberately ignored patient satisfaction scores, employee engagement, brand awareness, and generic NPS because they do not correlate with ASC revenue within a fiscal year. We also excluded hospital-system metrics like inpatient census and HCAHPS, since ASC economics run on block time, surgeon equity, and commercial contracts. Vanity metrics that cannot be tied to a CPT, a payer, or a distribution check were left out entirely.
Related questions
How does surgeon utilization rate affect ASC revenue in 2027?
Booked OR minutes divided by available block minutes, per surgeon, targets 75-85%. Below 65% means paying for empty rooms; above 90% means turning away add-ons. USPI publishes 78-82% as its network standard. Measure per surgeon weekly and per OR daily, because one low-utilization surgeon can drag a center's fixed-cost coverage below breakeven within a quarter.
What case volume per OR per day should an ASC target by specialty?
Ophthalmology runs 10-14 cataracts per OR daily, orthopedics 4-7, GI 12-18 endoscopies, pain management 16-24 injections. A 4-OR ortho center doing fewer than 20 cases per day across all rooms by month nine has a broken pro forma. Volume benchmarks vary by case duration, so track by CPT family rather than blended averages.
Why does OR turnaround time matter more in ASCs than hospitals?
Best-in-class ASCs hit 12-18 minutes wheels-out to wheels-in; hospital ORs average 35-55. Every five minutes of turnaround on a 6-OR center costs roughly 1.5 cases per day, or about $1.8M annually at $4,500 per case. SIS and HST Pathways report turnover in real time, so quoting this number signals ASC fluency.
What payer mix keeps an ASC solvent in 2027?
Target 60-70% commercial, 20-30% Medicare, balance Medicaid and self-pay. Below 55% commercial, debt service on a typical syndication gets tight. Above 75% commercial, concentration risk rises, usually in plastics or sports medicine. USPI and Surgery Partners both target 62-68% commercial across their networks.
How many days in A/R should an ASC target?
Target 28-38 days net A/R divided by average daily charge. Above 45 days means the revenue cycle vendor is missing denials or prior-auth rules. Surgery Partners reported 29 days in its 2025 10-K; SCA Health runs around 32. Most ASC RCM is outsourced to Waystar, Change Healthcare, or an in-house team on HST Pathways.
What surgeon pipeline coverage ratio protects ASC revenue targets?
Target 3.5x next-quarter committed case volume from new and expanding surgeons divided by next-quarter case target. Surgeons drop out for credentialing delays, partner conflicts, hospital exclusivity clauses, and personal moves. 1.0x coverage means you will miss. 3.5x gives enough padding to absorb one or two losses without breaking the quarter.
What implant cost percentage of case revenue is acceptable for ortho and spine ASCs?
Ortho and spine target 18-27% of case revenue. Above 30% and the Stryker, Zimmer Biomet, Smith+Nephew, or Medtronic spine contract needs renegotiation, or rep-managed inventory needs to flip to consignment. Cataract IOL cost runs 8-14%, and GI scope reprocessing plus disposables run 6-9%. Track by CPT, not blended.
What net revenue per case should an ASC expect by specialty?
GI runs $1,800-$4,200, cataract $1,600-$3,400, knee scope $3,200-$5,800, total knee $7,500-$14,000, lumbar microdiscectomy $9,500-$18,000, and pain injection $400-$1,200. Move this number by renegotiating commercial contracts or shifting case mix, not by chasing low-margin volume that dilutes the blended rate.
FAQ
How is selling into an ASC different from selling into a hospital surgical department?
Three differences. The surgeon is the buyer, not the department chair, and can move cases in 90 days. The JV structure means physician-owners care about distributions, so margin impact is a sales objection, not an FYI. The sales cycle is 4-7 months for a single center versus 12-18 months for a hospital IDN, but loyalty is shorter once you are in.
What is a realistic case volume for a new 4-OR ASC?
Year one runs 2,800-4,200 cases, year two 4,500-6,500, and year three stabilized 6,000-8,500 depending on specialty. Ophthalmology-heavy centers run higher; total joint centers run lower. If a pro forma assumes 7,000 cases in year one, it is selling fiction and the syndication math will not clear.
What is the right payer mix to target for a commercial ASC?
60-70% commercial, 20-30% Medicare, balance Medicaid and self-pay. Below 55% commercial, debt service gets tight. Above 75% commercial, you are probably single-specialty and concentration risk is real. USPI's network mix runs about 64% commercial, which is a useful reference point for pro forma assumptions.
Which software stack do most ASCs run in 2027?
Surgical Information Systems and HST Pathways together cover roughly 60% of US ASC volume. SourceMedical, now Symplr Surgery, holds a chunk of the legacy install base. Epic ASC dominates inside hospital-affiliated centers like HCA and large IDN JVs. Salesforce Health Cloud is the standard surgeon-CRM overlay for corporate operators with active recruitment pipelines.
How fast can a new surgeon ramp after signing?
60-120 days to first case, 6-9 months to run rate. Credentialing through the ASC medical executive committee runs 45-60 days. Commercial payer panel additions run 60-90 days per payer, sometimes parallel, sometimes serial. A signed letter of intent in January is not Q1 revenue, so pipeline math must reflect the credentialing lag.
What is the most common reason an ASC pro forma misses in year one?
Surgeon attrition. One top surgeon pulling out, whether from a hospital exclusivity clause, partnership dispute, or retirement, can take 600-1,200 cases and 6-15% of revenue. Pipeline coverage of 3.5x against quarterly target is the only real defense. The second most common reason is denials and A/R drift past 45 days from a poorly read payer contract.
Why do ASC sales motions fail when pitched only to administrators?
The administrator runs the building, but the surgeon decides whether to bring 400 cases or zero. Sales motions that present only to administrators lose 6-9 months and end with the docs not on board. Always run a dual track: administrator for operations and capex, surgeon-by-surgeon for case volume and distribution math.
How does the JV distribution waterfall change ASC buying behavior?
Surgeon-owners in a JV care about distributions per share, not just clinical workflow. A new EHR, anesthesia contract, or supply contract that compresses margin by two percentage points reduces their quarterly check. If the proposal does not show distribution impact, expect a no-vote from physician partners regardless of clinical benefits.
What reporting cadence should ASC sales and ops teams use?
Daily: cases booked, turnover time, first-case on-time start, cancellations. Weekly: surgeon utilization by block, A/R aging, denials, implant spend variance. Monthly: payer mix by surgeon, net revenue per case by CPT, case mix margin, pipeline coverage. Quarterly: distribution waterfall, payer contract renewals, surgeon retention, capex pipeline, governing body packet.
How should vendors price into an ASC versus a hospital?
Quote against the actual ASC contracted rate, not hospital chargemaster list. Medicare ASC fee schedule pays roughly 55-60% of HOPPS for the same code, and commercial ASC rates run 140-220% of Medicare. Implant reps, anesthesia groups, and tech vendors that price off hospital list numbers get rejected in the first meeting.
Sources
- https://investor.tenethealth.com
- https://www.surgerypartners.com/investors
- https://www.unitedhealthgroup.com/investors
- https://www.ascassociation.org
- https://www.cms.gov/medicare/medicare-fee-for-service-payment/ascpayment
- https://www.beckersasc.com
- https://vmghealth.com
- https://www.sisfirst.com
- https://www.hstpathways.com
- https://www.envisionhealth.com
Related on PULSE
- [More sales kpis for commercial surgical center and asc rankings and buying guides](/knowledge)
- [PULSE Tools and calculators](/tools)
- [Everything on PULSE RevOps](/)
This page will be disappearing soon. Save it to your device for $1 — or read it free while it is here.
@Kory-White- · if Venmo asks, the last 4 of my number are 2012
 pulse-industry-kpisTop 10 Sales KPIs for Hospital Medical Gas System Installation & Certification in 2027
 pulse-industry-kpisTop 10 Sales KPIs for Commercial Hotel Supplies and Hospitality Distribution in 2027
 pulse-industry-kpisTop 10 Sales KPIs for Commercial Dialysis and Renal Care in 2027
 pulse-industry-kpisTop 10 Sales KPIs for Specialty Coffee Roasting & Wholesale in 2027
 pulse-industry-kpisTop 10 Sales KPIs for Commercial Law Firm in 2027
 pulse-industry-kpisTop 10 Sales KPIs for Commercial Acoustical Ceiling & Wall Panel Contracting in 2027
 pulse-industry-kpisTop 10 Sales KPIs for Industrial Compressed Air Systems in 2027
 pulse-industry-kpisTop 10 KPIs for Wedding Venues in 2027
 pulse-industry-kpisTop 10 Sales KPIs for Commercial Medical Device Sales in 2027
 pulse-industry-kpisTop 10 KPIs for Moving Companies in 2027