
Top 10 Sales KPIs for Restaurant Point-of-Sale (POS) Systems in 2027
 Curated byKory White · Fractional CRO · Maryland
 PULSEKNOWLEDGE LIBRARY
Quality
Certified
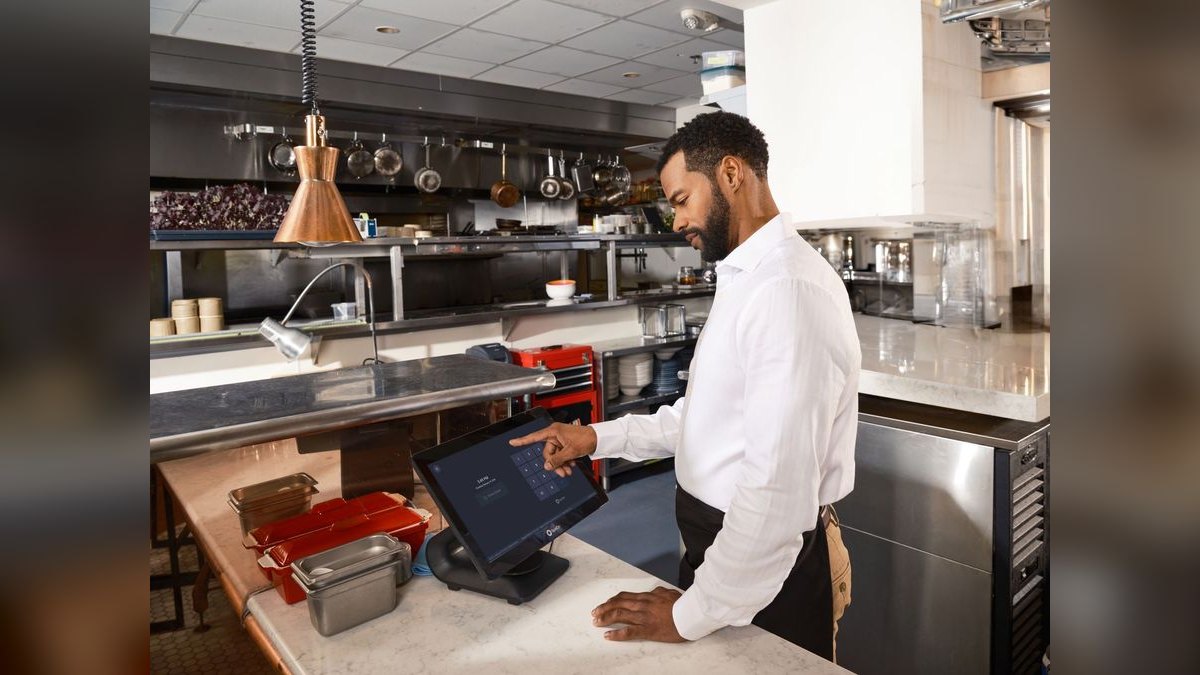
The key sales KPIs for the Restaurant Point-of-Sale (POS) Systems industry in 2027 are Locations Live, ARR per Location, Payment Processing Take Rate, GPV per Location, Net Revenue Retention, Module Attach Rate, SMB versus Multi-Unit Mix, Annual Logo Churn, and CAC Payback — together they show whether new openings outrun closures and whether payments revenue compounds per site.
Two revenue models hide behind the same terminal
The reason restaurant POS metrics confuse newcomers is that two very different revenue engines sit behind one countertop terminal, and the KPI set you emphasize depends entirely on which one you actually run. Get this wrong and every downstream number lies to you.
The SaaS-first model treats the POS as software subscription revenue. A single-unit restaurant pays roughly $69–$165 per month for the core platform, plus per-module fees for online ordering, kitchen display, loyalty, and labor scheduling. Under this lens, ARR per Location, Module Attach Rate, and Net Revenue Retention are the headline numbers. The business looks like classic vertical SaaS — 22–30% software gross margins, a clean upgrade path, and metrics any B2B SaaS operator would recognize on sight.
The payments-first hybrid model treats software as a wedge to land the processing rail. Here a restaurant processes $1–3M of annual card volume at a 2.5–3.5% all-in gross rate, so payments revenue per location runs $25,000–$90,000 per year against just $800–$2,000 of software ARR. Under this lens, GPV per Location, Payment Processing Take Rate, and payments penetration dominate the scorecard, and hardware becomes a deliberate loss-leader — often given away — to lock in the rail.
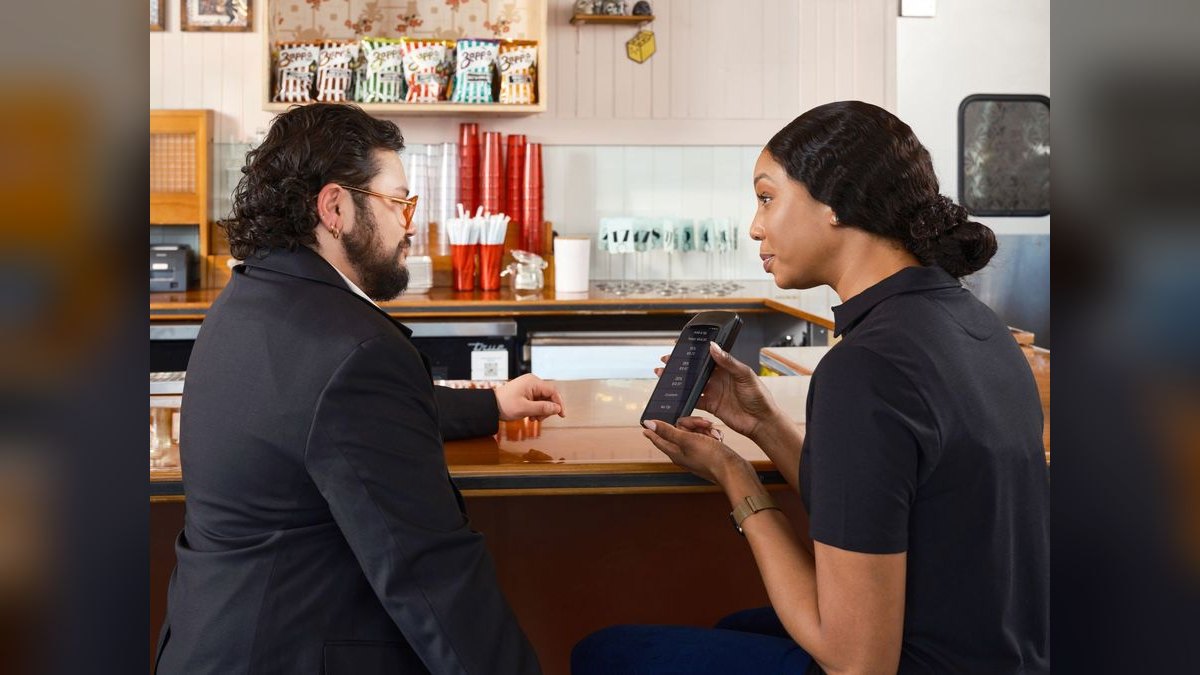
The distinction is not academic. If you model this business as pure SaaS you miss roughly 80% of the revenue, because Toast, Square for Restaurants, Clover, and Shift4 all earn far more from payments than from subscriptions. But if you ignore the software attach motion, retention collapses — a location live on payments and nothing else churns two to three times faster than one running four modules. Mature operators run both models simultaneously and report a blended ARR per location that folds payments inside the number. Toast reported roughly $14,400 ARR per location in Q3 2025 with payments included, growing 16–17% year over year. The right way to read this industry is not "software company" or "payments company" but a single metric stack where every subscription dollar exists to protect a processing dollar an order of magnitude larger. Choosing the wrong frame is the most expensive mistake a new sales leader makes here.
How to decide which operating motion to lead with
The choice between an SMB-velocity motion and a multi-unit-retention motion is dictated by one brutal fact about the underlying Restaurant industry: only about 40% of new restaurants survive five years, which mechanically forces Annual Logo Churn into the 18–32% range for any SMB-heavy book. You cannot retention-program your way out of a customer that closes its doors, and no comp plan changes that math.
That reality splits the strategy cleanly. An SMB-velocity motion accepts high closure churn and wins by out-opening it. The US opens roughly 70K full-service plus 140K limited-service restaurants per year against about 1M total locations, so acquisition speed and CAC Payback become the metrics that matter most. A multi-unit-retention motion instead chases 10-to-99-unit and enterprise chains that churn at just 2–6% annually, land at $2–4M of ARR plus payments per logo, and reward a completely different comp plan, implementation team, and integration roadmap.
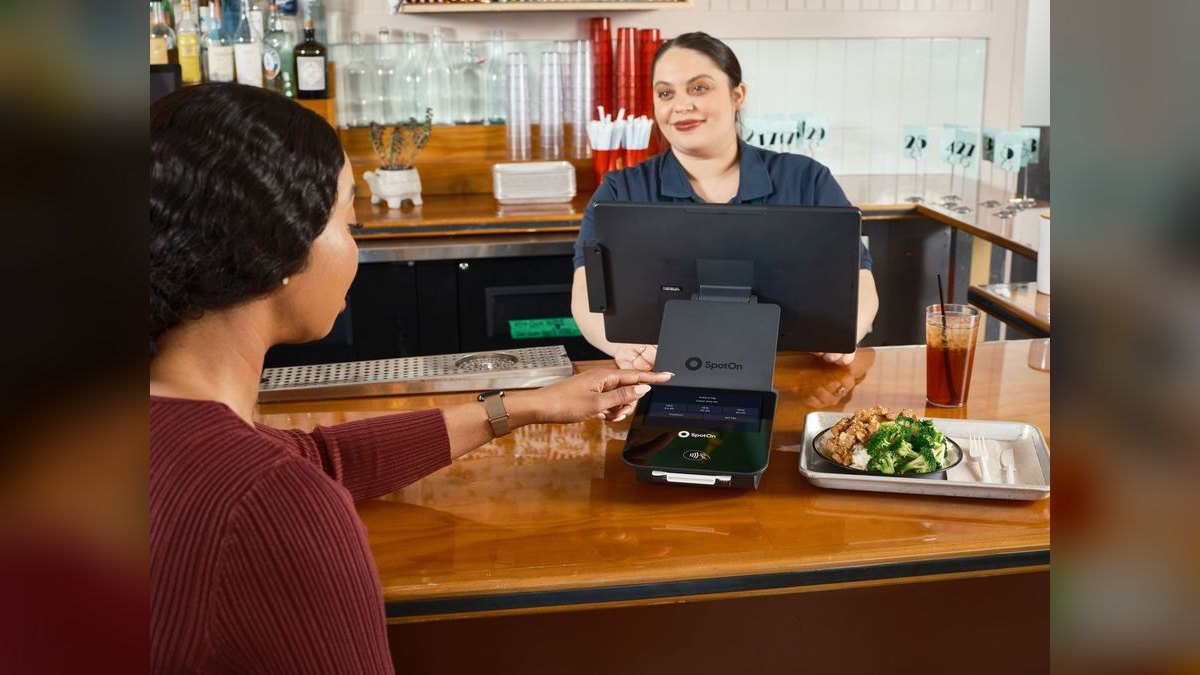
Most winners glide from the first toward the second over time. Toast began deliberately tilting its revenue mix toward 25–40% multi-unit share starting around 2022; Square for Restaurants, historically 90%+ SMB, is running the same rotation now. The practical trigger: if blended CAC Payback is stretching past 24 months on an SMB-only book, that is the signal to fund a multi-unit pipeline before the closure-churn math compounds against you. The decision tree below shows how a single inbound lead routes into the right economics and the right attach sprint.
The routing logic matters because the two motions demand opposite sales behaviors. SMB velocity rewards short cycles, self-serve onboarding, and reps paid on logos and processing residuals; multi-unit retention rewards long displacement cycles, dedicated implementation pods, and reps paid on multi-year ARR plus attach depth. Trying to run both through one comp plan produces reps who cherry-pick easy SMB logos while the enterprise pipeline starves — the single most common go-to-market failure in this category.
The concrete numbers behind each KPI
Each sales metric only earns its place when you know the benchmark band and the failure threshold sitting underneath it. Vague "good/bad" language is useless here — the value is in the specific ranges a practitioner can hold a dashboard against.
Locations Live. The headline count, but only useful split by segment (single-unit SMB, 2–9 unit emerging, 10–99 unit mid-market, 100+ enterprise) and by sub-vertical (full-service, fast-casual, QSR, bar/nightclub, ghost kitchen, food truck). Toast reports roughly 120K+ restaurant locations live; Clover has 700K+ terminals deployed globally across restaurant and retail; Lightspeed Hospitality runs about 165K mid-market locations. Square for Restaurants deliberately blurs a clean count because its free-tier acquisition lever inflates the top of the funnel with locations that may never activate payments.

ARR per Location. Track it by tier and module mix, never blended alone. Toast crossed roughly $14,400 ARR per location in Q3 2025 with payments inside the number. Square for Restaurants Pro sits around $10,000–$12,000; Clover restaurant mid-market runs $9,000–$15,000; enterprise cloud stacks with KDS, loyalty, online ordering, and labor scheduling reach $15,000–$25,000. Below $8,000 ARR per location on an SMB book usually means payments penetration is under 70% and the cross-sell motion is broken.
Payment Processing Take Rate. All-in basis points kept after interchange and assessments. Best-in-class is 70–110 bps net take on a 2.5–3.5% gross rate. Toast runs roughly 50–70 bps net with proprietary processing; Shift4 built its SkyTab POS giveaway entirely around landing the rail first. Anything under 40 bps net means the partner contract is leaking value to the acquirer, and no amount of Locations Live growth fixes a structurally thin take rate.
GPV per Location. Annualized card volume per restaurant — the number that converts ARR into payments revenue. SMB full-service averages $800K–$2M; fast-casual $1–3M; QSR multi-unit $1.5–4M per store. Clover processes $250B+ in annual GPV across all verticals. If GPV per location is flat year over year while same-store sales are up 4–6%, the platform is losing wallet share to off-platform orders flowing through Olo, DoorDash, Uber Eats, and Grubhub — a silent leak that no subscription metric would ever surface.
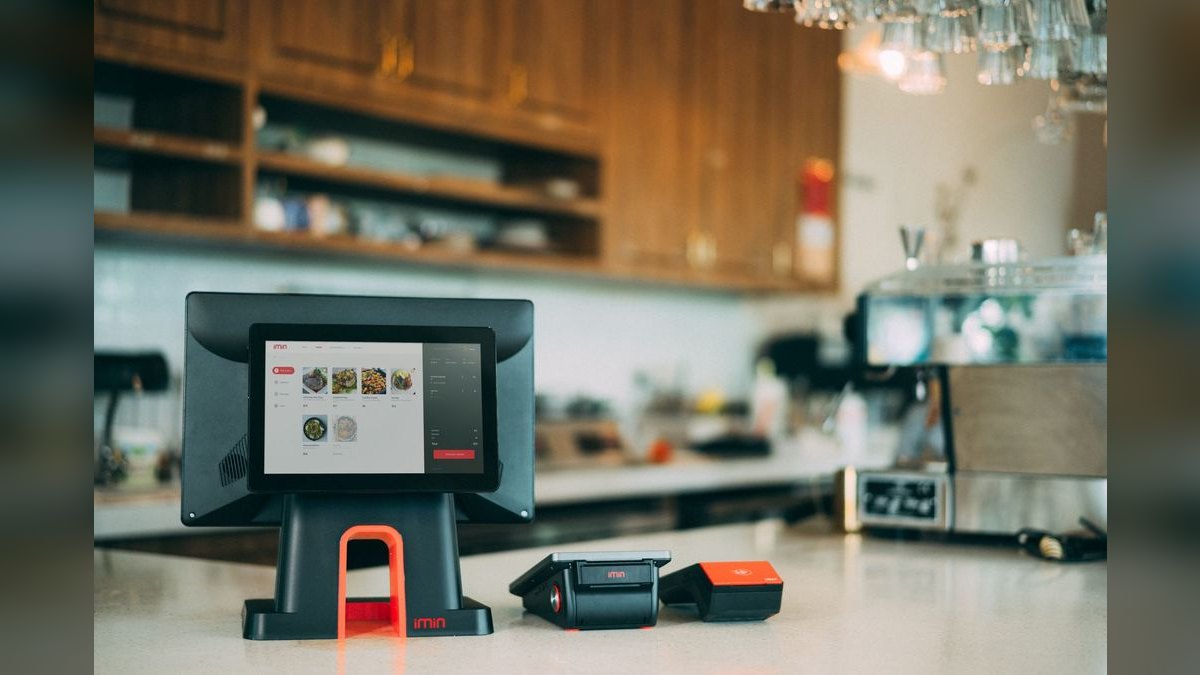
Net Revenue Retention. Trailing-12 revenue from a cohort divided by starting revenue, including expansion, contraction, and churn. Best-in-class is 115–125% (Toast around 115%, Square for Restaurants around 110%); healthy mid-market is 105–115%; below 100% means the existing book is shrinking faster than cross-sell can refill it. Every rung of the upgrade path — payments penetration, then online ordering, KDS, loyalty, labor scheduling, inventory, accounting integration — lifts NRR by 3–8 points.
Module Attach Rate. Share of locations using each non-core module. Benchmarks: online ordering 70–90% on the leaders and 35–55% elsewhere; KDS 65–85%; tip pooling 65–85%; gift cards 55–75%; loyalty 35–65%; labor/scheduling 35–55%; inventory 25–45%; accounting integration to QuickBooks or Restaurant365 65–85%. The operating law: a location with two or fewer modules churns two to three times the rate of one with four or more.
SMB vs. Multi-Unit Mix. Share of revenue from single-unit SMB versus 10+ unit accounts. Oracle MICROS Simphony and Brink POS run 70%+ enterprise; Square for Restaurants is 90%+ SMB. Because SMB churns at 18–32% and multi-unit at 2–6%, a 5-point mix shift toward multi-unit changes blended retention by 3–4 points and CAC Payback by 4–6 months — a lever that moves several KPIs at once.
Annual Logo Churn. Locations lost as a percentage of starting locations, trailing 12 months, split into "restaurant closed" versus "switched to competitor." SMB lives at 18–32% gross churn, of which 60–75% is closure, not a competitive loss. Mid-market is 5–12%; enterprise 2–6%. Reporting closure churn separately from competitive churn is the single most useful disclosure a board review can get, because it separates a market fact from a product failure you can actually fix.
CAC Payback (Months). Fully-loaded acquisition cost divided by gross-margin contribution per location per month. SaaS-only restaurant POS lands at 12–24 months; payments-first models with free hardware hit 6–12 months because reps earn on processing residuals. Below 12 months often means you are underinvesting in sales capacity; above 24 means the comp plan or the ICP is broken and needs restructuring before you scale spend.
Implementation, sequencing, and reporting cadence
Instrumenting these KPIs is a 90-day build, and the sequencing matters because each stage exposes a data-quality gap the next stage depends on. Skip a stage and you build later dashboards on numbers that silently disagree with each other.
Days 1–30 — instrument and reconcile. Wire all nine KPIs end to end. The first finding is almost always that location counts do not match across billing, the core POS platform, and the payments processor — reconcile them before trusting any per-location metric. Establish ARR per location, GPV per location, and take-rate baselines by segment, then pull the trailing-24-month churn report and split closure versus competitive manually if the Systems do not separate them natively. Everything downstream inherits the errors you fail to catch here.
Days 31–60 — ship the attach dashboard. Wire module activation to onboarding milestones on one side and billing on the other, so every attach lands inside 90 days of go-live. Assign customer-success sprints to bottom-quartile cohorts, confirm payments penetration is above 90% on locations older than 60 days, and run a contract-amendment wave where it is not. Validate that integrations with Olo, Restaurant365, QuickBooks, and loyalty platforms fire reliably, since a broken integration reads as low attach when the real problem is plumbing.
Days 61–90 — build the multi-unit pipeline. Identify the top 200 multi-unit prospects by location count and incumbent vendor, then build a displacement model against legacy on-prem stacks approaching their 5–8 year hardware refresh window. Present the segment-level operating model — CAC Payback, NRR, and a multi-unit mix glidepath — to the CFO, and lock the comp plan to reward multi-unit ARR and module attach rather than raw logo count. This is where the sales organization's incentives finally align with the economics the metrics describe.
Once instrumented, the reporting cadence keeps the sales organization honest at four tempos, each feeding the next.
Daily surfaces go-lives, payments-active locations, GPV processed, and severity-2 tickets. Weekly tracks attach progress on the 0–90 day cohort, pipeline by segment, and 30-day payments penetration. Monthly reports ARR per location, NRR by cohort, churn split by closure versus competitive, and CAC Payback by segment. Quarterly delivers the full segment P&L, hardware-refresh progress, newer-module attach, and a board guidance re-baseline. The four common failure modes — confusing closure with software churn, under-attaching modules in the first 90 days, letting payments penetration stall below 80%, and ignoring multi-unit until the math forces it — are all caught by this cadence when the churn line is split and the attach sprint is owned by onboarding rather than sales.
Related questions
Which single KPI predicts survival best for an SMB-heavy POS book?
Module Attach Rate. Because closure drives most SMB churn, the one lever the vendor actually controls is stickiness, and a location running four-plus modules churns two to three times slower than one on payments alone. Attach depth inside 90 days is the leading indicator of NRR.
Why fold payments revenue into ARR per Location instead of reporting it separately?
Because payments is roughly 80% of the economics and inseparable from the software relationship in practice. A blended figure — like Toast's ~$14,400 — reflects the true value of a location and prevents boards from over-weighting a $1,000 software subscription while ignoring $40,000 of processing revenue.
How is restaurant POS churn different from normal SaaS churn?
Most of it is not a lost sale — it is a closed business. In a Restaurant industry with a ~40% five-year survival rate, 60–75% of SMB logo churn is closure. That is why the fix is acquisition velocity and multi-unit mix, not classic retention spend.
What CAC Payback should a payments-first POS target?
Six to twelve months. Free or subsidized hardware plus processing residuals compress payback well below the 12–24 month range of SaaS-only models. Anything above 24 months signals a broken comp plan or a mismatched ICP rather than a market problem you can spend your way out of.
FAQ
What does "Locations Live" actually count, and why lead with it? It counts restaurant sites actively transacting on your POS. It leads because it directly measures the recurring-revenue base and, combined with GPV per location, the payments base too. It is only meaningful split by segment and sub-vertical, since a food truck and a 50-unit chain contribute wildly different economics.
How is ARR per Location calculated in the payments era? Total recurring revenue — software subscriptions plus net payments revenue — divided by live locations. Blended, mature operators land near $14,000, but you should always decompose it by tier and module mix. A number below $8,000 on an SMB book usually flags payments penetration under 70% and a stalled cross-sell motion.
What is a healthy Payment Processing Take Rate? Net, best-in-class is 70–110 basis points kept after interchange and assessments, on a gross card rate of 2.5–3.5%. Proprietary-processing platforms tend toward 50–70 bps net. Below 40 bps net means the acquirer or referral partner is capturing economics that should belong to the platform.
Why is Annual Logo Churn so high in this industry? Because roughly 60% of new restaurants close within five years, forcing SMB gross churn into the 18–32% band regardless of product quality. The critical disclosure is splitting closure churn from competitive churn — the first is a market fact, the second is a product or service failure you can actually fix.
How does Module Attach Rate move the whole model? Each additional module lifts NRR by 3–8 points and sharply reduces churn. Top performers target three-plus modules attached within the first 90 days. Attach is where a flat SMB subscription turns into a compounding, sticky account — it is the difference between a 90% and a 120% NRR cohort.
What CAC Payback range signals a healthy sales engine? Twelve to eighteen months for a balanced SaaS-plus-payments model, or six to twelve for a payments-first, free-hardware motion. Under twelve can mean you are starving growth; over twenty-four means the comp plan, hardware subsidy, or ICP needs restructuring before you scale spend.
Sources
- https://investors.toasttab.com
- https://investors.block.xyz
- https://investors.fiserv.com
- https://investors.lightspeedhq.com
- https://investors.shift4.com
- https://www.investor.oracle.com
- https://restaurant.org/research-and-media/research/
- https://www.datassential.com
Related on PULSE
- [Top 10 Restaurant Revenue Per Table Turnover Benchmarks](/knowledge/ik0591)
- [Top 10 Restaurant Average Ticket Size and Table Turnover Metrics](/knowledge/ik0535)
- [Top 10 Restaurant Same-Store Sales Growth and Revenue Metrics](/knowledge/ik0506)
- [What are the key sales KPIs for the Quick Service Restaurant (QSR) Franchise Operations industry in 2027?](/knowledge/ik0311)
- [What are the key sales KPIs for the Commercial Restaurant Equipment Distribution industry in 2027?](/knowledge/ik0022)
This page will be disappearing soon. Save it to your device for $1 — or read it free while it is here.
@Kory-White- · if Venmo asks, the last 4 of my number are 2012
This page is gone.
This one is off the shelf now. $1 keeps it on your phone for good — the whole page, pictures and diagrams included.
 pulse-industry-kpisTop 10 Sales KPIs for Industrial Powder Coating Job Shops in 2027
 pulse-industry-kpisTop 10 Sales KPIs for Specialty Marine Engine & Propulsion Distribution in 2027
 pulse-industry-kpisTop 10 Sales KPIs for Luxury Fashion House in 2027
 pulse-industry-kpisTop 10 Sales KPIs for LLM API Provider in 2027
 pulse-industry-kpisTop 10 Sales KPIs for Buy-Now-Pay-Later (BNPL) in 2027
 pulse-industry-kpisTop 10 Sales KPIs for Pet Insurance in 2027
 pulse-industry-kpisTop 10 Sales KPIs for Wine and Spirits Distribution in 2027
 pulse-industry-kpisTop 10 Sales KPIs for Medical Device OEM in 2027
 pulse-industry-kpisTop 10 Sales KPIs for Specialty Animal Feed & Nutrition Distribution in 2027
 pulse-industry-kpisTop 10 Sales KPIs for EDA (Electronic Design Automation) Software in 2027