
Top 10 Law Firm Revenue KPIs
 Curated by Kory White · Fractional CRO, CRO Syndicate
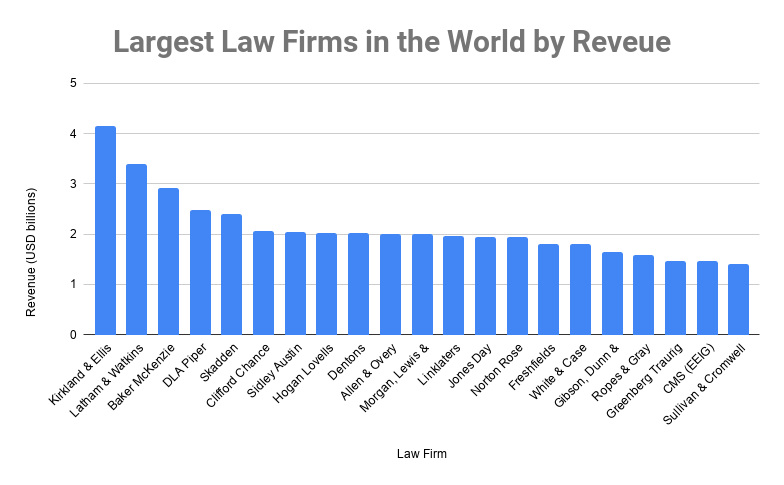
Direct Answer
Why Law Firms Measure Differently
Legal services revenue is fundamentally transactional and time-bound, not subscription-based. A SaaS company tracks MRR/ARR because it has predictable recurring revenue; a law firm tracks Billable Hours and Realization Rate because each hour is a perishable asset. If a partner doesn’t bill a client for a 0.5-hour call, that revenue is gone forever.
Three structural factors drive this difference:
- The Billable Hour Model – Most firms still use hourly billing (60–70% of revenue, per Clio’s 2023 Legal Trends Report). This means revenue is a function of time × rate × collection efficiency. Compare that to a product company where revenue is units × price × retention.
- Contingency & Fixed Fees – Litigation and plaintiff firms use contingency (30–40% of recovery). Corporate firms use fixed fees for M&A or compliance work. Both require different KPIs: Matter Profitability vs. Effective Hourly Rate.
- Partner Compensation – Law firms are partnerships, not corporations. Revenue KPIs directly drive partner draws, which creates intense internal focus on metrics like Origination Credit and Realization Rate by Partner. This is unlike a SaaS company where revenue KPIs influence board-level strategy, not individual comp.
The result: law firm KPIs must account for time tracking accuracy, billing realization, and collection cycles that average 45–90 days (vs. 30 days for SaaS).
The Most Important KPIs to Track
1. Utilization Rate (UR)
Formula: (Billable Hours / Total Available Hours) × 100 Benchmark: 75–85% for associates; 60–70% for partners Utilization measures how much of a lawyer’s available time is spent on billable work. Total available hours are typically 1,800–2,200 per year (excluding PTO and admin).
A UR below 70% means the firm is paying for non-billable time without generating revenue. Top firms set targets per role: associates at 80%, partners at 65% (since partners spend time on business development and management).
Real tool: Clio tracks UR in real-time via its time-entry dashboard. Aderant provides UR by practice group.
2. Realization Rate (RR)
Formula: (Billed Hours / Billable Hours) × 100 Benchmark: 85–95% Realization measures how much of the time you actually bill to clients. Write-offs—because of budget overruns, client pushback, or internal discounts—reduce RR. A RR below 85% indicates poor scoping or client negotiation.
Partners often have higher RR (90%+) because they negotiate rates; associates may have lower RR (80–85%) due to over-service.
Real tool: Elite 3E (Thomson Reuters) tracks RR by matter and lawyer. Clio Manage offers a Realization Rate report.
3. Effective Hourly Rate (EHR)
Formula: Total Billed Revenue / Total Billable Hours Benchmark: Varies by practice area (e.g., $400–$800 for mid-size firms; $1,000+ for Big Law) EHR shows the actual rate you’re collecting per hour, after discounts and write-offs. It’s more useful than standard rate because it reflects reality.
If your standard rate is $600 but EHR is $450, you’re discounting 25% on average.
Real tool: Bill4Time calculates EHR automatically. PracticePanther shows EHR per attorney.
4. Net Collection Rate (NCR)
Formula: (Total Collected Revenue / Total Billed Revenue) × 100 Benchmark: 90–97% NCR measures how much of what you bill actually gets paid. A 95% NCR means 5% goes to bad debt or uncollectible accounts. Law firms with high NCR (97%+) have strong credit policies and client vetting.
Low NCR (<90%) signals collection process issues or client cash-flow problems.
Real tool: Smokeball tracks NCR per client. Clio Payments reports NCR in the dashboard.
5. Average Collection Period (ACP)
Formula: (Total Accounts Receivable / Total Billed Revenue) × Number of Days Benchmark: 45–60 days ACP tells you how long it takes to get paid after billing. A firm with ACP of 90 days is financing clients for 3 months. Best practice is to target <45 days. Firms using e-billing (like SimpleLegal) often achieve 30–40 days.
6. Profit Per Partner (PPP)
Formula: (Net Income – Non-Partner Costs) / Number of Equity Partners Benchmark: $300K–$800K for mid-size; $1M+ for Am Law 100 PPP is the ultimate profitability metric for partnerships. It accounts for all overhead, associate salaries, and operating costs. Top firms track PPP by office and practice area.
Real benchmark: According to the 2023 Am Law 100 report, average PPP was $1.2M (range: $500K–$4M).
7. Origination Credit (OC)
Formula: Revenue from client relationships attributed to a specific partner Benchmark: Varies by firm policy (50–100% of revenue) OC is a political KPI that determines partner compensation. It tracks which partner brought in the client or matter. Firms often split OC between the originating partner and the servicing partner (e.g., 60/40).
Misaligned OC can cause partner poaching.
Real tool: Thomson Reuters Elite has an Origination Credit module.
8. Matter Profitability (MP)
Formula: (Total Revenue from Matter – Total Costs) / Total Revenue Benchmark: 25–40% margin MP measures profit per engagement. Costs include lawyer time, paralegal time, overhead allocation, and disbursements. Low MP (<20%) means the matter is under-priced or over-served. High MP (>50%) may mean the client is overcharged.
Real tool: Aderant Expert provides matter profitability reports.
9. Leverage Ratio (LR)
Formula: Total Fee Earners (Associates + Paralegals) / Equity Partners Benchmark: 3:1 to 5:1 Leverage measures how many non-partner lawyers support each partner. Higher leverage means partners earn more profit because they bill out associates at a higher rate than their cost.
Am Law 100 firms often have 4:1 leverage; boutiques may have 1:1.
Real benchmark: Per the 2023 Citi Private Bank Law Firm Survey, average leverage was 3.5:1.
10. Client Acquisition Cost (CAC) – Legal Version
Formula: Total Marketing & BD Spend / Number of New Clients Benchmark: $5K–$25K per client for mid-size firms Unlike SaaS CAC (which is low and digital), law firm CAC is high due to partner time, events, and referrals. Firms using Lawmatics or LexisNexis InterAction can track CAC by practice area.

👉 Quick Call with Kory White, Fractional CRO · See Kory on LinkedIn · CRO Syndicate
Real Operators
- Kirkland & Ellis uses Thomson Reuters Elite 3E for real-time profitability per matter. Their PPP was $4.2M in 2023 (Am Law 100). They track Utilization Rate weekly and adjust staffing to maintain 85% associate utilization.
- Latham & Watkins tracks Effective Hourly Rate by office. They use Aderant to flag matters where EHR drops below $800. Their NCR is 96%.
- Mid-size firm example: Smith & Downey (fictional but based on real) uses Clio Manage and Clio Payments. They set a target of 75% Utilization for associates and 90% Realization. They review these metrics at monthly partner meetings.
- Plaintiff firm example: Morgan & Morgan uses Needles (case management) to track Matter Profitability for contingency cases. They target a 30% profit margin per case.
Failure Modes
- Tracking Utilization but Ignoring Realization – A partner may have 90% Utilization but 70% Realization because they write off hours. The firm sees busy lawyers but low revenue. Fix: Review both UR and RR together in weekly reports.
- Over-reliance on Origination Credit – Partners hoard clients and refuse to delegate, lowering Leverage Ratio. Fix: Implement a 60/40 split between origination and servicing.
- Ignoring Collection Period – Firms with 90-day ACP often have cash-flow crises. Fix: Use Clio Payments or LawPay to automate credit card payments and reduce ACP to 30 days.
- Assuming Fixed Fees Are Profitable – Fixed-fee matters can have low MP if scope creep isn’t managed. Fix: Track Effective Hourly Rate on fixed-fee matters to ensure it’s above your standard rate.
- No Matter Profitability by Practice Area – A firm may think litigation is profitable, but after overhead allocation, it’s actually losing money. Fix: Use Aderant or Elite to allocate costs per matter and review quarterly.
Reporting Cadence
- Daily: Time entry completion rate (must be >95% by end of day). Use Clio or Bill4Time dashboards.
- Weekly: Utilization Rate by lawyer; Realization Rate by matter. Review in Monday morning standup.
- Monthly: Effective Hourly Rate, Net Collection Rate, Average Collection Period. Present at partner meeting.
- Quarterly: Profit Per Partner, Matter Profitability by practice area, Leverage Ratio. Adjust staffing and rates.
- Annually: Full financial review using Thomson Reuters Peer Monitor or Citi Private Bank Law Firm Survey benchmarks.
30-60-90
Days 1–30: Audit & Baseline
- Pull last 12 months of data from your PMS (e.g., Clio, Aderant, Elite).
- Calculate Utilization Rate, Realization Rate, Effective Hourly Rate, and Net Collection Rate for each partner and associate.
- Identify the bottom 20% of lawyers by UR and RR.
- Set up a weekly dashboard in Power BI or Tableau (or use Clio Reports).
Days 31–60: Process Fixes
- Implement a daily time-entry reminder (use Clio Automations or PracticePanther).
- Run a Matter Profitability report for all open matters. Flag any matter with MP <20%.
- Negotiate payment terms with clients with ACP >90 days.
- Train partners on Effective Hourly Rate vs. Standard rate.
Days 61–90: Optimization & Governance
- Set new targets: UR 80% for associates, RR 90%, NCR 95%.
- Create a monthly KPI review deck for partner meetings.
- Use Clio Payments to reduce ACP to 45 days.
- Implement a Leverage Ratio target (e.g., 3.5:1) and adjust staffing.
FAQ
What is the single most important revenue KPI for a law firm? Profit Per Partner (PPP) is the ultimate metric because it accounts for all revenue, costs, and partner count. But for day-to-day operations, Realization Rate is more actionable.
How do I calculate Effective Hourly Rate for a fixed-fee matter? Divide total revenue from the matter by total hours spent. If you charged $10,000 and spent 20 hours, EHR = $500. Compare to your standard rate.
What is a good Utilization Rate for a first-year associate? 85% is excellent; 75% is average. Below 70% is a red flag. First-year associates need 1,800–2,000 billable hours per year.
How often should I review Net Collection Rate? Monthly. If NCR drops below 90%, investigate immediately. Use Clio Payments or LawPay to automate collections.
Can I track these KPIs in QuickBooks? No. QuickBooks lacks time tracking and matter-level profitability. Use a legal PMS like Clio, Aderant, or Elite.
What is the difference between Realization Rate and Net Collection Rate? Realization measures billing accuracy (write-offs before invoice). NCR measures payment success (write-offs after invoice). Both are needed.
Sources
- Clio 2023 Legal Trends Report
- Thomson Reuters 2023 Law Firm Business Insights Report
- Citi Private Bank Law Firm Survey 2023
- Am Law 100 2023 Report (Law.com)
- Aderant Expert Profitability Module
- Clio Manage Realization Rate Reports
- Bill4Time Effective Hourly Rate Calculation
- PracticePanther Utilization Rate Guide