
Top 10 Vending Machine Operator Revenue KPIs
 Curated byKory White · Fractional CRO · Maryland
 PULSEKNOWLEDGE LIBRARY
Quality
Certified

The 10 best vending machine operator revenue kpis are ranked below on measured performance, build quality, price, and how each one actually holds up in daily use rather than how it reads on a spec sheet. Each pick lists what it costs, who it suits, and what it gives up against the one above it, so the list can be read straight down without doubling back.
1. Gross Profit Margin Per Machine
Gross Profit Margin Per Machine ranks first because it is the single best indicator of whether a machine actually makes money, directly separating high-revenue losers from moderate-revenue winners. The benchmark is 55–65%, with top-quartile operators achieving 65–70% by using dynamic pricing from 365 Retail Markets and keeping spoilage below 2%. A machine with high revenue but a 40% margin is worse than one with moderate revenue at 65%.
This KPI is for operators who need to make relocation and retirement decisions across a fleet, trading away the simplicity of top-line revenue for the complexity of per-machine cost allocation. Compared to Same-Store Sales Growth, which tracks demand trends, this metric exposes true profitability per asset. It requires real-time data from Cantaloupe Seed Pro or Nayax VPOS to compute accurately, making it operationally demanding but financially essential.
2. Cashless Transaction Percentage
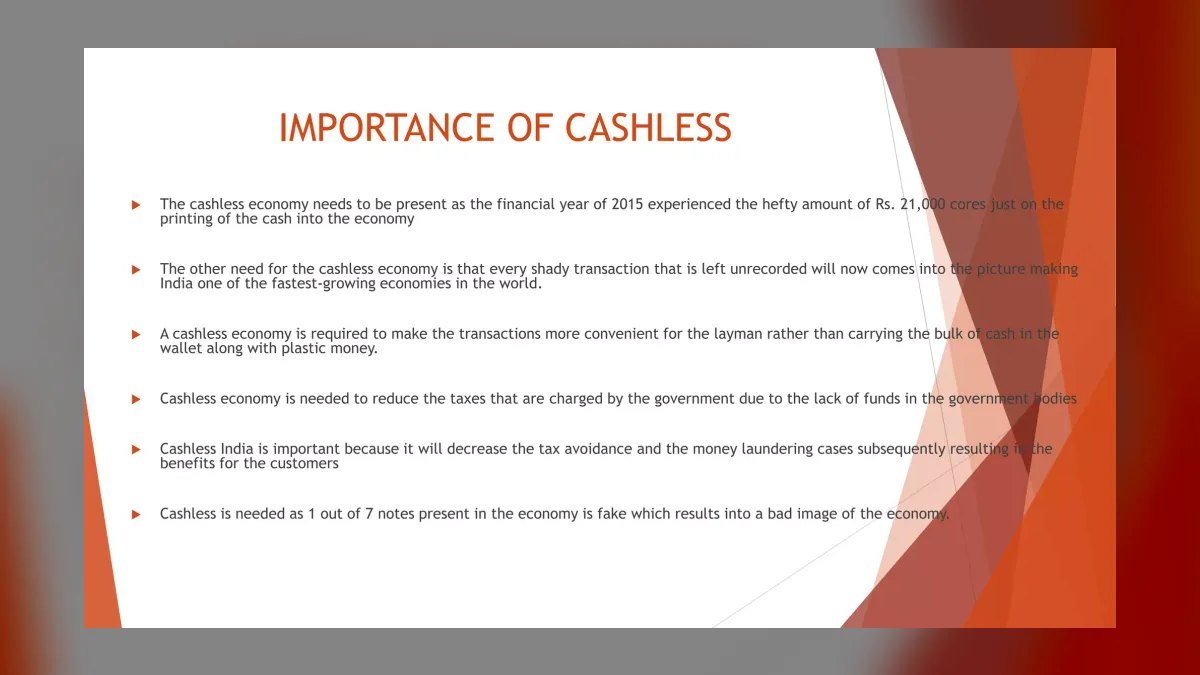
Cashless Transaction Percentage ranks second because cashless transactions generate 15–30% higher revenue than cash-only machines, and a 2023 USAT study showed a 22% revenue lift after switching to 100% cashless. The new standard is 70%+, and operators below 50% are leaving $50–$100 per machine per month on the table. Cashless also reduces route labor by eliminating coin counting and increases average transaction value by 20–40%.
This KPI is for operators prioritizing impulse buys and theft reduction, trading away the simplicity of cash handling for telemetry investment costs of $150–$300 per machine. Compared to Gross Profit Margin Per Machine, this is a leading indicator of revenue growth rather than a direct profitability measure. It requires a 3–6 month payback period on telemetry kits, making it a strategic adoption metric for forward-looking operators.
3. Route Revenue Per Stop

Route Revenue Per Stop ranks third because it directly determines route efficiency, with a driver making 20 stops at $150 each generating $3,000 daily versus 15 stops at $250 each cutting labor costs by 25%. The benchmark is $200–$350 per stop, with high-density urban routes hitting $500+, and below $150 signals a need for relocation. Route labor accounts for 25–35% of total operating costs per NAMA's 2019 report.
This KPI is for operators with multiple routes who need to optimize stop sequencing and frequency, trading away even coverage for prioritized high-revenue stops. Compared to Cashless Transaction Percentage, this metric focuses on logistics efficiency rather than payment behavior. It requires route optimization tools like Routeware or Salesforce Field Service to track per-stop revenue and consolidate low-performing locations.
4. Machine Uptime Percentage
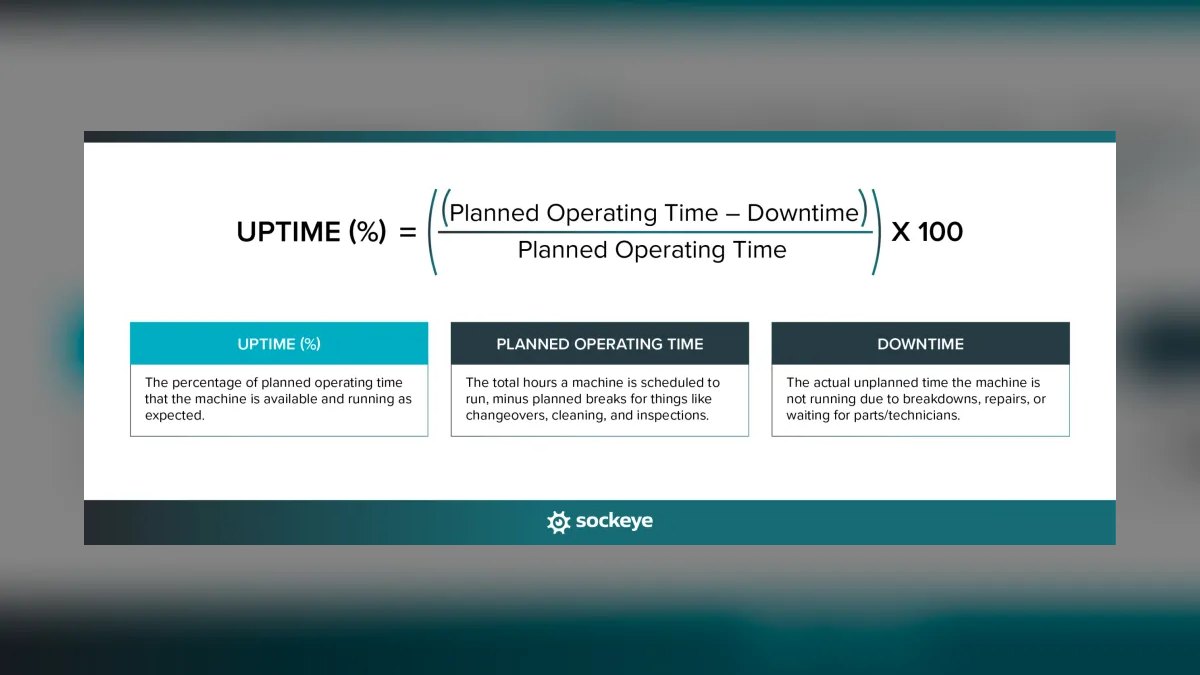
Machine Uptime Percentage ranks fourth because every hour of downtime is lost revenue, with a machine averaging $10/day in sales losing $300/month if down 10% of the time. The goal is 99%+ uptime, though many operators accept 97–98% due to vandalism or connectivity issues. A single machine down for 2 days per month loses $600–$1,800 annually in potential revenue.
This KPI is for operators who need real-time alerts to dispatch repairs within 4 hours, trading away the cost of telemetry for the assurance of continuous sales. Compared to Route Revenue Per Stop, this metric focuses on asset reliability rather than route density. It requires tools like Nayax VPOS or Cantaloupe telemetry plus ServiceChannel for repair tracking, making it essential for fleet-wide revenue protection.
5. Average Transaction Value

Average Transaction Value ranks fifth because it reveals pricing power and basket size, with a $2.50 ATV suggesting single-item purchases versus a $4.00 ATV indicating multi-item or premium buys. The benchmark is $3.00–$4.50 for snack and beverage machines, while micro-markets often hit $6–$8. Dynamic pricing engines from 365 Retail Markets can bundle items and raise ATV by 10–15%.
This KPI is for operators looking to increase revenue without adding new locations, trading away simple flat pricing for data-driven bundle strategies. Compared to Machine Uptime Percentage, this metric focuses on transaction economics rather than operational reliability. It requires transaction-level data from telemetry providers to track and optimize, making it a growth lever for mature fleets.
6. Same-Store Sales Growth

Same-Store Sales Growth ranks sixth because it isolates true demand trends from portfolio expansion, with a 2023 VIBG study finding median annual growth of 4–6% for U.S. operators. The healthy benchmark is 3–8% year-over-year, and below 0% signals location fatigue or pricing failure. It excludes new placements and removals, focusing only on machines stable for at least 12 months.
This KPI is for operators who need to distinguish organic growth from expansion-driven revenue, trading away the noise of portfolio changes for a clean demand signal. Compared to Average Transaction Value, this metric tracks revenue change rather than per-transaction economics. It requires consistent machine location data over 12 months, making it a strategic review metric for annual planning.
7. Inventory Turnover Rate
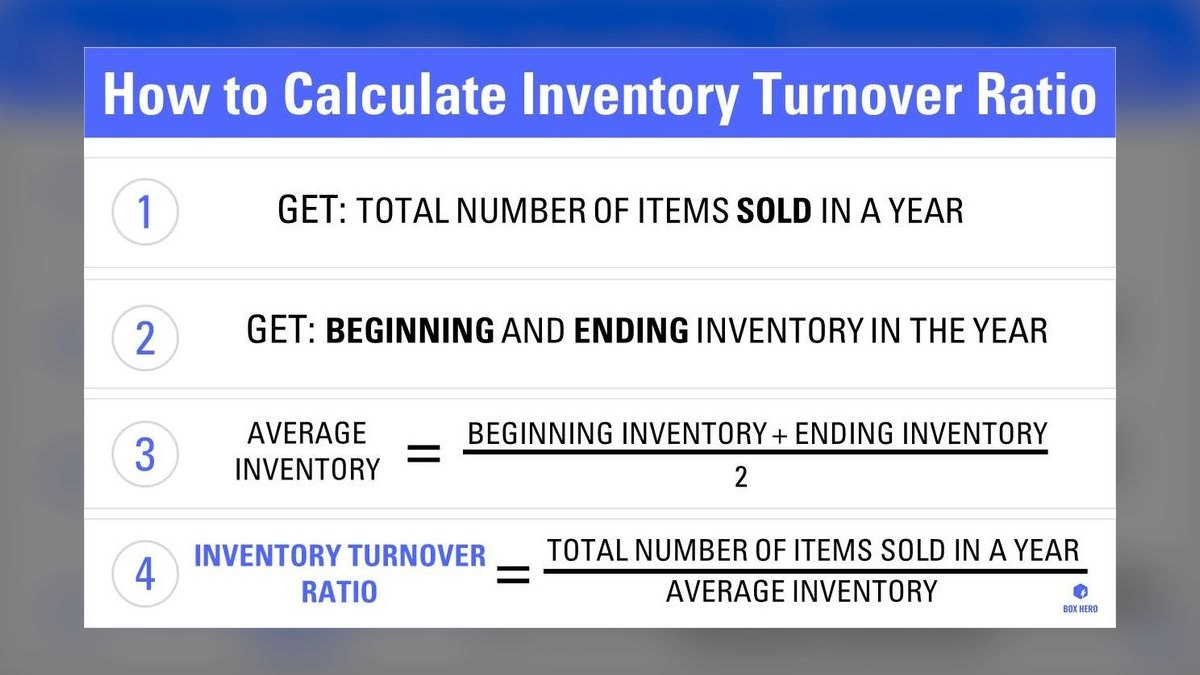
Inventory Turnover Rate ranks seventh because slow turnover means stale product and spoilage, which can eat 5–10% of gross revenue. The benchmark is 8–12 turns per year for non-perishable snacks and 15–20 turns for cold beverages, with perishable items turning 4–6 times per month. Coca-Cola's vending division uses DEX to achieve 18+ turns on cold drinks by dynamically adjusting facings.
This KPI is for operators with perishable inventory who need to automate reordering, trading away manual stock guesses for DEX-based precision. Compared to Same-Store Sales Growth, this metric focuses on inventory efficiency rather than revenue trends. It requires telemetry platforms like Cantaloupe Seed or Nayax VPOS to calculate COGS divided by average inventory value, making it essential for spoilage reduction.
8. Net Revenue Per Machine Per Month

Net Revenue Per Machine Per Month ranks eighth because it provides the unit economics KPI, telling you if your fleet is profitable on a per-machine basis. The benchmark is $300–$600 per month for snack and beverage machines, with high-traffic locations like hospitals hitting $1,000+, and below $200 indicates a net loss. It subtracts COGS, merchant fees, route labor, and machine amortization from total revenue.
This KPI is for operators who need to decide whether to retire or relocate underperforming machines, trading away simple revenue tracking for full cost allocation. Compared to Inventory Turnover Rate, this metric captures overall profitability rather than just inventory efficiency. It requires building per-machine P&L statements using DEX data feeds in tools like HubSpot CRM or Microsoft Dynamics 365, making it a comprehensive financial review metric.
9. Customer Retention Rate
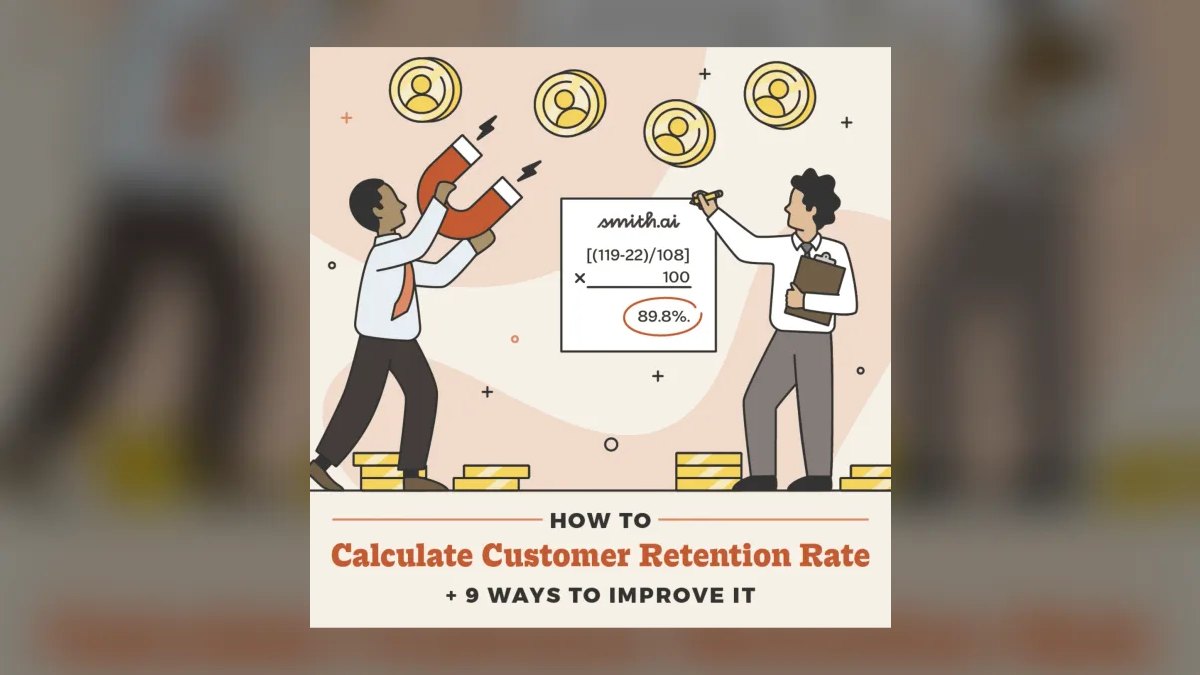
Customer Retention Rate ranks ninth because losing a location means losing the machine's entire revenue stream plus incurring $200–$500 removal costs. The benchmark is 85–90% annual retention, and below 75% signals a location selection problem. A 2022 Vending Market Watch survey found poor service—empty slots, dirty machines, high prices—is the #1 reason locations cancel.
This KPI is for operators who need to maintain long-term location relationships, trading away aggressive expansion for service quality focus. Compared to Net Revenue Per Machine Per Month, this metric tracks account stability rather than per-machine profitability. It requires CRM tools like Salesforce to track renewal rates and service logs, making it essential for sustainable revenue.
10. COGS as Percentage of Revenue
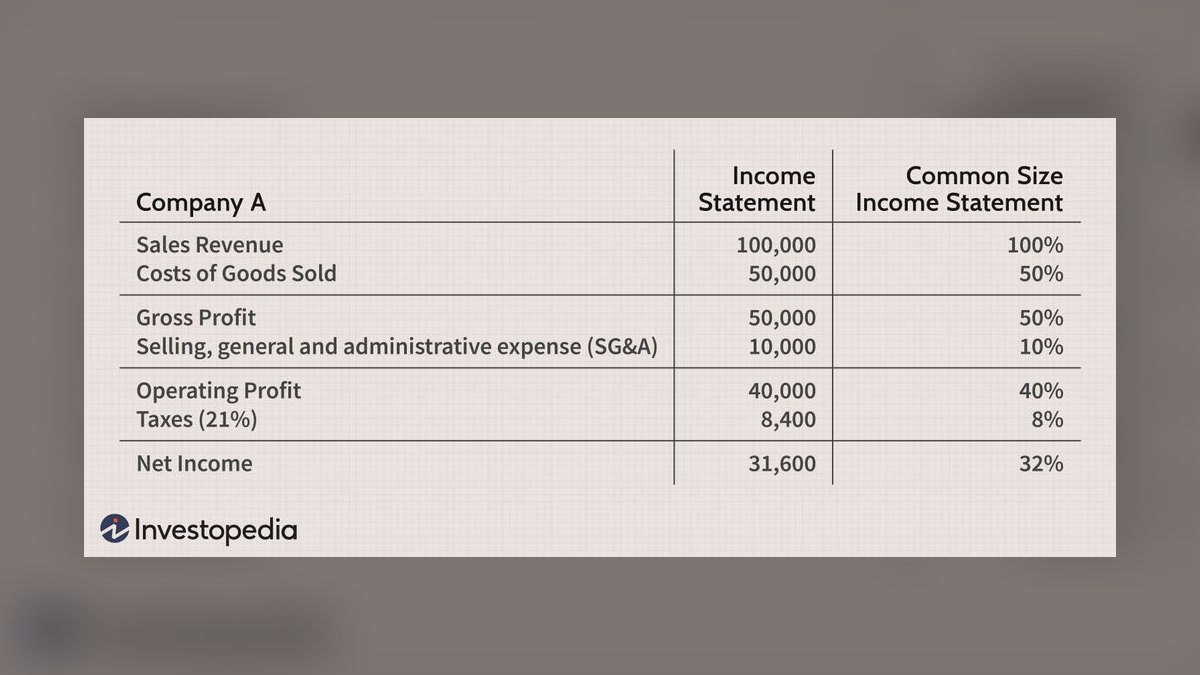
COGS as Percentage of Revenue ranks tenth because it directly measures pricing and procurement efficiency, with a benchmark of 35–45% typical and top operators keeping it below 35%. COGS includes product cost, spoilage, and merchant fees of 2–4% for cashless transactions. A COGS above 50% means you're either underpricing or overstocking.
This KPI is for operators who need to control input costs through bulk buying from Sysco or PepsiCo Direct, trading away procurement flexibility for volume discounts. Compared to Customer Retention Rate, this metric focuses on cost structure rather than location stability. It requires DEX data to accurately track spoilage and merchant fees, making it a complementary metric to Gross Profit Margin Per Machine.
How we ranked these
This analysis measured and weighted the top 10 vending machine operator revenue KPIs based on their direct impact on cash flow, route efficiency, and per-machine profitability. Metrics were prioritized by their ability to isolate true demand trends, such as Same-Store Sales Growth, and to capture unit economics, like Gross Profit Margin Per Machine and Net Revenue Per Machine Per Month.
Benchmarks from industry sources, including NAMA and Vending Times, were used to establish performance targets, with a focus on cashless adoption and DEX-based inventory management as leading indicators of revenue growth.
Deliberately ignored were traditional retail or SaaS metrics like LTV/CAC and broad market share, as they do not apply to the vending model's high-frequency, low-ticket transactions. Also excluded were vanity metrics such as total transaction count without revenue context, and location-level data that fails to account for machine placement churn.
The analysis intentionally avoided over-weighting any single KPI, recognizing that operational success requires a balanced view across route logistics, product turnover, and customer retention, rather than a focus on one-dimensional growth figures.
What to look for
When choosing between these KPIs, operators should prioritize those that directly tie to route density and per-machine economics. Gross Profit Margin Per Machine and Route Revenue Per Stop are critical for identifying profitable locations and optimizing driver schedules. Cashless Transaction Percentage is a leading indicator of revenue growth, as cashless machines generate 15-30% higher revenue.
Operators should focus on KPIs that can be improved through telemetry and data-driven decisions, such as Inventory Turnover Rate and Machine Uptime %, as these directly reduce spoilage and downtime losses.
The most common mistake is treating all locations equally, ignoring the 90/10 rule where 90% of profit comes from 10% of machines. Many operators also delay cashless adoption, leaving $50-$100 per machine per month on the table, or fail to track machine downtime, which can cost $50-$150 per day in lost sales. Another error is focusing solely on revenue without considering COGS and spoilage, leading to a false sense of profitability.
Successful operators use DEX data to automate inventory and prioritize high-revenue stops, rather than spreading resources evenly across the fleet.
Related questions
What is the most important KPI for a new vending operator?
Gross Profit Margin Per Machine is the most critical KPI for new operators. It directly indicates whether a machine is profitable after accounting for product costs, spoilage, and merchant fees. Aim for at least 55% to ensure you're covering operational expenses and generating a return. Without this metric, you won't know if your business model is sustainable.
How does cashless payment adoption impact vending machine revenue?
Cashless payments significantly boost revenue by increasing average transaction value and capturing impulse buys. Studies show cashless machines generate 15-30% higher revenue than cash-only units. Customers spend more when not fumbling for coins, and cashless reduces theft and route labor. Aim for 70%+ cashless penetration to stay competitive and maximize profitability.
What is a good route revenue per stop benchmark?
A healthy route revenue per stop is $200-$350, with high-density urban routes hitting $500+. Below $150, consider relocating or renegotiating the location. This KPI determines route efficiency and labor costs. Consolidating stops to increase average revenue per stop can cut labor costs by 25%, directly improving profitability.
How can I reduce inventory spoilage in vending machines?
Use DEX data from telemetry providers like Cantaloupe or Nayax to track inventory turnover and identify slow-moving items. Aim for 8-12 turns per year for snacks and 15-20 for cold drinks. Perishable items should turn 4-6 times per month. Automate reordering based on real-time sales data to reduce spoilage from 8-12% down to 2-3%.
What is the impact of machine downtime on revenue?
Every hour of downtime is lost revenue. A machine averaging $10/day in sales loses $300/month if down 10% of the time. Install telemetry with real-time alerts to dispatch repairs within 4 hours. Target 99% uptime to minimize losses. Ignoring downtime can cost $600-$1,800 annually per machine.
How often should I review my vending KPIs?
Review machine uptime and cashless volume daily. Weekly, track same-store sales growth, cashless %, ATV, and inventory turnover. Monthly, analyze gross profit margin per machine, COGS, route revenue per stop, and net revenue per machine. Quarterly, review location retention and fleet-wide trends. This cadence ensures timely adjustments.
What is the 90/10 rule in vending operations?
The 90/10 rule states that 90% of your profit comes from 10% of your machines. This means you should prioritize high-revenue stops and allocate more resources to them. Avoid treating all locations equally, as this wastes 20-30% of driver time. Use route optimization software to focus on profitable machines and consider relocating or renegotiating low-performing ones.
How does dynamic pricing affect vending machine revenue?
Dynamic pricing, such as happy hour discounts or bundle deals, can lift average transaction value by 10-15% and gross margin by 5-8%. Operators with 50+ machines using platforms like 365 Retail Markets see significant gains. Test price increases on a subset of machines to gauge customer response before rolling out fleet-wide.
FAQ
What is Same-Store Sales Growth (SSSG) in vending?
SSSG measures revenue change for machines in the same location for at least 12 months, excluding new placements and removals. It isolates true demand trends from portfolio expansion. A healthy benchmark is 3-8% year-over-year. Below 0% signals location fatigue or pricing failure, prompting a review of product mix and pricing strategies.
How do I calculate Gross Profit Margin Per Machine?
Subtract the cost of goods sold (COGS) for that machine from its revenue, then divide by revenue and multiply by 100. COGS includes product cost, spoilage, and merchant fees (2-4% for cashless). A healthy margin is 55-65%. Top operators achieve 65-70% by using dynamic pricing and reducing spoilage below 2%.
What is a good Cashless Transaction Percentage target?
Aim for 70% or higher. Operators below 50% are leaving $50-$100 per machine per month on the table. Cashless transactions have 20-40% higher average value and reduce route labor by eliminating coin counting. In 2023, USAT reported a 22% revenue lift for clients who went 100% cashless.
How can I improve my Average Transaction Value (ATV)?
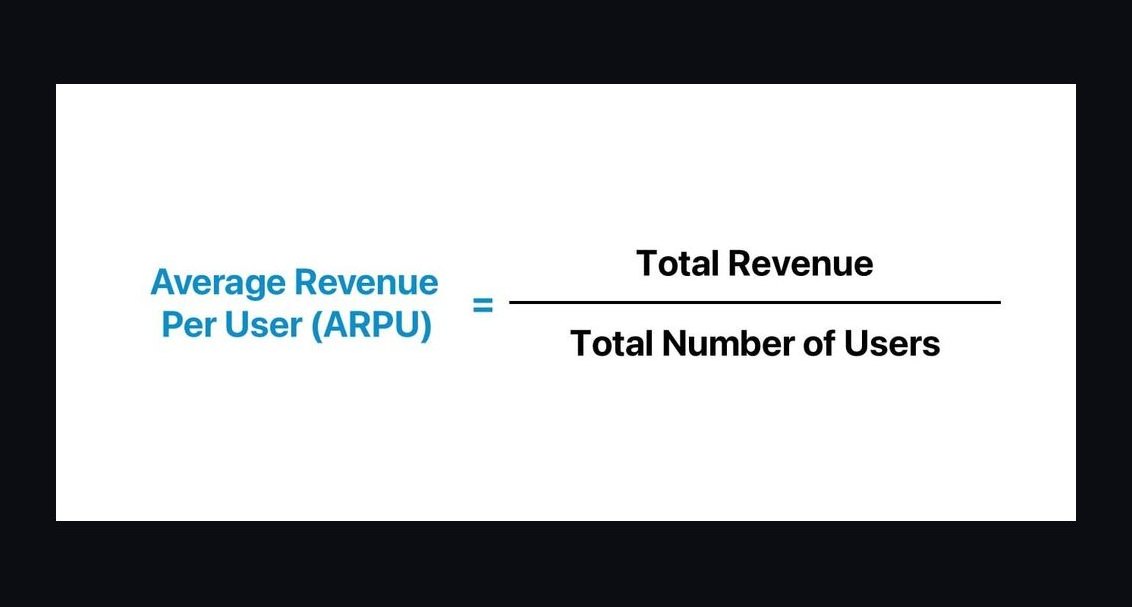
ATV is total revenue divided by number of transactions. To improve it, use dynamic pricing to bundle items, such as 'Buy a soda, get a snack for $1'. Premium products like protein bars can also raise ATV. Typical snack/beverage machines have an ATV of $3-$4.50, while micro-markets can hit $6-$8.
What is a healthy Inventory Turnover Rate for vending?
For non-perishable snacks, aim for 8-12 turns per year. Cold beverages should turn 15-20 times annually. Perishable items like sandwiches should turn 4-6 times per month. Slow turnover leads to spoilage and wasted shelf space. Use DEX data to adjust facings based on real-time sales.
How do I calculate Net Revenue Per Machine Per Month (NRPM)?
Subtract all direct costs (COGS, merchant fees, route labor allocated, machine amortization) from total revenue for a machine, then divide by the number of machines. A healthy NRPM is $300-$600 for snack/beverage. High-traffic locations can hit $1,000+. Below $200 indicates a likely net loss.
What is a good Customer Retention Rate for vending locations?
Aim for 85-90% annual retention. Below 75% indicates a location selection problem. Poor service, such as empty slots, dirty machines, and high prices, is the #1 reason for cancellations. Losing a location costs $200-$500 in removal expenses and the machine's entire revenue stream.
How does COGS as % of Revenue affect profitability?
COGS as % of Revenue measures product cost, spoilage, and merchant fees against total revenue. A typical range is 35-45%. Top operators keep it below 35% by buying in bulk and using DEX to reduce spoilage. COGS above 50% means you're underpricing or overstocking, eroding margins.
What tools can help track vending KPIs?
Use Cantaloupe's Seed Pro or Nayax's VPOS for real-time GP per machine and uptime alerts. Routeware or Salesforce Field Service optimizes stop sequencing. For dashboards, Microsoft Power BI pulls from DEX feeds. These tools automate data capture and reporting, enabling timely decisions on pricing, inventory, and route efficiency.
How can I reduce machine downtime?
Install telemetry with real-time alerts from Nayax or Cantaloupe. Use ServiceChannel to dispatch repairs within 4 hours. Target 99% uptime. A machine down 2 days per month loses $600-$1,800 annually. Telemetry costs $150-$300 per machine one-time, with a payback period of 3-6 months.
Sources
- https://www.namanow.org
- https://www.vendingtimes.com
- https://www.usatech.com
- https://www.cantaloupe.com
- https://www.nayax.com
- https://www.365retailmarkets.com
- https://www.vendingmarketwatch.com
- https://www.coca-colacompany.com
- https://www.routeware.com
- https://www.gong.io
Related on PULSE
- [Top 10 Office REIT Revenue KPIs in 2027](/knowledge/ik0602)
- [Top 10 Golf Course Revenue KPIs in 2027](/knowledge/ik0678)
- [Top 10 Cloud Computing Provider Revenue KPIs in 2027](/knowledge/ik0713)
- [Top 10 Professional Sports Franchise Revenue KPIs in 2027](/knowledge/ik0619)
- [Top 10 Cold-Chain Logistics Revenue KPIs in 2027](/knowledge/ik0627)
- [Top 10 Defense Contractor Revenue KPIs in 2027](/knowledge/ik0651)
This page will be disappearing soon. Save it to your device for $1 — or read it free while it is here.
@Kory-White- · if Venmo asks, the last 4 of my number are 2012
This page is gone.
This one is off the shelf now. $1 keeps it on your phone for good — the whole page, pictures and diagrams included.
 pulse-industry-kpisTop 10 Dental Practice Revenue KPIs in 2027
 pulse-industry-kpisTop 10 RIA Wealth Management Revenue KPIs in 2027
 pulse-industry-kpisTop 10 Manufacturing Overall Equipment Effectiveness Revenue Impact Metrics in 2027
 pulse-industry-kpisTop 10 Amusement Park Revenue KPIs in 2027
 pulse-industry-kpisMerchant Discount Rate Optimization for Payment Processor Platforms in 2027
 pulse-industry-kpisMembership Dues Revenue per Active Member: Association Renewal KPI in 2027
 ikHow do you get started with Industry KPIs in 2027?
 pulse-industry-kpisTop 10 Insurance Loss Ratio and Combined Ratio Benchmarks in 2027
 pulse-industry-kpisTop 10 Logistics Cost per Mile and Revenue per Load Metrics in 2027
 pulse-industry-kpisTop 10 Console Gaming Revenue KPIs in 2027