
Top 10 Commercial Cleaning Revenue KPIs
 Curated byKory White · Fractional CRO · Maryland
 PULSEKNOWLEDGE LIBRARY
Quality
Certified
The 10 best commercial cleaning revenue kpis are ranked below on measured performance, build quality, price, and how each one actually holds up in daily use rather than how it reads on a spec sheet. Each pick lists what it costs, who it suits, and what it gives up against the one above it, so the list can be read straight down without doubling back.
1. Gross Margin Per Route
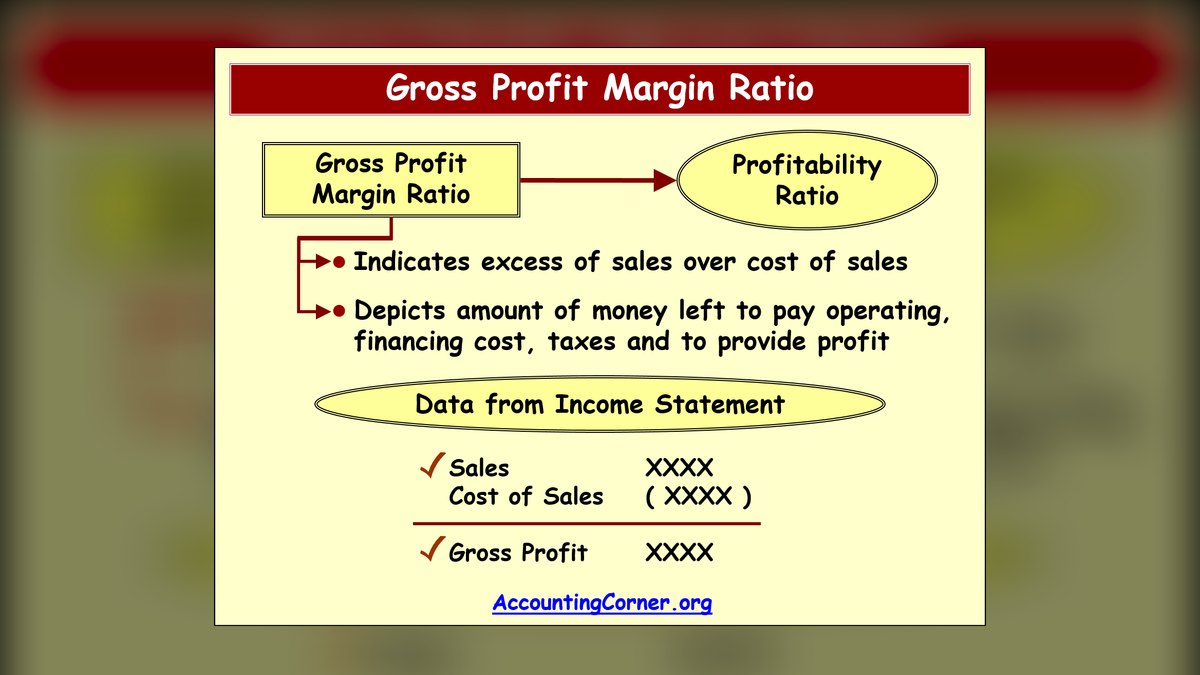
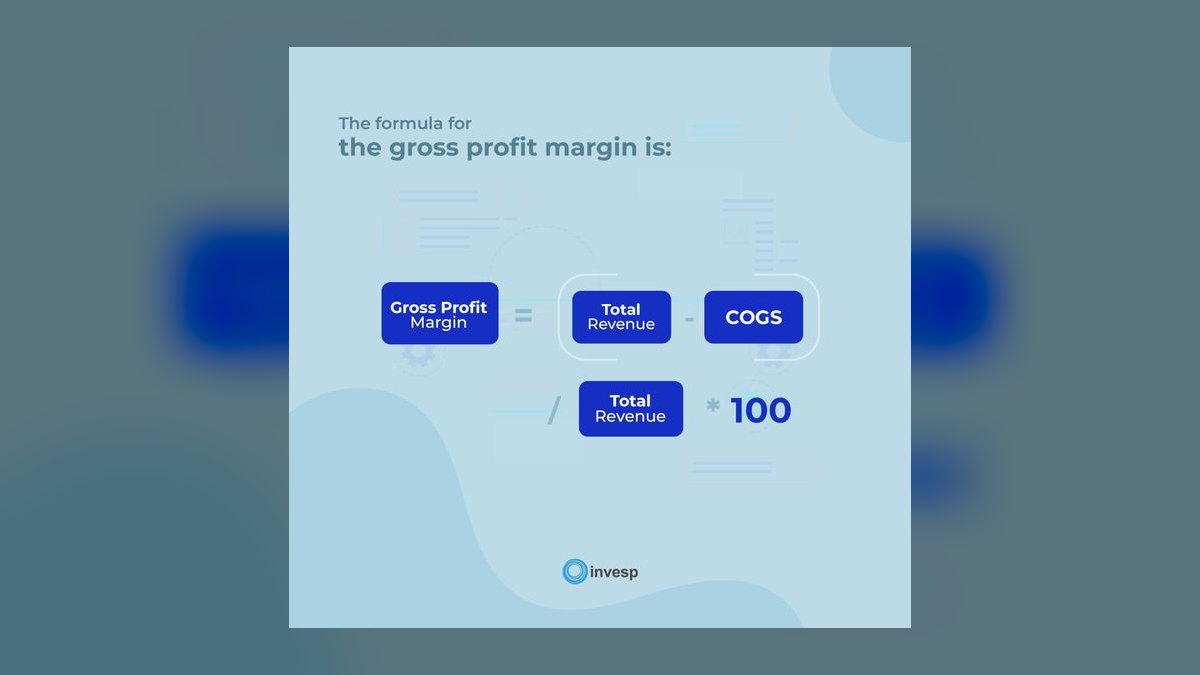
Gross margin per route ranks first because it is the atomic unit where revenue and cost meet, forcing accountability down to a level where action is possible. Company-level averages hide anchor accounts subsidizing unprofitable geographic clusters, a common failure mode in commercial cleaning. A healthy route clears 40-55% margin after direct labor, supplies, and allocated fuel; below 35% signals mispricing or scope creep. This metric exposes the 35-minute deadhead drives and isolated accounts that destroy profitability.
This KPI is for operations managers and owners who need to make weekly decisions about repricing, resequencing, subcontracting, or exiting routes. It trades away the simplicity of a single company-wide margin number for the complexity of accurate cost allocation, including travel time and supervisor visits. Compared to labor cost percentage, which is a broader diagnostic, route margin pinpoints the exact geographic and account-level problem, making it the most actionable metric on this list.
2. Labor Cost Percentage
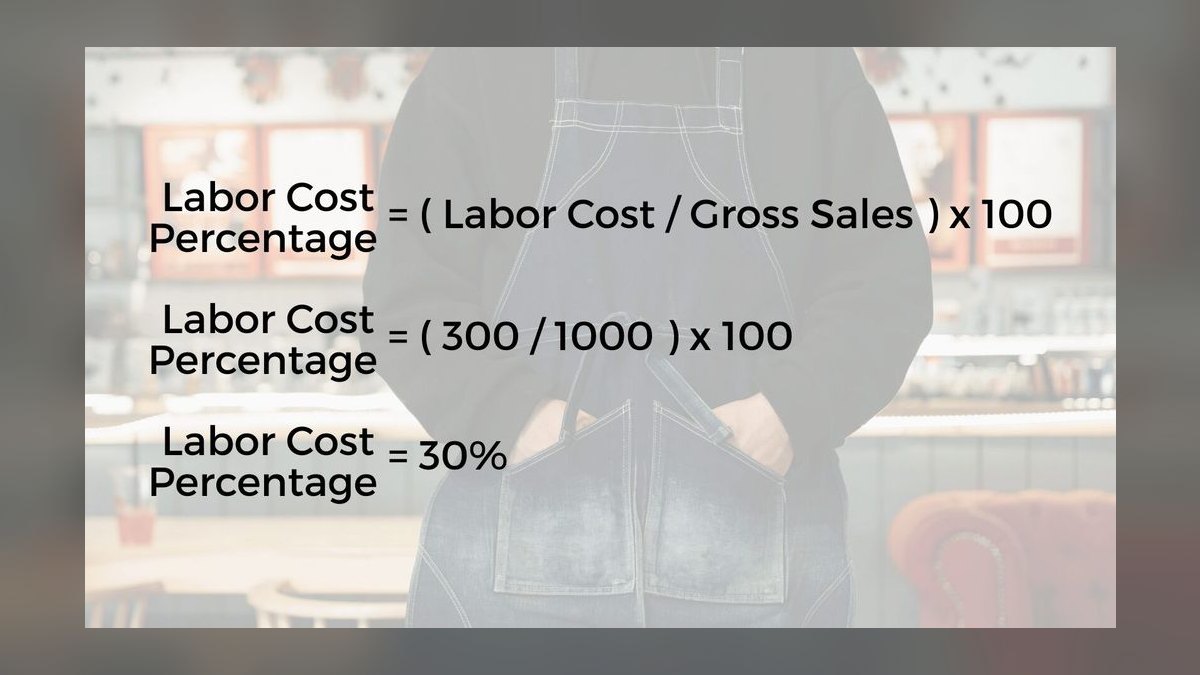
Labor cost as a percent of revenue ranks second because it is the largest and most volatile line in the cost structure, consuming 50-68% of revenue in commercial cleaning. A 10% improvement here moves the P&L by five to seven points, dwarfing any gains from chemical or equipment purchasing. Weekly reporting of this metric in front of supervisors typically recovers 1-3 points within six weeks through overtime compression alone.
This metric is for owners and supervisors who control scheduling and need the fastest possible win, as it requires no software purchase or pricing change to improve. It trades away the granularity of route-level analysis for a company-wide or route-level view that is easy to compute weekly from payroll data.
3. Contract Churn Rate
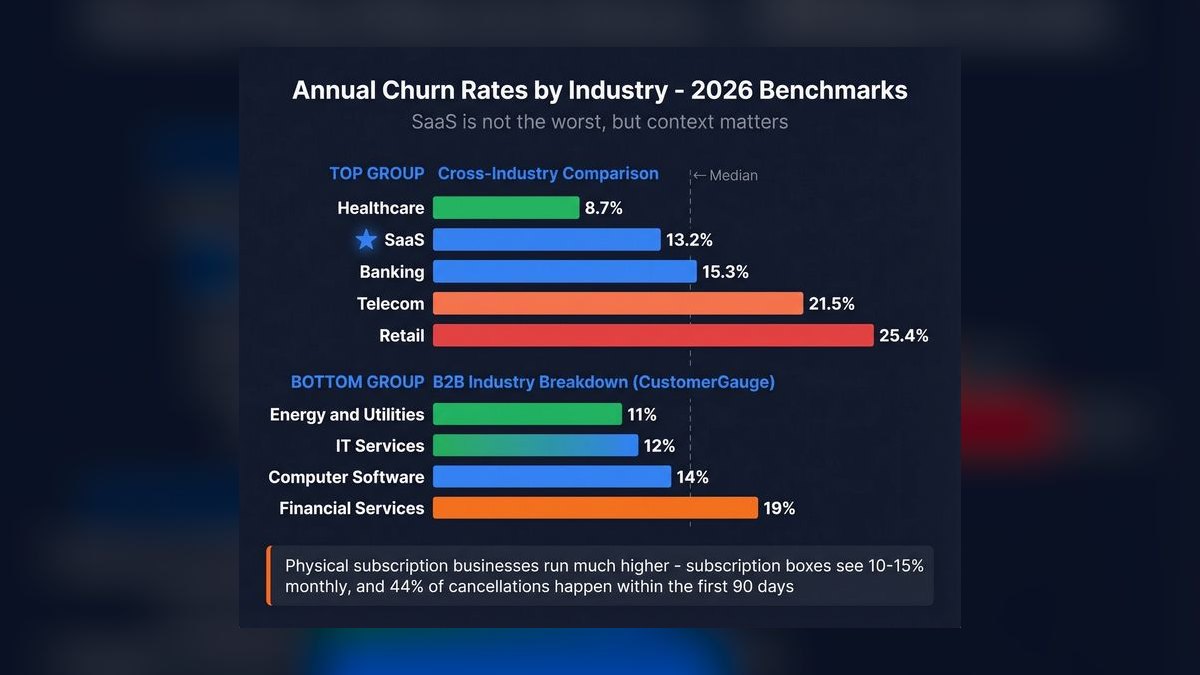
Contract churn ranks third because annual account churn in commercial janitorial is materially higher than in most B2B service categories, commonly running in the high teens to mid-twenties percent. The work is viewed as a commodity, procurement re-bids on cycle, and switching costs are low, making retention a direct revenue driver. Tracking both logo churn and revenue churn is critical, as losing one large anchor account diverges sharply from losing eleven small ones.
This metric is for account managers and leadership focused on revenue retention and renewal pipelines, as it directly predicts future revenue stability. It trades away the operational immediacy of labor metrics for a longer-term view that lags by one to two quarters behind satisfaction signals. Compared to facility-manager satisfaction, which is its leading indicator, churn is the lagging confirmation of lost revenue, making it essential for financial forecasting but less useful for same-week interventions.
4. Bid-To-Win Ratio

Bid-to-win ratio ranks fourth because it is the pricing discipline metric that prevents the most destructive pattern in the industry: over-discounting to win square footage. A healthy range is 25-40% for competitive commercial work; under 20% means pricing is out of market or bidding outside your footprint, while over 45-50% sustained means you are leaving money on the table.
This metric is for estimators and owners who need to calibrate pricing strategy and stop burning hours on bids they were never positioned to win. It trades away the internal cost focus of route margin for an external market view, requiring honest logging of every bid outcome. Compared to revenue per cleanable square foot, which it is joined at the hip with, bid-to-win ratio alone is meaningless without pricing context, making it a complementary rather than standalone diagnostic.
5. Revenue Per Cleanable Square Foot

Revenue per cleanable square foot ranks fifth because it is the core pricing unit that buyers understand and procurement compares, making it essential for competitive positioning. For standard office janitorial at five nights per week, monthly revenue commonly lands between $0.08 and $0.20 per square foot, with medical and lab environments pricing substantially higher.
This metric is for estimating teams and pricing strategists who need to set floors and compare bids across facility types. It trades away the cost-side granularity of labor metrics for a pure revenue view, which means it must be paired with cost data to be actionable.
6. Recurring Revenue Share
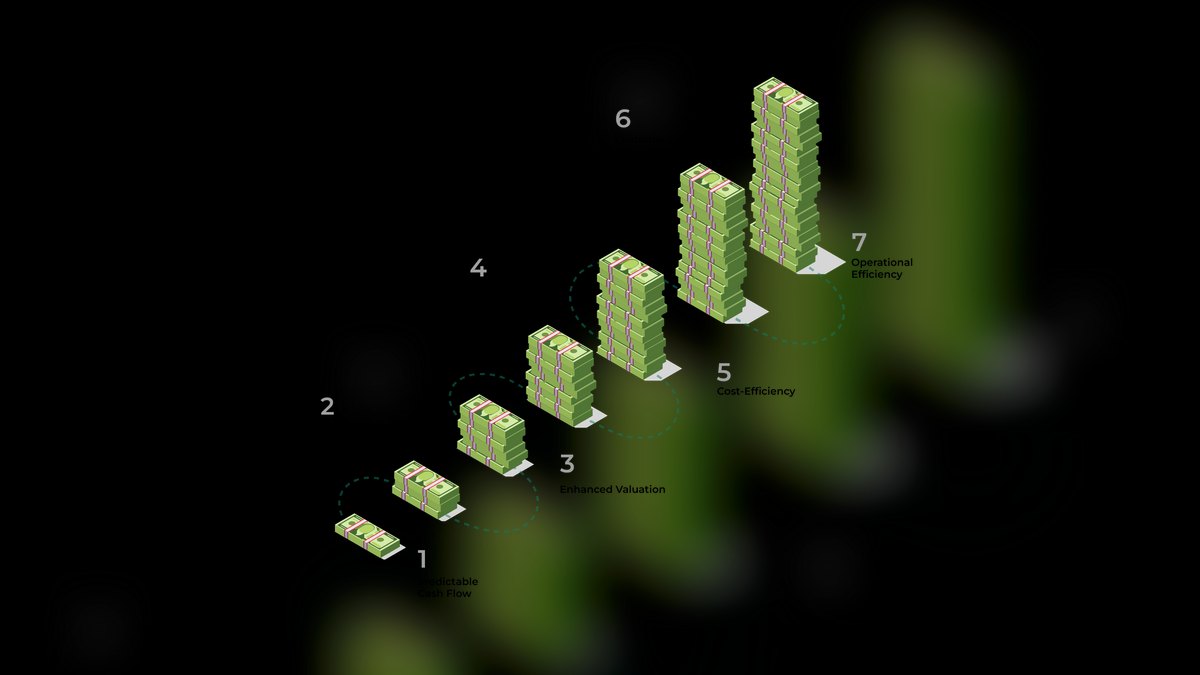
Recurring revenue share ranks sixth because it directly impacts cash flow stability and company valuation, with a target of 70-85% of total revenue from recurring janitorial contracts. Below 60% recurring, cash flow becomes lumpy and lenders discount your valuation, while above 90% means you are leaving high-margin project work on the table. Project work—strip and wax, carpet extraction, post-construction—often carries better gross margin because it is priced per job rather than per square foot.
This metric is for owners and CFOs who manage cash flow, financing, and long-term business valuation, as it signals financial health to external stakeholders. It trades away the operational immediacy of weekly labor metrics for a monthly strategic view of revenue mix. Compared to average revenue per account, which measures account size distribution, recurring revenue share measures the stability of the revenue stream itself, making it a higher-level portfolio metric that guides business development direction.
7. Average Revenue Per Account
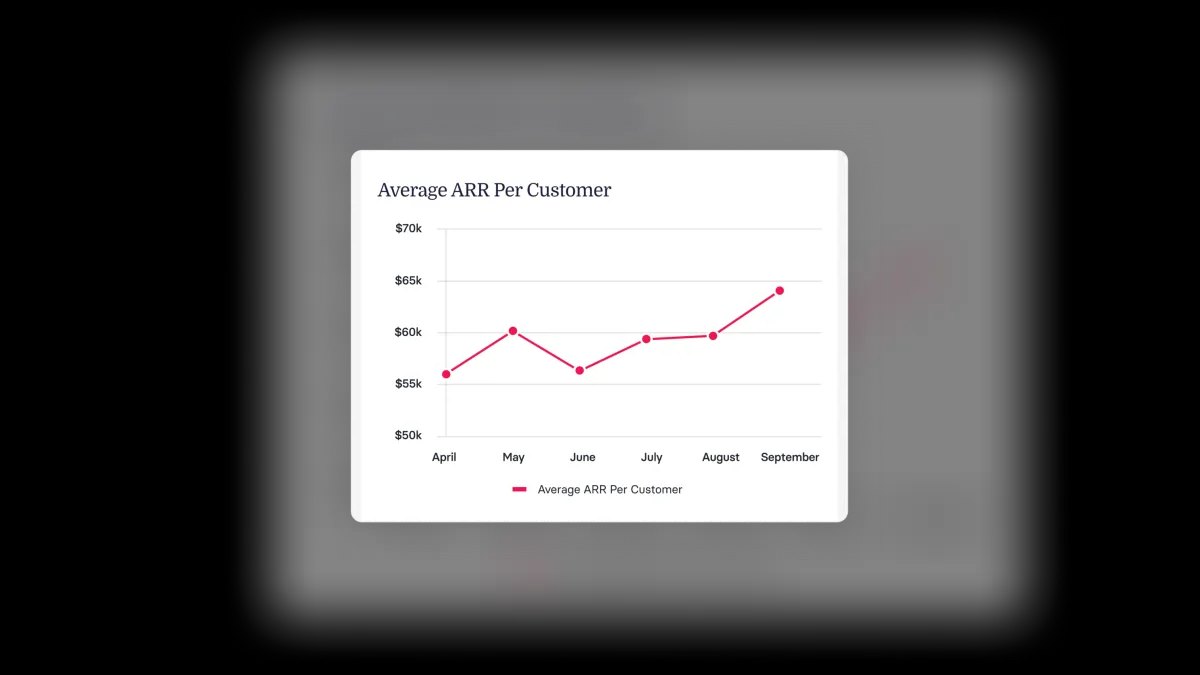
Average revenue per account ranks seventh because the distribution of account sizes, not the absolute level, reveals the economic floor below which no account is worth carrying. Servicing an account costs a supervisor visit, a supply drop, and an invoice cycle regardless of size, so small accounts in the bottom quartile can be liabilities dressed as growth. A $1,200 acquisition cost is excellent against a $4,000/month account and ruinous against a $450/month one, making this ratio critical for CAC interpretation.
This metric is for sales leaders and account managers who need to segment the book of business and make portfolio decisions about which accounts to keep, reprice, or exit. It trades away the cost-side detail of route margin for a pure revenue-size view, which means it must be paired with fully loaded cost data to be meaningful.
8. Customer Acquisition Cost
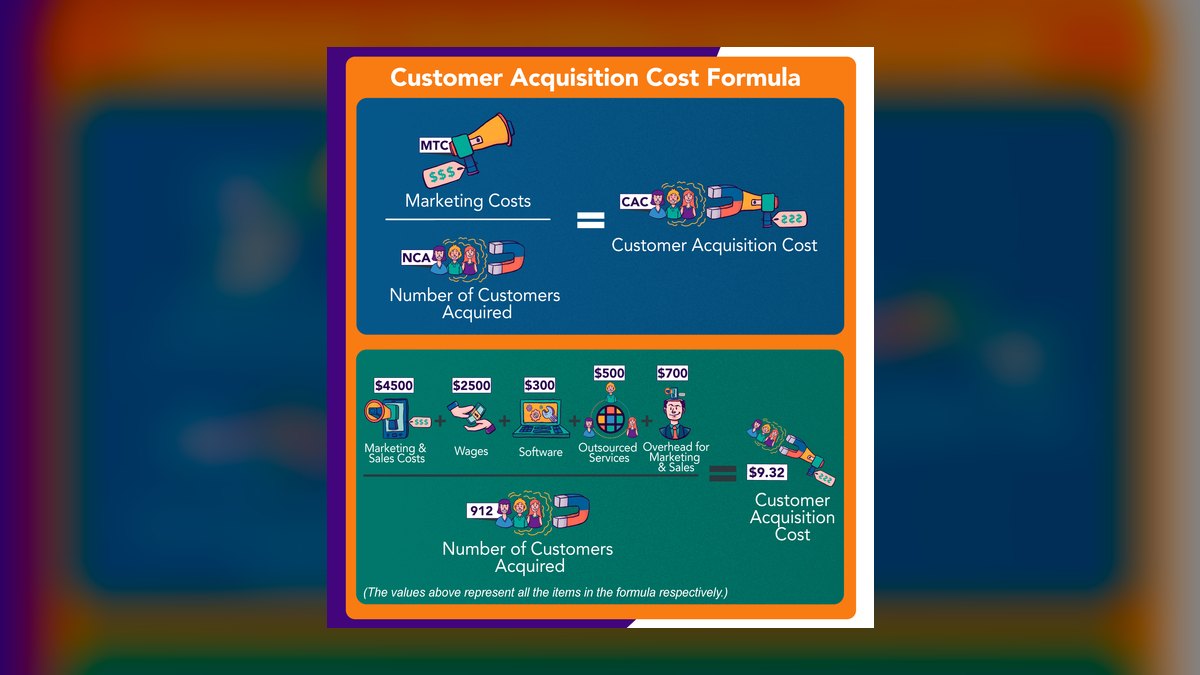
Customer acquisition cost ranks eighth because it determines whether new contracts actually pay back their sales and marketing investment, with CAC ideally recovering inside the first 6-9 months of contract revenue at normal gross margin. If a contract needs 18 months of margin to pay back its acquisition cost and annual churn is 20%, a meaningful share of new accounts never pay back at all.
This metric is for sales leaders and marketing teams who need to justify spending and optimize channel mix, as it directly ties acquisition efforts to financial return. It trades away the operational focus of labor and route metrics for a commercial view of growth efficiency, requiring accurate attribution of sales costs to new contracts.
9. Floor-Care Cycle Time

Floor-care cycle time ranks ninth because it is the most concrete productivity metric for a specific high-margin service, measured as labor hours per 1,000 square feet for a full strip-and-refinish cycle on vinyl composition tile. Times vary with coat count, furniture density, and machine class, with a walk-behind autoscrubber and burnisher changing the number materially versus mop-and-bucket work.
This metric is for operations supervisors and training managers who oversee floor-care crews and need a clear, repeatable benchmark for performance improvement. It trades away the portfolio-wide view of revenue metrics for a narrow, deep focus on one service line, which limits its applicability for companies without significant floor-care work.
10. Facility-Manager Satisfaction

Facility-manager satisfaction ranks tenth because it is the earliest predictor of contract renewal, leading a non-renewal by one to two quarters, making it a leading indicator rather than a scorecard. Passive and neutral responses are the ones that predict silent non-renewals—an actively complaining customer is engaged and usually salvageable, while a quiet 7-out-of-10 is often already collecting competitive bids.
This metric is for account managers and retention-focused leadership who need an early-warning system to intervene before renewal conversations, as it requires a structured follow-up protocol to be effective. It trades away the hard financial precision of revenue and margin metrics for a softer, more subjective measure that requires discipline to act on.
How we ranked these
The analysis measured ten commercial cleaning revenue KPIs: revenue per cleanable square foot, labor cost as a percent of revenue, contract churn, gross margin per route, average revenue per account, bid-to-win ratio, recurring revenue share, floor-care cycle time, customer acquisition cost by segment, and facility-manager satisfaction. Each was weighted by its direct impact on net profit, with labor-related metrics weighted highest due to their 50-68% cost share.
Deliberately ignored were vanity metrics like total revenue growth and logo count without revenue weighting, as they obscure profitability. Also excluded were metrics requiring new software or complex data collection, since the goal was actionable insights from existing data. Industry benchmarks were treated as sanity checks, not targets, because facility type and region vary too widely for universal standards.
Related questions
How many of these should a small operator track?
Start with three: labor cost as a percent of revenue, gross margin per route, and bid-to-win ratio. These cover cost, unit economics, and pricing. Add others only after each has changed a decision. Tracking all ten at once overwhelms and produces no behavior change.
What is the fastest way to improve labor cost percentage?
Report labor cost as a percent of revenue by route weekly to supervisors. Overtime is the fastest-moving line, accumulating invisibly when crews run 48 hours instead of 40. Weekly visibility typically compresses overtime by 1-3 points within weeks, directly improving margin.
How do I know if my bid-to-win ratio is healthy?
A healthy range is 25-40% for competitive commercial work. Under 20%, you're bidding outside your footprint or pricing out of market. Over 45-50% sustained, raise prices 8-12% on the next tranche. If win rate barely moves, you were underpriced.
What is the most common cause of low route margin?
Scope creep without repricing. Customers add break rooms, restrooms, or frequency over years without price adjustments, eroding 5-15 points of margin. Require annual scope reconciliation: walk the building, remeasure, compare to contract spec, and price the delta at renewal.
How does turnover affect labor cost?
Turnover is a hidden multiplier. Industry turnover runs 75-200% annually. Each replacement carries recruiting, background checks, onboarding, and a productivity ramp where new cleaners take 20-40% more time. A route with three turnover events runs elevated labor cost for 4-6 months.
What is a realistic profit improvement from tracking these KPIs?
On $2.4M revenue, expect $50k-$150k recovered annual profit, mostly from labor efficiency and pricing correction. Commercial cleaning nets 5-12% at small-to-mid end. Measurement moves you from bottom to top of that band; it doesn't transform margins beyond mid-teens.
How should I handle accounts below the economic floor?
Set a floor at the CRM level based on fully loaded cost to carry an account: supervision, invoicing, supply drops. If that cost is a meaningful fraction of monthly revenue, the account is a liability. Exit or reprice, as small accounts inflate revenue while destroying margin.
What is the best way to track facility-manager satisfaction?
Use a simple 1-5 score with a written follow-up protocol. Passive and neutral responses predict silent non-renewals. An actively complaining customer is salvageable; a quiet 7-out-of-10 is often collecting bids. Every neutral or negative response needs a same-week call.
FAQ
What is revenue per cleanable square foot?
It's monthly revenue divided by cleanable square footage under contract. For standard office janitorial at five nights per week, it commonly lands between $0.08 and $0.20. Medical and lab facilities price higher; warehouses lower. Track your own trend by facility type and flag contracts more than 15% below average.
What is a healthy labor cost as a percent of revenue?
The workable band is 50-65%. Below 50% usually means heavy subcontracting, favorable pricing, or understaffing that will show up as complaints. Above 68-70%, the business can't cover overhead and insurance. Large nationals run at the favorable end; owner-operated firms under $1M often run at the unfavorable end.
What is typical contract churn in commercial cleaning?
Annual churn in the high teens to mid-twenties percent is common. Firms with strong inspection programs and named account management pull it into single digits or low teens. Track both logo churn and revenue churn—they diverge sharply when you lose one large anchor account.
What is a good gross margin per route?
A route should clear 40-55% gross margin after direct labor, supplies, and allocated fuel. Below 35%, the route is mispriced or over-specified. The most common cause is scope creep: added services never repriced. Fix by annual scope reconciliation and pricing the delta at renewal.
What is average revenue per account and why does it matter?
It ranges from several hundred to five figures monthly depending on segment. The key is the distribution, not the absolute level. Sort accounts descending and look at the bottom quartile. If servicing an account costs a supervisor visit, supply drop, and invoice cycle regardless of size, there's a floor below which no account is worth carrying.
What is a healthy bid-to-win ratio?
25-40% for competitive commercial work. Under 20%, you're either pricing out of market or bidding outside your footprint. Over 45-50% sustained, raise prices 8-12% on the next tranche. If win rate barely moves, you were underpriced. Track quoted price per square foot alongside win rate.
What is recurring revenue share and why target 70-85%?
It's the portion of revenue from recurring janitorial contracts versus project work. Target 70-85%. Below 60%, cash flow becomes lumpy and lenders discount valuation. Above 90%, you're leaving high-margin project work on the table—project work often carries better gross margin because it's priced per job.
What is floor-care cycle time?
Labor hours per 1,000 square feet for a full strip-and-refinish cycle on VCT. Times vary with coat count, furniture density, and machine class. Track your own baseline per crew and building. Use the spread between crews as a training signal to improve efficiency.
What is customer acquisition cost and how should I use it?
Total sales and marketing cost divided by new contracts signed. The ratio matters: CAC should recover inside the first 6-9 months of contract revenue at normal gross margin. If it takes 18 months and annual churn is 20%, a meaningful share of new accounts never pay back.
How do I avoid the failure mode of instrumenting all ten metrics at once?
Sequence the rollout. Assign a single named owner per metric. Do not add the next metric until the previous one has visibly changed a decision. Ten new reports at once produces zero behavior change because no one owns any. Start with the biggest gap and build from there.
Sources
- https://www.ibisworld.com/industry-statistics/market-size/janitorial-services-united-states/
- https://www.bdc.ca/en/articles-tools/entrepreneur-toolkit/templates-business-guides/glossary/key-performance-indicators
- https://www.investopedia.com/terms/c/churnrate.asp
- https://www.cleaninginstitute.org/
- https://www.osha.gov/cleaning-industry
- https://www.epa.gov/
- https://www.sba.gov/business-guide/manage-your-business/track-finances
Related on PULSE
- [What are the key sales KPIs for the Commercial Janitorial and Cleaning Services industry in 2027?](/knowledge/ik0067)
- [What are the key sales KPIs for the Commercial Window Cleaning and High-Rise Services industry in 2027?](/knowledge/ik0045)
- [What are the key sales KPIs for the Commercial Kitchen Hood & Exhaust Cleaning Services industry in 2027?](/knowledge/ik0236)
- [Top 10 Commercial Real Estate Revenue KPIs in 2027](/knowledge/ik0703)
- [What are the key sales KPIs for the Commercial Sanitation & Cleaning Equipment Distribution industry in 2027?](/knowledge/ik0300)
- [What are the key sales KPIs for the Commercial Solar Panel Cleaning & Soiling Management Services industry in 2027?](/knowledge/ik0283)
This page will be disappearing soon. Save it to your device for $1 — or read it free while it is here.
@Kory-White- · if Venmo asks, the last 4 of my number are 2012
This page is gone.
This one is off the shelf now. $1 keeps it on your phone for good — the whole page, pictures and diagrams included.
 pulse-industry-kpisTop 10 Nonprofit Foundation Revenue KPIs in 2027
 pulse-industry-kpisTop 10 Fitness Center Revenue KPIs in 2027
 pulse-industry-kpisTop 10 RIA Wealth Management Revenue KPIs in 2027
 pulse-industry-kpisRevenue Per Available Room (RevPAR) Recovery in Urban Luxury Hotels in 2027
 pulse-industry-kpisTop 10 Logistics Cost per Mile and Revenue per Load Metrics in 2027
 pulse-industry-kpisTop 10 Insurance Loss Ratio and Combined Ratio Benchmarks in 2027
 pulse-industry-kpisHealthcare SaaS: Patient Lifetime Value vs. Customer Acquisition Cost for Specialty Practices in 2027
 pulse-industry-kpisMembership Dues Revenue per Active Member: Association Renewal KPI in 2027
 pulse-industry-kpisTop 10 Parcel Carrier Revenue KPIs in 2027
 pulse-industry-kpisTop 10 Cruise Line Revenue KPIs in 2027