


What are the top 10 NIL deals in college football for the 2027 season in 2027?
Quality
Certified

No credible top-10 list for the 2027 college football season exists yet — those deals are still being negotiated and most terms stay private. Expect the top ten to be quarterbacks plus a few elite tackles and edge rushers, each blending school revenue share with third-party NIL, plausibly $3M–$6M+ per year.
The outcome you should expect
If you are looking for a signed, sourced, ranked list of the ten largest NIL packages for the 2027 college football season, understand what you are actually asking for. The 2027 season is played in the fall of 2027. The recruits who will headline it sign in December 2026, the transfer market that reshapes it moves in the winter and spring of 2027, and the extensions that reset the top of the market get negotiated right up until fall camp. Nothing is final, and almost nothing is public in a verified form. Anyone publishing a hard top-ten for 2027 today is publishing estimates, reported figures, and agent-sourced leaks — not a filing you can audit.
What you can predict with real confidence is the *shape* of that list, because the shape is now structural rather than random. Since the House v. NCAA settlement took effect on July 1, 2025, athlete compensation at participating schools flows through two distinct channels that stack on top of each other. The first is the school's own revenue-share pool — a capped, direct payment from the athletic department to the athlete. The second is third-party name, image, and likeness money: brand endorsements, collective agreements, appearance fees, autograph sessions, social media campaigns, and equity or in-kind arrangements. When a reporter says a player is "on a $5 million deal," they are almost always describing the combined figure across both channels, sometimes annualized from a multi-year agreement, sometimes not.
So the honest answer to the question has three parts. First: the positional composition of the top ten is close to deterministic. Quarterbacks will occupy roughly half to two-thirds of the slots, with the remainder split among left tackles, edge rushers, and the occasional generational wide receiver or corner. Second: the dollar band is forecastable within a range, because the revenue-share cap is contractually escalated and the third-party layer is now filtered through a fair-market-value review. Third: the specific names will be a mix of returning 2026 starters who chose not to declare for the draft, high-profile portal movers, and one or two true freshmen or second-year players from the 2026 and 2027 recruiting classes whose packages were front-loaded to win a signing battle.
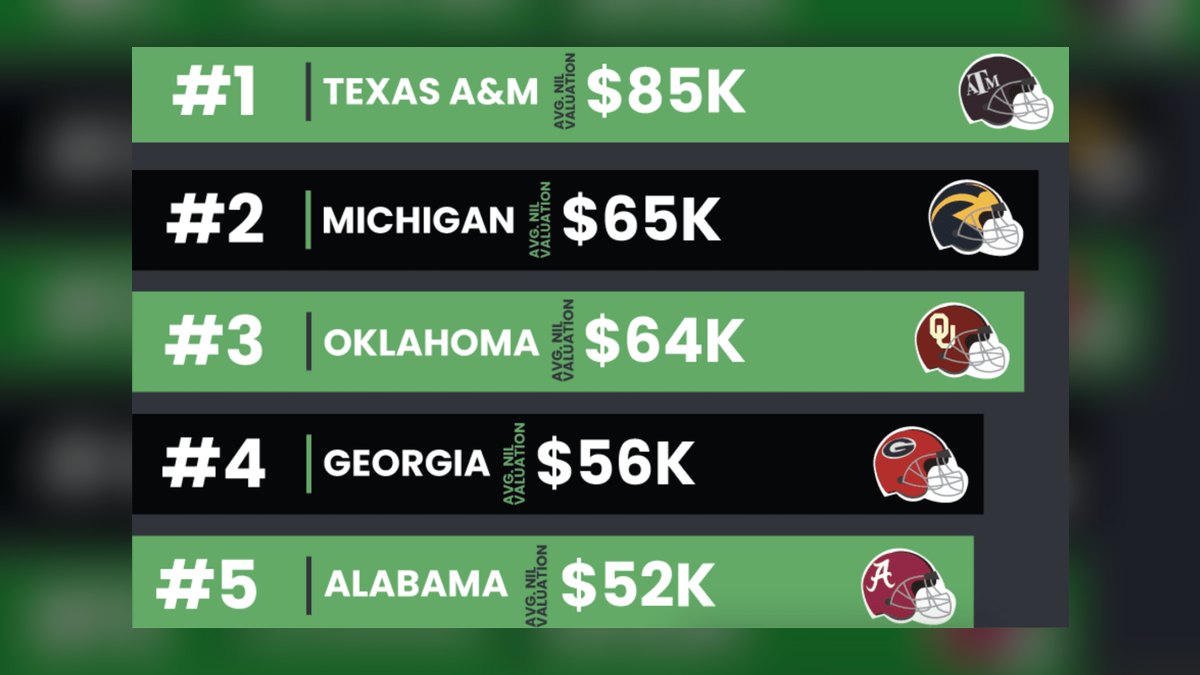
That is a more useful answer than a fabricated leaderboard, because it survives contact with reality. A named list built today would be wrong by March 2027 — injuries, coaching changes, portal moves, and clearinghouse denials all reshuffle the board. The framework below does not.
What actually sets the ceiling on a package
The single most important number in college football compensation is the annual revenue-share cap established by the House settlement. In its first year, 2025–26, that cap was $20.5 million per school across all sports, derived from roughly 22% of a defined pool of average power-conference athletic revenue. The settlement provides for annual escalation of about 4%, with periodic recalculation against actual revenue. Compounding forward, the cap for the 2027–28 academic year lands somewhere in the low $20-millions — call it roughly $22 million as a planning figure, subject to whatever recalculation the settlement's formula produces.
Schools are not required to spend that pool evenly. Public reporting through the first cycles showed most football-driven power programs allocating something on the order of 70–80% of their cap to football, with men's basketball taking most of the remainder and Olympic sports receiving comparatively little. At a ~75% allocation against a low-$20-millions cap, a 2027 football program is working with roughly $15–17 million of *school* money to distribute across a 105-man roster.

That constraint does most of the work in explaining the top of the market. A program cannot pay one quarterback $8 million out of the revenue-share pool without gutting the other 104 scholarship-equivalent spots. In practice, athletic departments treat the pool like a salary cap in a hard-cap league: they publish an internal positional value chart, reserve a premium tier for quarterback and offensive tackle, and set a floor for special teams and depth. The very largest reported packages therefore cannot be pure revenue share. They must be layered — a large school payment plus a substantially larger third-party NIL component.
The third-party layer is where the ceiling actually lives, and where the new friction sits. Under the settlement framework, third-party deals at or above a $600 threshold must be submitted to the NIL Go clearinghouse, administered by Deloitte, which evaluates each agreement against two tests: whether there is a *valid business purpose* — an actual good or service being provided to a real market — and whether the compensation falls within a defensible *fair market range* for that service. Enforcement sits with the College Sports Commission, the entity created by the power conferences to administer the settlement's rules, with denied deals routed to an arbitration process rather than a courtroom in the first instance.
The practical consequence is that the biggest 2027 deals will look different from the biggest 2023 deals. A 2023-era collective could wire seven figures for a vaguely defined "community appearance" package. A 2027 deal of the same size needs a documented deliverable set: a national brand with real distribution, a defined campaign schedule, measurable audience, and a rate card that survives comparison to what a similarly-followed professional athlete or creator earns. That pushes the top of the market toward athletes with genuine commercial reach — large social followings, national television exposure, a marketable personal story — and away from athletes whose value is purely on-field production at a program with a wealthy donor base.
Benchmarks and realistic ranges for 2027
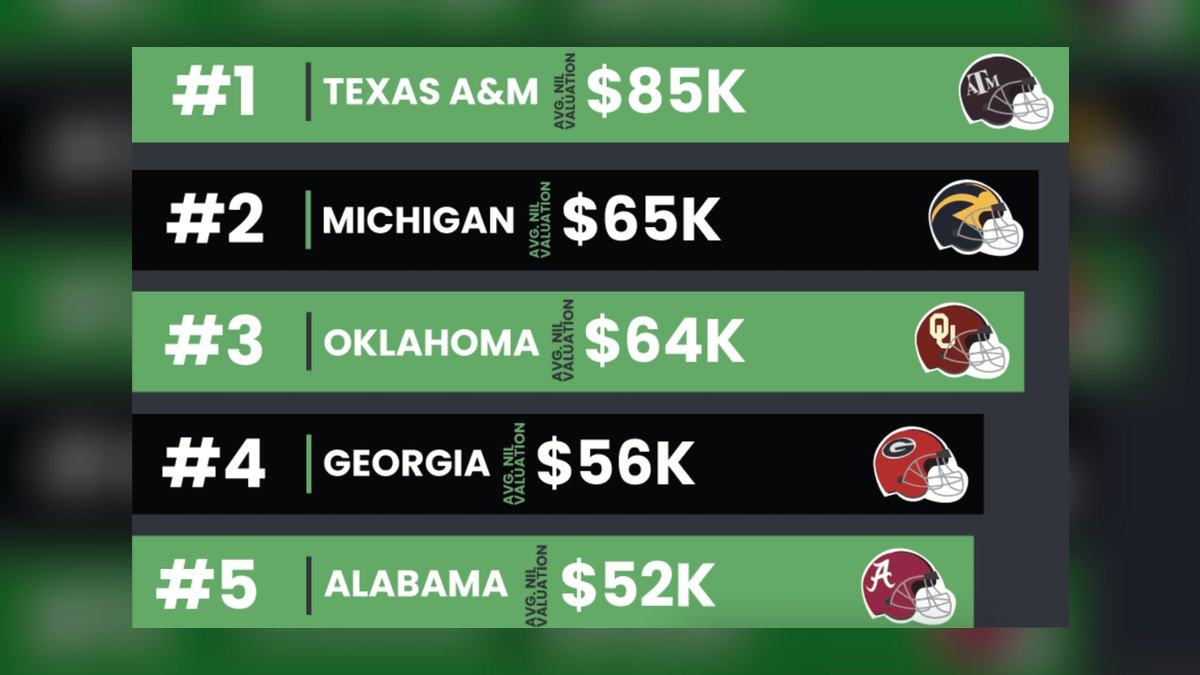
Public reporting on individual packages is uneven, unconfirmed by the parties, and frequently annualized inconsistently. Treat every figure below as *reported*, not audited. With that caveat, the reported market gives you usable anchors.
In the 2024–2026 window, the widely reported headline quarterback agreements clustered in a band. Multiple outlets reported a Duke package for transfer quarterback Darian Mensah in the neighborhood of $8 million across two years — roughly $4 million annually. Miami's reported agreement for Carson Beck was described around the $4 million mark for a single season. Michigan's reported package for five-star recruit Bryce Underwood was characterized in the eight-figure range spread across multiple seasons, again implying something in the $2.5–4 million-per-year zone once amortized. None of these figures were confirmed by the schools. What they collectively establish is a reported ceiling that had settled roughly in the $3–5 million-per-year range for the very top of the quarterback market entering the settlement era.
From that anchor, a defensible 2027 forecast looks like this:
The single largest package. Plausibly $5–8 million for the season, all-in, if a generational quarterback with national brand appeal is on the market in a competitive situation. Anything reported meaningfully above that should be scrutinized for multi-year totals being reported as annual figures, or for an equity or trust component that will never actually be paid out in 2027.

Slots two through five. Likely $3–5 million annually. This tier is almost entirely quarterbacks, with room for one elite left tackle or edge rusher whose draft grade is a consensus top-five pick.
Slots six through ten. Likely $2–3.5 million annually. Here the positional diversity increases: premium offensive tackles, edge rushers, and one or two wide receivers or cornerbacks with unusual commercial reach.
The tenth-ranked package as a threshold. If the top ten cuts off somewhere near $2 million annually for the 2027 season, that is a reasonable central estimate. It could sit higher if a legal ruling loosens the cap or if federal legislation changes the enforcement posture; it could compress if clearinghouse denials meaningfully chill the third-party layer.
For context on the broader market these deals sit inside, Opendorse's periodic NIL industry reporting placed total athlete compensation across all college sports in the billion-plus range before the settlement, with post-settlement projections rising substantially once direct school payments were added to third-party activity. Football is the dominant share of that total. On3's roster valuation product, which estimates aggregate roster value per program, is the most commonly cited public proxy for how much a given team is spending — useful directionally, but it is a model output, not a payroll disclosure.
A few structural notes that shape the ranges. Multi-year deals are now common at the top, which means a "2027 deal" may be year two or three of an agreement signed in 2025. Buyout and repayment clauses have appeared in reporting — provisions requiring an athlete to repay a portion if they transfer early — which changes the effective value of a headline number. And the 105-player football roster limit means every dollar at the top is a dollar not spent on depth, so programs with elite top-end packages frequently have thinner rosters behind them.
Where a "top 10" list goes wrong

The failure modes here are consistent enough to enumerate, and knowing them is most of the value of this page.
Multi-year totals reported as annual. This is the most common distortion. A three-year, $9 million agreement gets reported as "a $9 million deal," then repeated as "$9 million a year." Always ask: over what term, and is that guaranteed or incentive-laden?
Committed versus paid. Collective-funded deals depend on donor money that must actually arrive. In the pre-settlement era, multiple programs saw pledged collective money fall short of what was promised to athletes. Post-settlement, the school revenue-share component is far more reliable — it comes from the athletic department's own budget — but the third-party component still carries collection risk.
Clearinghouse denial risk. A deal announced in January 2027 that fails the valid-business-purpose test in February is not a 2027 deal. Reporting rarely follows up on denials, so lists tend to include agreements that never cleared. Since denials route to arbitration, the resolution can lag months behind the announcement.
Agent inflation. Representatives have an incentive to leak high numbers: it resets the market for their other clients and pressures competing programs. Numbers sourced to "a person familiar with the negotiations" are frequently the athlete's side of the table.

Cap-relief creativity. Because the revenue-share pool is capped and third-party deals are reviewed, there is pressure toward arrangements that sit at the edges — front-loading payments into a signing period, structuring compensation through family members, or attaching value to equity in a private company whose valuation is unverifiable. Any of these can inflate a reported headline number well past what the athlete will actually realize in the 2027 calendar year.
Injury and portal churn. A quarterback who tears an ACL in September is still on the deal but disappears from every "biggest deals" list published in November, which biases retrospective lists toward players who stayed healthy. Conversely, a spring portal move can vault someone into the top five weeks after a list is published.
Litigation and legislative overhang. The settlement framework is not static. Ongoing employment-status litigation, state-law conflicts where individual state NIL statutes cut against the settlement's restrictions, and proposed federal legislation aimed at codifying college athlete compensation rules could each change the cap, the clearinghouse, or the enforcement mechanism before or during the 2027 season. A list built on 2026 rules can be structurally obsolete.
The practical upshot: any published top-ten for the 2027 season should be read as a *reported estimate ranking*, with error bars of roughly ±40% on individual figures and meaningful uncertainty about whether any given name belongs on the list at all.
How to build your own 2027 board

If you actually need a defensible view of the top 2027 packages — for a media project, a competitive-intelligence brief, or a program's own market analysis — build it as a tracked model rather than consuming someone else's list. Here is a workable process.
Set your definition first, in writing. Decide whether you are ranking annualized 2027-season compensation or total contract value; whether you include only cash or also equity, in-kind, and vehicle/housing arrangements; and whether school revenue share and third-party NIL are combined. Most disagreements between published lists are definitional, not factual. Write the definition at the top of the model and never change it mid-cycle.
Build the universe from the roster, not the rumor mill. Start with the plausible population: returning starters at premium positions from the 2026 season who have remaining eligibility, the top ~50 of the 2027 recruiting class, and the top ~30 draft-eligible players who might return. That is a few hundred names. Everything else is noise.
Establish a positional multiplier baseline. Using the reported market, set a per-position index against quarterback as 1.0 — tackle and edge somewhere in the 0.5–0.7 range, receiver and corner lower, interior and off-ball positions lower still. Apply it to the program's estimated football allocation to get a first-pass revenue-share estimate for each name.
Layer the third-party estimate separately. This is where commercial reach matters more than depth chart position. Pull follower counts across platforms, count national broadcast windows the player's team is scheduled for, and note any existing national brand relationships. An athlete with two million followers and a national apparel relationship can clear a fair-market review at a number a more productive but less-followed teammate cannot.

Score every data point for source quality. Tier one: a school disclosure, a court filing, a signed document you have seen. Tier two: a named on-the-record source. Tier three: a single-outlet anonymous report. Tier four: aggregator repetition of tier three. Only tier one and two should move your central estimate; tier three widens the range.
Re-baseline on a fixed calendar. The board changes at predictable moments: the December signing period, the winter and spring portal windows, spring practice, the draft declaration deadline, and fall camp. Re-run the model at each, and archive the prior version so you can see how wrong you were and calibrate.
Run that loop for two cycles and your board will be materially better than any published list, for one boring reason: you will know exactly how much of it is measured and how much is guessed, and you will have written the difference down.
Related questions
Why are quarterbacks so dominant at the top of the market?
Quarterback is the only position where a single player measurably changes win totals, and it carries the highest commercial recognition. Programs therefore treat it as the one slot where overpaying is rational. Expect quarterbacks to hold five to seven of the top ten slots in any 2027 ranking.
Does the revenue-share cap include third-party NIL money?
No. Direct school payments count against the capped pool. Approved third-party deals sit outside it, which is why the largest packages are layered. That structure is also why the clearinghouse review of third-party agreements is the main lever on the true market ceiling.
How reliable are On3 and Opendorse valuation numbers?

They are models, not disclosures. On3's valuations estimate what an athlete's NIL is worth based on performance, influence, and market factors; Opendorse reports aggregate marketplace activity. Both are useful directionally and widely cited, but neither reflects the actual terms of any individual agreement.
Can a deal be reported and then never happen?
Frequently. Announced agreements can fail the valid-business-purpose or fair-market-range review, collectives can fall short on pledged funding, and athletes transfer before payments vest. Published lists rarely issue corrections, so stale entries persist long after the underlying deal collapsed.
FAQ
Is there an official public list of the largest college football NIL deals?
No. There is no mandatory public disclosure of individual athlete compensation at the level a public company's executive pay disclosure provides. Deals are submitted to the clearinghouse for review, but that submission is not published. Every ranking you see is assembled from reporting, agent leaks, and modeled estimates, which is why figures for the same athlete vary widely between outlets.
How much can one school spend on football in the 2027 season?
The revenue-share cap was $20.5 million per school across all sports in its first year, with roughly 4% annual escalation and periodic recalculation, putting the 2027–28 figure in the low $20-millions. Programs commonly allocate around 70–80% of that to football, so roughly $15–17 million of school money spread across a 105-player roster. Third-party NIL sits on top of that and is not capped.

What is the NIL Go clearinghouse and why does it matter for the biggest deals?
It is the review system, administered by Deloitte under the settlement framework, that evaluates third-party deals of $600 or more. It tests whether the arrangement has a valid business purpose and whether the payment falls in a defensible fair market range. Because the largest packages depend heavily on the third-party layer, this review is the primary constraint on how high the top of the market can go.
Will the top ten for 2027 be mostly recruits or returning players?
Mostly returning players and portal transfers. True freshmen occasionally command headline packages when a program is winning a national recruiting battle, but the bulk of top-tier money follows proven production and existing commercial reach. Expect roughly one to three freshmen or second-year players in any credible top ten, with the rest established starters.
Do these deals guarantee the money?
Not uniformly. Reported agreements increasingly include performance conditions, availability clauses, and repayment provisions triggered by an early transfer. The school revenue-share component tends to be the most reliable portion because it comes from the athletic department budget; the third-party portion carries both approval risk and collection risk.
When will reliable 2027 numbers actually be available?
Directionally, after the December 2026 signing period; more firmly after the spring 2027 portal window closes and rosters settle. Even then, expect reported figures rather than verified ones. The most accurate public picture usually emerges in retrospect, during and after the season, once enough independent sources converge on the same range.
Sources
- https://www.ncaa.org/
- https://www.collegesportscommission.org/
- https://www.espn.com/college-football/
- https://www.on3.com/nil/
- https://opendorse.com/
- https://www.sportico.com/
- https://apnews.com/hub/college-football
- https://www.si.com/college/
- https://www.knightcommission.org/
- https://www.deloitte.com/us/en/services/consulting.html
Related on PULSE
- How school revenue-share caps changed college roster budgeting
- What the NIL clearinghouse actually checks before approving a deal
- Positional value charts: how programs price quarterbacks against tackles
- Reading reported contract figures: annualized vs. total value
- Transfer portal windows and how they reprice the market mid-cycle
This page will be disappearing soon. Save it to your device for $1 — or read it free while it is here.
@Kory-White- · if Venmo asks, the last 4 of my number are 2012
This page is gone.
This one is off the shelf now. $1 keeps it on your phone for good — the whole page, pictures and diagrams included.
 pulse-recentWhat are the top 10 NIL deals signed by college field hockey players in 2027?
 pulse-recentWhat changes to NCAA NIL rules took effect for the 2027 academic year in 2027?
 pulse-recentWhat are the most common NIL contract terms that student-athletes overlook in 2027?
 pulse-recentHow do NIL collectives structure payments to comply with IRS guidelines in 2027?
 pulse-recentHow much should a Group of 5 school budget annually for its NIL fund to stay competitive in 2027?
 pulse-recentWhat are the top 10 NIL collectives by fundraising total in 2027?
 pulse-recentWhat are the top 10 NIL deals signed by college track and field athletes in 2027?
 pulse-recentWhat are the top 10 NIL deals signed by high school football recruits in 2027?
 pulse-recentHow do state laws on NIL differ across the country in 2027?
 pulse-recentWhat are the key differences between NIL deals for high school and college athletes in 2027?