


How does multi-touch attribution work — and which model should you use in 2027?
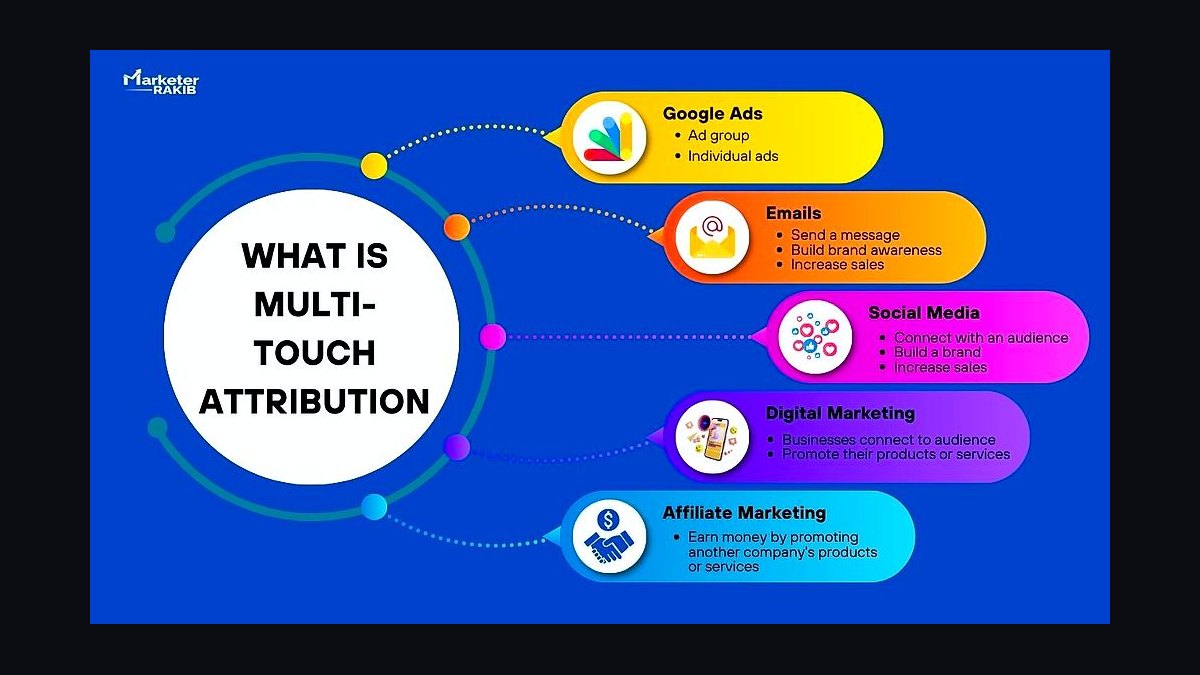
For most B2B SaaS in 2027, run W-shaped as the primary model if you're enterprise with a 6-12+ month sales cycle, and U-shaped (position-based) if you're mid-market with a 30-90 day cycle. PLG and SMB motions should use time-decay. Stop running last-touch — cookie deprecation made it a lie. The real upgrade isn't picking a fancier formula; it's pairing one declared model (CRM-deterministic) with an AI-modeled overlay (Dreamdata, HubSpot Marketing Hub Enterprise, or Bizible/Adobe Marketo Measure) and reporting one number to the executive team.
TL;DR
- Multi-touch attribution splits credit for a closed deal across every touchpoint a buyer hit — not just the first or last one.
- Six standard models: first-touch, last-touch, linear, time-decay, U-shaped (40/20/40), W-shaped (30/30/30/10).
- Enterprise B2B = W-shaped. Mid-market B2B = U-shaped. PLG/SMB = time-decay. Brand-spend justification = media-mix modeling, not MTA.
- The 2024-2025 privacy reset (third-party cookie sunset, iOS 17+ MPP) broke pure web tracking. Modern stack = deterministic CRM signals + modeled overlay.
- The fastest way to lose CMO credibility is reporting attribution without picking ONE blessed model, never validating against pipeline, or pretending MTA replaces MMM.
The 6 Models + When Each Wins
| Model | Credit Split | Best For | Watch Out For |
|---|---|---|---|
| First-touch | 100% first | Brand and demand-gen teams measuring awareness sources | Ignores everything that actually closed the deal |
| Last-touch | 100% last | Direct-response, paid-search, retargeting teams | Broken by cookie deprecation and dark-social referral loss |
| Linear | Equal across all | Reporting transparency to a skeptical board | Tells you nothing decisive — everyone gets a participation trophy |
| Time-decay | Heavier on recent | PLG, SMB, transactional motions under 30 days | Underweights the top-of-funnel content that started the journey |
| U-shaped | 40 / 20 / 40 | Mid-market B2B SaaS, 30-90 day cycles | Assumes only first and last matter — fine for short funnels, weak for enterprise |
| W-shaped | 30 / 30 / 30 / 10 | Enterprise B2B, 6-12 month cycles, MQL-to-Opp stages | Requires clean stage hygiene in Salesforce or HubSpot — garbage in, garbage out |

The honest read: U-shaped and W-shaped are the only two models that mature RevOps teams report on. First-touch and last-touch are useful diagnostic lenses you slice the data through, not the default model you show the CFO. Linear is a comfort blanket. Time-decay is right for PLG and dead-wrong for enterprise.
The 2024-2025 Cookie/Privacy Reset (and the new hybrid stack)
In 2024 Google finally killed third-party cookies in Chrome. In 2023-2024 iOS 17 Mail Privacy Protection broke email open-tracking and inflated open rates to 70%+ across every ESP. Add LinkedIn's tightening conversion API, GA4's modeled (not measured) conversions, and the rise of dark social — Slack DMs, Reddit threads, podcast mentions that never show up in any UTM — and the entire 2019-era last-touch attribution stack stopped working.

The 2027 hybrid stack looks like this. Layer 1 (deterministic): CRM-side signals you actually own — form fills with UTM parameters, gated content downloads, demo bookings, sales activities logged to the contact and account, product-led signups tied to a work email. This is your source of truth. Layer 2 (modeled): AI-assisted attribution that takes the deterministic signal and infers credit across upstream touches — Dreamdata ($30-100K/yr, the modern B2B SaaS leader), HubSpot Marketing Hub Enterprise (built-in if you're already on platform), or Bizible/Adobe Marketo Measure (legacy enterprise, still the default at Fortune 500). Layer 3 (media-mix): quarterly MMM analysis for brand and event spend that MTA can't see — Plannuh, Triple Whammy, or a Recast/in-house regression model. MTA tells you which channels participated in deals that closed; MMM tells you which spend categories moved the overall demand curve.

Most B2B SaaS over $20M ARR now runs all three layers in parallel — deterministic feeding the executive dashboard, modeled feeding the channel-mix conversations with the demand-gen team, and MMM feeding the annual budget planning cycle with the CFO. Under $20M ARR, deterministic plus a single modeled tool (usually HubSpot Marketing Hub Enterprise or Dreamdata) is enough, and you can postpone MMM until you're spending $5M+/year on paid media. The mistake teams make is buying Dreamdata or Bizible before they've cleaned up their UTM hygiene and stage definitions in the CRM — the modeled layer is only as good as the deterministic signal feeding it.
The 3 Attribution Failure Modes That Burn CMO Credibility

Failure 1: Reporting attribution without picking ONE model. The CMO walks into QBR with first-touch data showing paid search is the hero. The CRO pulls last-touch and says sales-led outbound closed everything. They argue in front of the CEO. Both are technically right and both lose credibility. Fix: the RevOps lead picks one model — U-shaped or W-shaped — and that's the only model that appears in executive dashboards. Other models live in the analyst playground for diagnostic slicing, never in board decks.

Failure 2: Never validating the model against pipeline outcomes. Most attribution setups are an Excel formula or a HubSpot toggle that nobody has stress-tested. Pick 20 recent closed-won deals, manually trace the buyer journey by talking to the AE, and compare the manual story to what your model says. If the model says paid social drove 40% of credit on deals where the AE swears they never heard "I saw your LinkedIn ad" — your model is broken. Recalibrate quarterly.
Failure 3: Using MTA to justify brand and long-tail spend. Multi-touch attribution has a measurement window — typically 90 to 180 days. It cannot see the podcast sponsorship a CFO heard 14 months ago that planted the brand seed. If you kill brand spend because MTA says it drove zero deals last quarter, you'll watch organic demand crater 9 months later. Use MMM (media-mix modeling) for brand. Use MTA for performance channels. They are different tools for different questions, not substitutes.
Related on PULSE
- What attribution model works for a multi-touch enterprise sales motion?
- How does the 2027 consolidation of analytics tools impact the accuracy of multi-touch attribution in long-cycle deals?
- How do you build a multi-touch attribution dashboard after cookie deprecation in 2027?
- How to set up multi-touch attribution in Google Analytics 4?
- Is multi-touch attribution still worth it in 2027?
- How do you build multi-touch attribution for 18-month B2B enterprise sales cycles?
The Technical Mechanics: How Multi-Touch Attribution Actually Works Under the Hood
Multi-touch attribution (MTA) isn't magic—it's a rules-based or algorithmic system that assigns fractional credit to each marketing touchpoint in a customer's journey. Here's the stripped-down mechanics:
Data collection layer. Every interaction—email open, ad click, webinar registration, demo request—gets timestamped and tied to a unique user ID (usually via cookie, email hash, or CRM contact ID). In 2027, first-party data is the backbone; third-party cookies are effectively dead, so systems rely on server-side tracking, authenticated events (logged-in users), and deterministic matching via platforms like Segment or Snowplow.
Journey stitching. The attribution engine strings these events into a sequence per lead or account. This is where the "multi-touch" part lives: a single deal might have 12 touches across paid search, LinkedIn ads, a sales call, and a case study download. The engine deduplicates and orders them chronologically.
Credit distribution. Each model applies a different weighting formula:
- *Linear*: 1/n credit per touch (e.g., 8.3% for 12 touches)
- *Time-decay*: Exponential weighting toward the last touch (e.g., last touch gets 40%, first gets 5%)
- *U-shaped*: 40% to first touch, 40% to lead conversion touch, 20% split among middle touches
- *W-shaped*: 30% to first, 30% to lead creation, 30% to opportunity creation, 10% to middle touches
- *Full-path*: Evenly splits credit across all milestone touches (first, lead, opportunity, close)
The 2027 reality check. Even the best MTA models have a 10-25% accuracy gap compared to incrementality testing (like geo-holdout experiments or A/B matched-market tests). No model perfectly captures offline influence, brand lift, or word-of-mouth. That's why sophisticated teams layer MTA with marketing mix modeling (MMM) for top-down validation.
The Hidden Pitfalls: Why Your Attribution Data Might Be Misleading
Even with a "correct" model, three systemic issues corrupt attribution reliability in 2027:
1. The cross-device blind spot. A prospect sees your LinkedIn ad on their phone at 8 AM, searches your brand on their work laptop at noon, and fills out a demo form on a tablet at 9 PM. Without unified identity resolution (e.g., via a CDP like mParticle or internal login data), the attribution engine sees three separate users—or misses the LinkedIn touch entirely. This can undercount upper-funnel channels by 15-35%.
2. The dark funnel. 40-60% of B2B purchase influence happens in unmeasurable channels: Slack communities, peer referrals, private LinkedIn DMs, or offline conversations. These touches never hit your attribution system. The result? Your "last-touch" model might overcredit the final demo request while ignoring the Slack recommendation that actually drove the decision.
3. The attribution window trap. Most tools default to a 30-90 day lookback window. But in enterprise SaaS (6-12 month cycles), a prospect might research you for 8 months, then go dark for 4 months before re-engaging. If your window is 90 days, you lose the first 5 months of touches. This inflates the credit of late-stage channels (like sales emails) and deflates early education channels (like blog content or industry events). Best practice: use a 365-day window for enterprise, 180-day for mid-market, and 90-day for PLG/SMB.
How to Stress-Test Your Attribution Model in 30 Days
Don't just pick a model and pray. Run this lightweight validation process:
Week 1: Audit your data hygiene. Export raw touchpoint data from your attribution tool. Check for: (a) >5% of touches with "unknown" source, (b) >10% of deals with only 1-2 touches (likely tracking gaps), (c) any channel getting 0% credit that you know drives pipeline (e.g., trade shows). Fix tracking first—garbage in, garbage out.
Week 2: Run a holdout experiment. In platforms like Google Ads or LinkedIn, create a 5-10% holdout group that sees no paid ads for 30 days. Compare conversion rates between exposed and holdout groups. If your attribution model says paid search drives 30% of conversions but the holdout shows only a 5% drop when ads are removed, your model is overcrediting. Adjust weights accordingly.
Week 3: Cross-reference with customer surveys. Survey 20-30 recently closed-won deals: "What was the first thing that made you aware of us? What was the most influential factor in your decision?" Compare survey responses to your attribution model's top-touch channels. Expect 20-40% mismatch—that's your dark funnel gap. Use this to adjust budget allocation, not the model itself.
Week 4: Lock a single source of truth. Pick one model (the one that best matches your holdout and survey data) and report it consistently to leadership for 90 days. Don't let teams cherry-pick different models to justify their budget. The goal isn't perfect accuracy—it's directional consistency that improves with each iteration.
FAQ
What is multi-touch attribution and why does it matter in 2027? Multi-touch attribution assigns credit to multiple marketing touchpoints along a customer’s journey, rather than giving all credit to the last click. In 2027, with third-party cookies deprecated and privacy regulations tightened, it’s essential for understanding which channels truly drive conversions and for justifying marketing spend to leadership.
Which multi-touch model is best for enterprise B2B SaaS with long sales cycles? W-shaped attribution is recommended for enterprise B2B SaaS with 6-12+ month sales cycles. It credits key interactions like first touch, lead creation, and opportunity creation, giving a balanced view of top-of-funnel and middle-of-funnel efforts. Pair it with an AI-modeled overlay from tools like Dreamdata or HubSpot Marketing Hub Enterprise for more accurate, privacy-compliant insights.
What model works for mid-market B2B SaaS with shorter sales cycles? U-shaped (position-based) attribution is ideal for mid-market companies with 30-90 day cycles. It typically gives 40% credit to the first touch, 40% to the last touch, and splits the remaining 20% among middle interactions. This model highlights both awareness-driving and closing activities without overcomplicating the analysis.
Should PLG or SMB businesses use a different attribution model? Yes, time-decay attribution is best for product-led growth (PLG) and SMB motions. It gives more credit to touchpoints closer to conversion, reflecting the fast, self-serve nature of these sales cycles. This model aligns well with shorter decision timelines and lower-touch customer journeys.
Why is last-touch attribution no longer reliable in 2027? Last-touch attribution has become unreliable due to cookie deprecation and privacy changes, which break the tracking of final clicks across devices and platforms. It also ignores the entire customer journey, leading to skewed insights and misallocated budgets. Most teams have moved to multi-touch models or AI-powered overlays for more accurate reporting.
How do I combine a declared model with an AI-modeled overlay? Use a deterministic model (like W-shaped or U-shaped) based on CRM data to track known touchpoints, then layer an AI-modeled overlay from tools like Bizible/Adobe Marketo Measure or Dreamdata. The AI fills gaps from missing data (e.g., anonymous visits or cross-device interactions) and reports a single, unified number to executives. This hybrid approach balances accuracy with practical implementation.
Sources
- Forrester Wave: Cross-Channel Marketing Hubs 2024
- HubSpot State of Marketing Attribution Benchmarks 2024
- Dreamdata State of B2B Go-To-Market 2024
- Adobe Marketo Measure (Bizible) Product Documentation 2024
- Gartner Magic Quadrant for B2B Marketing Automation Platforms 2024
- Demand Gen Report 2024 Marketing Measurement Survey
- MarTech.org "Attribution after the cookie" 2024
- Google Chrome Privacy Sandbox third-party cookie deprecation timeline 2024
This page will be disappearing soon. Save it to your device for $1 — or read it free while it is here.
@Kory-White- · if Venmo asks, the last 4 of my number are 2012
This page is gone.
This one is off the shelf now. $1 keeps it on your phone for good — the whole page, pictures and diagrams included.
 revopsHow should a 2027 sales org handle compensation impact during a performance improvement plan?
 revopsWhat are Auburn Tigers football's 2027 NIL needs and strategy?
 revopsWhat are Kentucky Wildcats men's basketball's 2027 NIL needs and strategy?
 revopsWhat is lemlist and why is it a hot RevOps multichannel outreach platform for 2027?
 revopsHow do you design sales-assist for a PLG motion in 2027?
 revopsWhat is Cognism and why is it a hot RevOps sales-intelligence platform for 2027?
 revopsHow do you design a sales kickoff that changes behavior in 2027?
 revopsShould 2027 RevOps report to finance or to the CRO?
 revopsWhat capacity-planning models do SaaS sales teams use in 2027?
 revopsHow do you explain a missed quarter to the board in 2027?