
How'd you fix Vanderbilt's NIL & athletic revenue issues in 2026?
 Curated byKory White · Fractional CRO · Maryland
 PULSEKNOWLEDGE LIBRARY
Quality
Certified

Vanderbilt fixed its NIL and athletic revenue issues in 2026 by merging its two collectives into one transparent authority, publishing compensation tiers, funding baseball as its highest-return roster, and layering Nashville corporate matching on top. The result was near-full House cap utilization achieved through efficiency per dollar rather than raw spending volume.
The outcome you should expect
The headline metric is House settlement cap utilization. Under the House v. NCAA settlement, participating schools may share roughly $20.5 million per year directly with athletes, indexed upward over the ten-year term. Vanderbilt entered the 2026 cycle funding an estimated 65% of that allocation — call it $13.3 million against a $20.5 million ceiling, leaving roughly $7 million of unused authorized capacity sitting on the table while SEC rivals fully funded theirs. That gap is not a competitive nuance. It is the single largest addressable revenue-operations problem in the department, because unused cap space is the only form of athlete compensation that is both legally pre-approved and unavailable to be reallocated later. It expires annually.
The realistic outcome of a well-run 2026 fix is closing most of that gap — moving utilization from roughly 65% into the high-80s or low-90s — without a proportional increase in donor asks. That distinction matters enormously. A department that gets to 90% by simply asking its donor base for 40% more money has not fixed anything; it has borrowed against next year's goodwill and will regress the moment a losing season arrives. A department that gets to 90% by eliminating dual-collective overhead, unlocking corporate matching, converting gameday experience into incremental revenue, and reallocating spend toward the sports with the highest return per dollar has built something that survives a 3-9 football season.
The second outcome to expect is a measurable drop in transfer portal churn. Portal exits at a program like Vanderbilt are rarely about a bidding war it lost by a small margin — they are about information asymmetry. An athlete who has no idea what the market pays for their position discovers a number from an agent or a rival staffer, concludes they are being underpaid, and leaves. Publishing internal compensation bands kills that failure mode. It does not stop a genuine outbid, but it removes the far more common surprise departure that costs a program a starter it could have retained for a modest increase.

The third outcome is slower and less quantifiable: a coherent identity in recruiting conversations. Vanderbilt cannot win a pure cash comparison against Tennessee, Texas A&M, or Georgia, and any strategy premised on doing so is a strategy premised on losing. What it can win is a comparison of total lifetime value — compensation plus a degree that clears hiring bars anywhere, plus proximity to a concentrated corporate economy, plus a demonstrated placement record. That pitch only works if the compensation half is transparent and competitive within its tier. Fix the transparency and the academic argument stops being an excuse and starts being a differentiator.
Expect none of this to change win totals in the first year. Revenue operations changes the inputs. Whether the inputs convert depends on coaching, health, and a hundred things a spreadsheet does not touch.
What drives that outcome
Four structural constraints define the problem, and each has a distinct operational lever attached to it. Understanding which constraint you are pulling against prevents the classic error of applying a fundraising solution to what is actually a routing problem.

Constraint one: donor base size. Vanderbilt enrolls roughly 7,000 undergraduates. Tennessee enrolls more than four times that. Alumni-count-driven crowdfunding — the mechanic that powers the largest SEC collectives — simply does not scale here, and no amount of email cadence optimization changes the denominator. The lever is not more donors; it is higher average gift and institutional money. Corporate partnerships, family foundations, and matching programs are the only paths that produce meaningful dollars from a small base.
Constraint two: gameday capacity. FirstBank Stadium seats roughly 40,000, the smallest football venue in the SEC, and the renovation project underway does not fundamentally change that tier. Total gameday revenue is capacity times revenue-per-attendee, and capacity is fixed for years. The only variable is the second term. Departments at comparable venues typically operate in the $45–55 per-attendee range against $85–110 at the largest SEC programs; closing even half that gap on 40,000 seats across six or seven home dates is a seven-figure swing.
Constraint three: collective fragmentation. Two separate collectives — Anchor Impact and Memorial Magic — running parallel operations means duplicated administrative overhead, duplicated donor solicitation, no unified view of where a dollar lands, and athletes receiving inconsistent guidance about their own value. Industry administrative overhead on collective operations commonly runs in the mid-teens as a percentage of contributions; running two of them roughly doubles the fixed portion of that cost against the same donor pool.

Constraint four: allocation mismatch. Spending is distributed by tradition and squeaky-wheel dynamics rather than by return per dollar. Baseball — the program with sustained national championship results under Tim Corbin, a first-round draft pipeline, and genuine national brand equity — has historically received a fraction of the NIL support that a middling football roster spot commands. That is not a moral complaint; it is a portfolio management error.
The consolidation lever deserves the most attention because it is the one that pays before any new money arrives. A single Commodore-side collective authority — one legal entity, one donor dashboard, one compliance ledger — removes the duplicated back office. On a contribution base in the several-millions, collapsing duplicated administration plausibly frees a mid-six-figure sum annually, and that money is already inside the building. No donor has to be asked for anything. That is the cheapest revenue in the entire plan and the reason it belongs in the first ninety days.
Consolidation also fixes the compliance problem, which is the quiet risk in every collective structure. When two entities pay athletes and a third party reconciles it against the cap after the fact, the department is typically two to three weeks behind its own spending. In a regime where exceeding the cap carries real enforcement consequences, running blind for weeks at a time is an unacceptable operational posture. A single ledger with an automated running total against the cap turns a periodic audit into a live dashboard — standard RevOps discipline applied to a department that has never had it.

Benchmarks and realistic ranges
Every number below is a planning range, not a promise, and each should be validated against the department's actual audited financials and the EADA filings before anything is committed.
Cap utilization. Start at roughly 65% of $20.5 million. A realistic first-year target is 85–92%. Getting to a literal 100% in year one is usually a sign someone is booking soft commitments as cash. The last five percentage points of a cap are the hardest, because they represent marginal spend on athletes whose retention value is genuinely uncertain.
Consolidation savings. Dual-collective administrative overhead in the 15–20% range, collapsed to a single entity, plausibly recovers $500,000–900,000 annually on a contribution base of several million. The variance depends entirely on how much of the current overhead is fixed (staff, legal, platform licensing, audit) versus variable (payment processing, event costs). Fixed costs collapse cleanly; variable costs mostly do not.
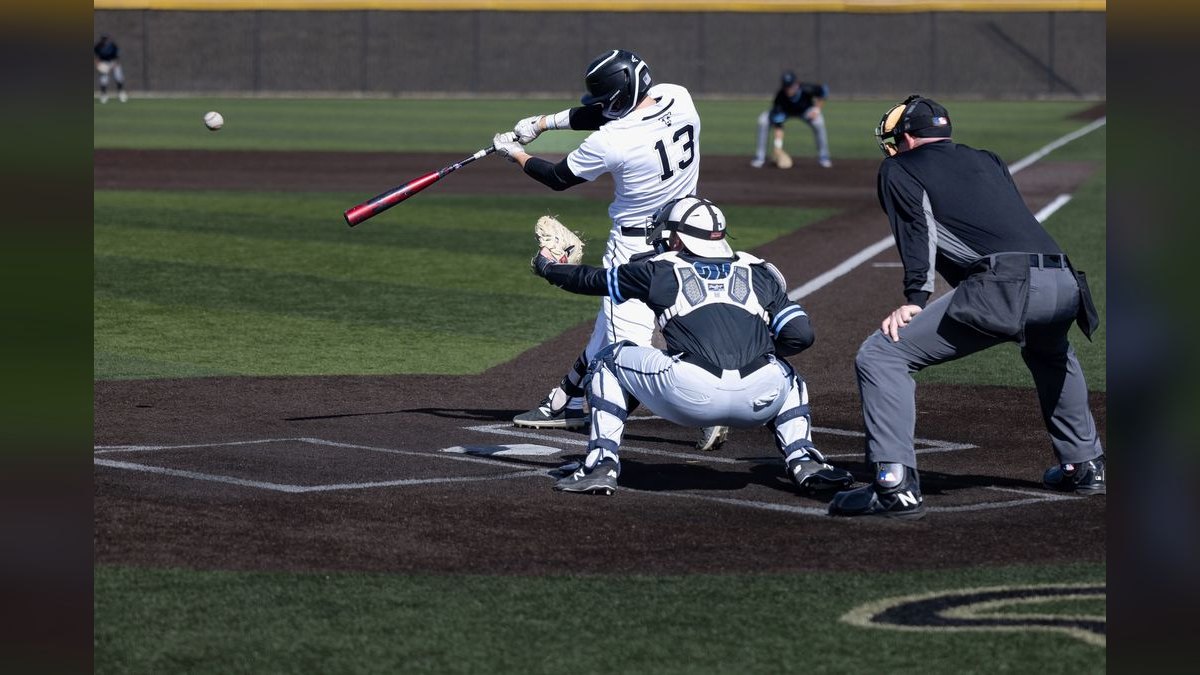
Baseball reallocation. This is where the previous version of this analysis broke its own arithmetic, and the corrected math matters. If baseball's total NIL allocation moves from roughly $200,000–300,000 to a target range of $1.4–2.1 million, that budget cannot fund eight to twelve players at $350,000–600,000 apiece — that would consume $2.8 million at the low end alone. A budget of $1.4–2.1 million realistically supports something like four to six premium arms and bats in the $150,000–250,000 range, consuming roughly $600,000 to $1.5 million, with the remainder spread across fifteen to twenty-five roster spots in the $20,000–60,000 band. Build the roster model bottom-up from actual per-player commitments and confirm the sum before publishing a headline number. A collective that announces a tier it cannot fund creates exactly the trust failure the transparency effort was meant to eliminate.
Corporate matching. Nashville's corporate density is real and it is Vanderbilt's most under-exploited asset. HCA Healthcare is headquartered here and is a genuine Fortune 500 company. Asurion is a large privately held Nashville employer — significant, but not a public-company Fortune 500 name. Bridgestone's Nashville presence is its Americas subsidiary; the parent is a Japanese corporation. Getting these descriptions right is not pedantry: a corporate partnership pitch that misstates a prospective partner's own corporate structure loses the room in the first meeting. The addressable opportunity across healthcare, insurance-tech, manufacturing, and the music and hospitality economy is plausibly $2–3 million annually at maturity, but a first-year target of $500,000–1 million in actually-executed matches is the honest number. Corporate matching programs take two to three quarters to move through legal, HR, and brand review at any large employer.
Gameday revenue per attendee. Moving from a mid-$40s baseline to the mid-$60s across roughly 40,000 seats and six to seven home dates produces something in the $500,000–950,000 range annually. The mechanics are unglamorous: dynamic pricing tied to opponent quality and kickoff window, a modest expansion of club inventory, food-and-beverage mix optimization, and premium parking. None of it requires a new stadium.
Portal retention. Non-revenue and mid-tier roster churn commonly runs 15–20% annually at programs without published compensation bands. Transparency alone does not eliminate churn — an athlete genuinely outbid by seven figures is leaving regardless — but it reliably removes the surprise-departure category. A realistic target is trimming churn by a quarter to a third, which at a 100-plus athlete scholarship population is a meaningful number of retained contributors.
Efficiency ratios worth tracking. NIL spend per scholarship athlete, contribution dollars retained after administrative cost, cap utilization percentage, portal retention rate by sport, and revenue per attendee. Five metrics, reviewed monthly, is a real operating cadence. Twenty metrics reviewed quarterly is a dashboard nobody reads.
Risks, edge cases, and failure modes
Regulatory drift is the largest risk and it is entirely outside the department's control. The House settlement framework, the College Sports Commission's clearinghouse review of third-party NIL deals, state NIL statutes, and ongoing litigation over employment classification are all live and moving. Any structure built on today's rules needs an explicit quarterly review and a designated owner who reads the actual filings rather than the coverage of them. Build the collective's operating agreement with amendment flexibility; a rigid entity structure becomes a liability the moment the rules shift.
Transparency cuts both ways. Publishing compensation bands is the right call, but it is irreversible and it arms everyone. Rival staffers will use published tiers against you in negotiations. Athletes at the bottom of a band will ask why they are not at the top. Agents will anchor to the ceiling of every range. Mitigate by publishing bands rather than individual figures, tying position within a band to explicit and defensible criteria — snap count, availability, academic standing, service commitments — and reviewing bands on a fixed cadence so nothing is renegotiated ad hoc in a hallway.

Corporate matching creates a concentration risk. If HCA, Asurion, and a handful of other partners represent the bulk of the corporate layer and one of them faces a downturn, a leadership change, or a marketing reorganization, a seven-figure line disappears with one phone call. Diversify across at least eight to ten meaningful partners even if it means accepting smaller individual commitments, and structure multi-year agreements with staged renewals rather than coterminous ones.
Compliance exposure in the matching structure specifically. Corporate deals routed to athletes must be genuine commercial arrangements with legitimate business purpose and fair market value compensation, and they are subject to clearinghouse review. A "match" that is functionally a donation laundered through a corporate logo is the exact structure enforcement is designed to catch. Every corporate deal needs documented deliverables, a defensible valuation, and retained records. Route this through outside counsel before the first agreement, not after the first inquiry.
The baseball bet has real downside. Concentrating a larger share of NIL spend on baseball is a defensible portfolio move precisely because Vanderbilt has a durable competitive position there. But it is a bet on sustained coaching continuity and on a sport whose revenue generation, even at championship level, is a fraction of football's. If football's competitive floor drops far enough, gameday revenue, donor sentiment, and media distribution all compress simultaneously, and baseball success will not offset it. The correct framing is that baseball is the highest-return incremental dollar, not that football should be defunded. Protect the football floor first, then optimize.

Overhead savings can evaporate into headcount. Consolidation savings are only savings if they are not immediately consumed by new staff hired to run the consolidated entity. Write the target into the budget as a hard line and report against it monthly.
Donor fatigue from the transition itself. Merging two collectives means telling every donor their relationship is changing. Some percentage will churn simply because their favorite point of contact left or their giving identity was tied to the specific entity. Plan for a 5–10% attrition through the transition, communicate personally with the top fifty donors before any public announcement, and preserve giving designations wherever legally possible.
The measurement trap. Cap utilization is a means, not an end. A department that hits 95% by spending badly is worse off than one at 80% spending well. Pair every utilization report with a retention and performance read, or the metric will drive the exact behavior it was meant to prevent.

A practical rollout plan
Sequence matters more than ambition. Each phase below unlocks the next, and attempting them in parallel produces a consolidation that stalls halfway with donors in both systems and nobody able to answer a compliance question.
Phase one — consolidate, roughly the first quarter. Form the single entity. Migrate every donor record, recurring gift, and pledge schedule into one system, and reconcile the merged ledger against both legacy systems line by line before decommissioning either. Stand up the live cap tracker in the same sprint — this is the deliverable that converts compliance from a lagging audit into a real-time control. Do not announce anything publicly until the top fifty donors have been contacted individually. Success criterion: one dashboard, one ledger, zero donors in a legacy system, and administrative overhead measurably below the combined prior baseline.
Phase two — publish and price, second quarter. Build the compensation band model bottom-up from actual committed dollars, sport by sport, and confirm the sum against the cap before anything is shared. Define the criteria that place an athlete within a band and write them down. Brief coaches before athletes, and athletes before the public. Success criterion: every scholarship athlete can state their band and the criteria that would move them within it.

Phase three — build the new revenue layers, second through fourth quarter. These run in parallel because each has a different external dependency and a different clock. Corporate matching moves at the speed of partner legal review — start conversations in quarter two and expect signatures in quarter three or four. Gameday pricing changes must be modeled before the season ticket renewal window opens, which means the analysis happens well ahead of the announcement. The baseball reallocation should be built as an actual player-by-player commitment model, summed and pressure-tested against the total allocation, before the number is published anywhere.
Phase four — operate, continuously. Monthly reporting on the five core metrics to the athletic director and collective board. Quarterly regulatory review with counsel. An annual reset of the compensation bands against observed market movement. The failure mode here is treating the rollout as a project that ends rather than an operating cadence that persists — this is standard RevOps discipline: build the instrumentation, then actually run the review meeting every month even when the numbers are boring.
One organizational note that determines whether any of this works: someone must own the whole number. Not football's number, not the collective's number, not the ticketing number — the consolidated athlete-compensation-and-revenue number. Fragmented ownership is the root cause of the original problem, and reproducing it inside a consolidated entity would waste the entire effort.
Related questions
Why can't Vanderbilt just raise more money to close the cap gap?
With roughly 7,000 undergraduates, the alumni denominator is a hard constraint. Broad crowdfunding that works at 30,000-student state schools does not scale here. Closing the gap requires higher-average institutional and corporate dollars plus recovered overhead, not more solicitation volume against the same small base.
Is baseball really a better investment than football for Vanderbilt?
Per incremental dollar, likely yes — baseball has durable national standing, a draft pipeline, and lower roster costs. But football generates far more total revenue and drives donor sentiment. The correct read is that baseball is the best marginal dollar, not that football should be underfunded.
Does publishing compensation bands help or hurt in recruiting?
Mostly helps. It eliminates surprise portal departures caused by information asymmetry, which are more common than genuine outbids. The cost is that rivals and agents can anchor to your published ceilings, so publish ranges with defined criteria rather than individual figures.
How does the House settlement cap actually constrain spending?
It sets a ceiling on direct revenue sharing — roughly $20.5 million in the first year, escalating over the settlement term. Vanderbilt's problem was the opposite of a ceiling problem: it was funding well under the limit, leaving authorized capacity unused while rivals fully funded theirs.
What makes Nashville corporate partnerships different from other markets?
Concentrated employer density within minutes of campus across healthcare, insurance-tech, manufacturing, and hospitality, combined with an alumni population working at those employers. That proximity makes executive mentorship and internship components genuinely deliverable rather than aspirational, which is what makes the packages differentiated.
FAQ
What is the single highest-return move in the whole plan? Collective consolidation. It recovers money already inside the building without asking any donor for an additional dollar, and it simultaneously fixes the compliance blind spot created by reconciling two payment streams after the fact. Every other lever depends on having one ledger to measure against, which makes it both the highest-return and the necessary first step.
How long before any of this shows up in results? Financial metrics move within two to three quarters — overhead savings and gameday revenue changes are visible almost immediately. Cap utilization takes a full cycle. Retention effects show up at the next portal window. Competitive results, if they come at all, lag by two to three recruiting classes and depend on far more than revenue operations.
Doesn't corporate matching risk running afoul of NIL rules? It can, if structured carelessly. Deals must reflect genuine commercial arrangements with real deliverables and defensible fair market value, and third-party deals above the reporting threshold face clearinghouse review. A "match" that functions as a routed donation is precisely what enforcement targets. Involve outside counsel before the first agreement, document deliverables, and retain valuation records.
What happens if the regulatory framework changes mid-implementation? Assume it will. Build the entity with amendment flexibility, keep the compensation model parameterized rather than hard-coded to current limits, and assign a named owner for quarterly regulatory review. The structural elements — one ledger, transparent bands, diversified corporate relationships, better gameday economics — retain value under nearly any rule set.
Should other small-enrollment programs copy this approach? The framework transfers; the specifics do not. The transferable pieces are consolidation, transparency, allocating by return per dollar, and monetizing local corporate density. What is not transferable is Nashville's employer concentration and a baseball program with Vanderbilt's national standing. Run the same diagnostic on your own constraints before importing anyone else's answer.
How do you avoid the metric driving bad behavior? Never report cap utilization alone. Pair it with retention rate and a performance read every single month. A department that reaches 90% utilization by spending poorly is worse positioned than one at 80% spending well, and a single-metric dashboard will reliably produce the former.
Sources
- https://www.ncaa.org/ — governing body rules, House settlement implementation, and NIL policy updates
- https://vucommodores.com/ — Vanderbilt athletics department, sport programs, and facilities information
- https://ope.ed.gov/athletics/ — U.S. Department of Education Equity in Athletics Disclosure Act financial database
- https://www.sportsbusinessjournal.com/ — college athletics revenue, media rights, and collective industry analysis
- https://www.espn.com/college-sports/ — reporting on House settlement implementation and conference finances
- https://theathletic.com/ — SEC athletic department finances and NIL competitive dynamics
- https://www.opendorse.com/ — NIL marketplace data and athlete compensation benchmarks
- https://vanderbilthustler.com/ — campus reporting on Vanderbilt athletics and NIL developments
- https://www.knightcommission.org/ — independent research on college athletics finances and governance
Related on PULSE
- How much do Vanderbilt football players earn from NIL in 2027?
- How much do Vanderbilt men's basketball players earn from NIL in 2027?
- What are Vanderbilt Commodores football's 2027 NIL needs and strategy?
- How'd you fix Illinois's NIL & athletic revenue issues in 2026?
- How'd you fix Texas A&M's NIL & athletic revenue issues in 2026?
- How'd you fix Texas's NIL & athletic revenue issues in 2026?
This page will be disappearing soon. Save it to your device for $1 — or read it free while it is here.
@Kory-White- · if Venmo asks, the last 4 of my number are 2012
This page is gone.
This one is off the shelf now. $1 keeps it on your phone for good — the whole page, pictures and diagrams included.
 libraryWhat's the right way to measure a sales kickoff's actual impact on next quarter's results, not just satisfaction scores in 2027?
 libraryHow'd you fix Harris Health's revenue issues in 2026?
 libraryHow'd you fix Oklahoma's NIL & athletic revenue issues in 2026?
 libraryHow'd you fix Ole Miss's NIL & athletic revenue issues in 2026?
 libraryHow do you diagnose whether your churn is a product problem or a customer-success problem in 2027?
 libraryHow'd you fix Heap's revenue issues in 2026?
 libraryHow'd you fix South Carolina's NIL & athletic revenue issues in 2026?
 libraryHow'd you fix LSU's NIL & athletic revenue issues in 2026?
 libraryHow'd you fix Illinois's NIL & athletic revenue issues in 2026?
 libraryHow'd you fix Affirm's revenue issues in 2026?