
What Pipeline Coverage Ratio Should I Target in 2027?
 Curated byKory White · Fractional CRO · Maryland
 PULSEKNOWLEDGE LIBRARY
The right pipeline coverage ratio for 2027 is not the old "3x and you're fine" rule of thumb — it is a number you derive from your own conversion math, then adjust upward for cycle length and economic uncertainty. The defensible formula is: required coverage = 1 ÷ (stage-weighted win rate), applied to open pipeline that can realistically close inside the quarter. A team that converts 25% of qualified pipeline needs roughly 4x coverage; a team converting 33% needs about 3x; a team converting 20% needs 5x. In 2027, with longer cycles and noisier early-stage pipeline, most B2B teams target 3x–4x for next quarter and watch a *forward* coverage curve (this-quarter, next-quarter, two-quarters-out) rather than a single blended number. Coverage is a diagnostic, not a goal: a team that hits quota at 2.5x has a conversion problem worth more than any amount of extra top-of-funnel.
Why the "3x Rule" Is Misleading in 2027
The 3x heuristic assumes a 33% win rate, a relatively short cycle, and pipeline that is honestly qualified. None of those assumptions are safe defaults anymore. With buying committees that Gartner has characterized as routinely exceeding ten stakeholders and cycles frequently running two or three quarters, a deal sitting in "Stage 2" may be 9 months from a decision — counting it the same as a deal in legal review badly distorts coverage. Worse, AI-assisted prospecting in tools like Outreach, Salesloft, and Clay has made it trivial to manufacture top-of-funnel volume, which inflates raw coverage without improving the odds of hitting the number. The result: many teams report healthy 4x coverage and still miss, because most of that pipeline is unqualified or out-of-quarter. Coverage only means something when it is *qualified, stage-weighted, and time-bound*.
How to Calculate Your Real Coverage Target
Work the math from outcomes backward, not from a rule of thumb forward.
- Measure your true win rate by stage, not blended. Pull the last 4–8 quarters of closed deals and compute conversion at each stage transition. A deal in "Proposal" might convert at 55%; a deal in "Discovery" at 18%. These are different and should be weighted differently.
- Define what counts as pipeline. Only opportunities past a hard qualification gate (a confirmed economic buyer, an identified compelling event, a budget signal) should count toward coverage. Everything earlier is "early pipeline" and belongs in a separate forward bucket.
- Set the in-quarter target. Required coverage = 1 ÷ weighted win rate. Multiply your quarterly quota by that number to get the target qualified pipeline.
- Adjust for cycle length. If your average cycle exceeds your quarter, in-quarter coverage matters less than *aging* coverage. Track how much pipeline has been in-stage long enough to plausibly close this quarter.
- Add an uncertainty buffer. In a tightening economy, no-decision and "do nothing" outcomes rise; budgeting an extra 0.5x–1x of coverage absorbs that drag.
Forward Coverage Beats a Single Number
The single most useful upgrade is to stop reporting one coverage ratio and start reporting a coverage curve across multiple future quarters. A team at 4x for this quarter but 1.2x for next quarter is in a worse position than a team at 3x this quarter and 3x next quarter, because the first team is about to fall off a cliff. RevOps should publish a standing view that shows, for each of the next three quarters, the qualified pipeline already created against the quota for that quarter. This turns coverage from a lagging scoreboard into a leading early-warning system that gives marketing and SDR teams two quarters of runway to fix a gap.
Where Coverage Goes Wrong
- Counting unqualified pipeline. If "pipeline" includes every open opportunity regardless of qualification, your ratio is fiction. Gate it.
- Using a blended win rate. Blending early- and late-stage conversion overstates the value of early pipeline.
- Treating coverage as a quota for SDRs. When you reward people for *creating* coverage, they create junk. Reward qualified, stage-progressing pipeline instead.
- Ignoring time. Coverage with no time dimension can't tell you whether pipeline will close this quarter or next year.
- Chasing more coverage when the real problem is conversion. If you miss at 5x coverage, adding a sixth turn won't help; fix discovery, qualification, and velocity.
Tooling
By 2027 most teams maintain coverage views in Salesforce or HubSpot dashboards, often layered with a dedicated revenue-intelligence platform such as Clari or Gong Forecast that can show forward coverage by segment and flag pipeline that has stalled in-stage. Whatever the tool, the discipline is the same: define qualification rigorously, weight by stage, and look forward across quarters rather than at a single blended figure.
How to Calculate Your 2027 Pipeline Coverage Ratio Using Real Conversion Data
The formula above gives you a starting point, but the real work is in gathering accurate conversion data. By 2027, most B2B teams will have shifted from simple stage-to-stage conversion rates to a stage-weighted win rate that accounts for both the probability of each deal stage and the average deal size at that stage. Here's how to build yours:
- Map your stages and historical conversion rates. For each stage in your pipeline (e.g., SQL, Demo, Proposal, Negotiation), calculate the percentage of deals that move to the next stage and ultimately close. If you don't have clean historical data, use a conservative 10-15% conversion between early stages and 30-40% between late stages.
- Assign a probability to each stage. A deal in "Demo" might have a 20% chance of closing, while a deal in "Negotiation" might have 60%. This is your stage probability — not your historical win rate, but your best estimate of how likely a deal at that stage is to close.
- Multiply each deal's value by its stage probability. Sum these across all open deals to get your stage-weighted pipeline value. This is a more honest number than raw pipeline because it discounts early-stage deals that are less likely to close.
- Divide your quota by your stage-weighted pipeline value. This gives you your *real* coverage ratio. For example, if your quota is $1M and your stage-weighted pipeline is $250K, your coverage is 0.25x — dangerously low, even if your raw pipeline shows 3x.
In 2027, with economic uncertainty and longer sales cycles, the stage-weighted approach is essential because it prevents you from being fooled by a bloated top-of-funnel. A team that appears to have 4x coverage in raw terms may only have 1.5x when stage-weighted — a gap that won't close without aggressive acceleration or new pipeline generation.
The Forward Coverage Curve: Why One Number Isn't Enough
The biggest mistake teams make with pipeline coverage is looking at a single ratio for the current quarter. By 2027, the best teams track a forward coverage curve that shows coverage for three consecutive quarters: this quarter, next quarter, and two quarters out. This curve reveals whether you're building pipeline for future quarters or just scraping by.
Here's how to build your forward coverage curve:
- This quarter: Target 3x-4x stage-weighted coverage. If you're below 2x, you have a serious conversion or acceleration problem. If you're above 5x, you may be over-investing in pipeline at the expense of conversion.
- Next quarter: Target 2x-3x stage-weighted coverage. This quarter's pipeline should be generating deals that close next quarter. If your next-quarter coverage is below 1.5x, you're heading for a gap.
- Two quarters out: Target 1x-1.5x stage-weighted coverage. This is your early pipeline — mostly SQLs and early-stage opportunities. It should be growing, not shrinking.
The shape of your curve matters more than any single number. A healthy curve shows coverage declining gradually from this quarter to two quarters out — not a cliff. If your this-quarter coverage is 4x but your next-quarter coverage is 0.5x, you'll hit quota this quarter and miss next quarter by 30-40%. The solution is to generate pipeline now for future quarters, not wait until the current quarter ends.
In 2027, with longer sales cycles (often 6-9 months for enterprise deals), a forward coverage curve is the only way to avoid the "pipeline feast or famine" cycle. Teams that track it can invest in pipeline generation during strong quarters and pull back during weak ones, smoothing out revenue over time.
How to Adjust Your Coverage Target for Deal Size and Sales Cycle Length
Not all pipeline is created equal, and your coverage target should vary by deal size and cycle length. A $10K deal that closes in 30 days needs less coverage than a $500K deal that takes 9 months. Here's how to adjust:
- Small deals (under $25K, cycle under 60 days): Target 2x-3x stage-weighted coverage. These deals move fast, so you can afford thinner coverage. Focus on velocity and volume rather than pipeline depth.
- Mid-market deals ($25K-$150K, cycle 60-120 days): Target 3x-4x stage-weighted coverage. These deals are the sweet spot for most B2B teams. They require a healthy pipeline but don't need the massive coverage of enterprise deals.
- Enterprise deals ($150K+, cycle 6-12 months): Target 5x-7x stage-weighted coverage. These deals are unpredictable and often get stuck in late stages. You need a deep bench of opportunities to account for the high variability in close rates.
- Strategic deals ($500K+, cycle 12+ months): Target 8x-10x stage-weighted coverage. These deals are rare and high-risk. You need multiple opportunities in the pipeline to ensure at least one closes within the target quarter.
In 2027, with longer enterprise cycles and more budget scrutiny, the biggest mistake is treating all deals the same. A team with a $2M quota that's 80% enterprise deals needs 5x-7x coverage on that portion, while the remaining 20% in mid-market can run at 3x. If you blend them into a single 3x target, you'll under-cover your enterprise deals and over-cover your mid-market ones, leading to missed quota.
To apply this: segment your pipeline by deal size and cycle length, calculate a stage-weighted coverage ratio for each segment, and set separate targets. Then aggregate them into a blended target that reflects your actual deal mix. For most B2B teams in 2027, this blended target will land between 3.5x and 5x — higher than the old 3x rule, but realistic for the current economic environment.
FAQ
What is the difference between pipeline coverage and pipeline velocity? Pipeline coverage measures the volume of qualified deals relative to your quota, while velocity tracks how quickly those deals move through stages. In 2027, both matter: coverage ensures you have enough opportunities, but velocity determines if they close in time. A high coverage ratio with slow velocity often signals pipeline that is too early or poorly qualified.
Should I include early-stage leads in my pipeline coverage calculation? No, only include deals that have a realistic chance of closing within the quarter. Early-stage leads inflate coverage without improving predictability. For 2027, focus on stage-weighted pipeline—where each deal is discounted by its historical win rate per stage—to avoid a false sense of security.
How often should I recalculate my target coverage ratio? Recalculate quarterly, or whenever your win rates shift by more than 5 percentage points. In 2027, market conditions and sales processes evolve quickly, so a static target can mislead. A team that sees win rates drop from 30% to 25% needs to adjust coverage from roughly 3.3x to 4x.
What if my team consistently hits quota at a lower coverage ratio, like 2.5x? That suggests your pipeline is exceptionally high-quality or your conversion rates are stronger than average. It’s not necessarily a problem, but it warrants investigation: low coverage with high win rates can indicate you’re leaving revenue on the table by not pursuing enough deals. In 2027, a 2.5x ratio is a signal to examine whether you can sustainably scale without more pipeline.
How does economic uncertainty in 2027 affect the ideal coverage ratio? Uncertainty tends to lengthen sales cycles and lower win rates, so you should target the higher end of the 3x–5x range. For example, if your typical win rate drops from 30% to 20% due to budget freezes or longer approvals, required coverage jumps from 3.3x to 5x. Build in a 10–20% buffer above your calculated number.
Can I use the same coverage ratio for all sales segments (e.g., SMB, mid-market, enterprise)? No, each segment typically has different win rates and cycle lengths. Enterprise deals often convert at lower rates (15–25%) and take longer, requiring higher coverage (4x–6x). SMB might convert at 30–40% and need only 2.5x–3.5x. In 2027, segment-specific targets are essential for accurate forecasting.
Sources
- Gartner, B2B Buying Journey research on buying-group size and complexity (gartner.com).
- Salesforce, State of Sales reports on pipeline and win-rate benchmarks (salesforce.com).
- HubSpot Sales Benchmarks and pipeline reporting guidance (hubspot.com).
- Clari, resources on pipeline coverage and forecasting discipline (clari.com).
- Gong Labs, published analyses of deal conversion and win-rate drivers (gong.io).
Related on PULSE
- Should I Hire a Fractional CRO If My Board Added a New Revenue Target Mid-Year?
- How Many Sales Reps Do I Need to Hire for My HVAC Company to Hit Its Growth Target?
- How do you coach reps on multithreading into target accounts?
- How do you prevent duplicate outreach when your team and Palantir field teams target the same agency?
- What's the right CAC payback target — 12, 18, 24 months?
- How does Salesloft hit its 2027 revenue target post-Vista?
This page will be disappearing soon. Save it to your device for $1 — or read it free while it is here.
@Kory-White- · if Venmo asks, the last 4 of my number are 2012
This page is gone.
This one is off the shelf now. $1 keeps it on your phone for good — the whole page, pictures and diagrams included.
 revopsAre longer sales cycles in 2027 forcing RevOps to redefine the 'MQL-to-revenue' attribution model?
 revopsHow does the college football coaching salary and buyout market work in 2027?
 revopsHow can RevOps use AI in the funnel to identify stalled deals before the buying committee loses interest in 2027?
 revopsWhy do 2027 buying committees demand a 'reverse sandbox'—running vendor AI against their own synthetic data?
 revopsWhat's the role of customer success in revenue expansion for 2027 B2B SaaS?
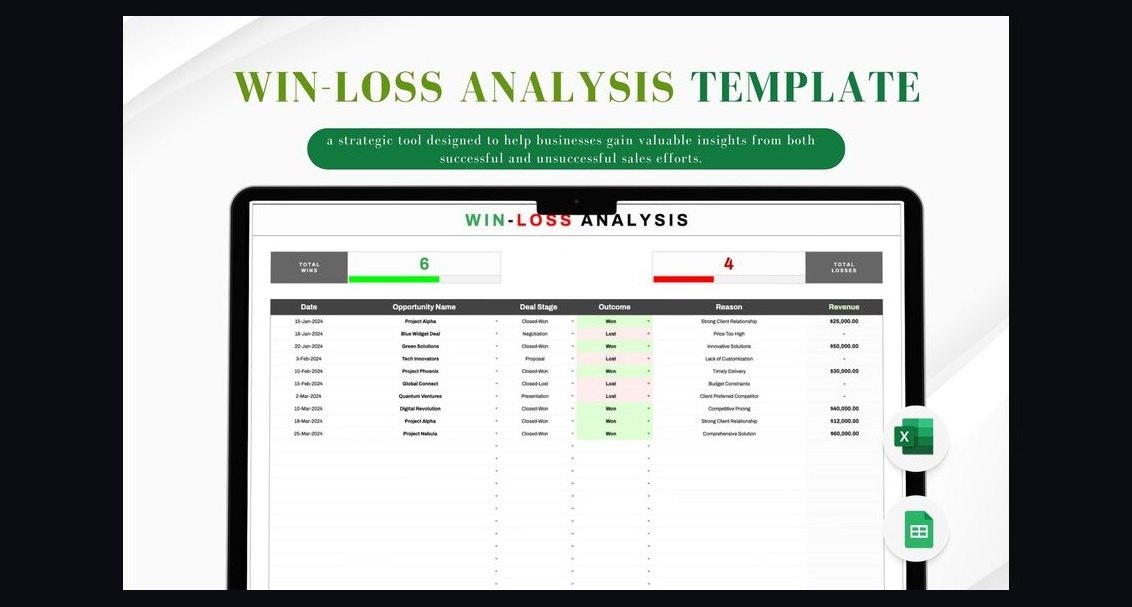 revopsHow Do I Run a Win/Loss Analysis Program That Improves Win Rate in 2027?
 revopsWhich AI in the funnel features are buying committees in 2027 treating as non-negotiable?
 revopsHow Do I Build a Board-Ready GTM Efficiency Dashboard in 2027?
 revopsWhat role does AI play in reducing vendor bloat for enterprise GTM stacks in 2027?
 revopsHow do you rebuild a sales team's trust in the forecast after a mid-year quota reset in 2027?