
What's the right pricing-governance model for a founder-led company in a highly competitive vertical where rigid discount authority could kill deal velocity?
 Curated by Kory White · Fractional CRO, CRO Syndicate
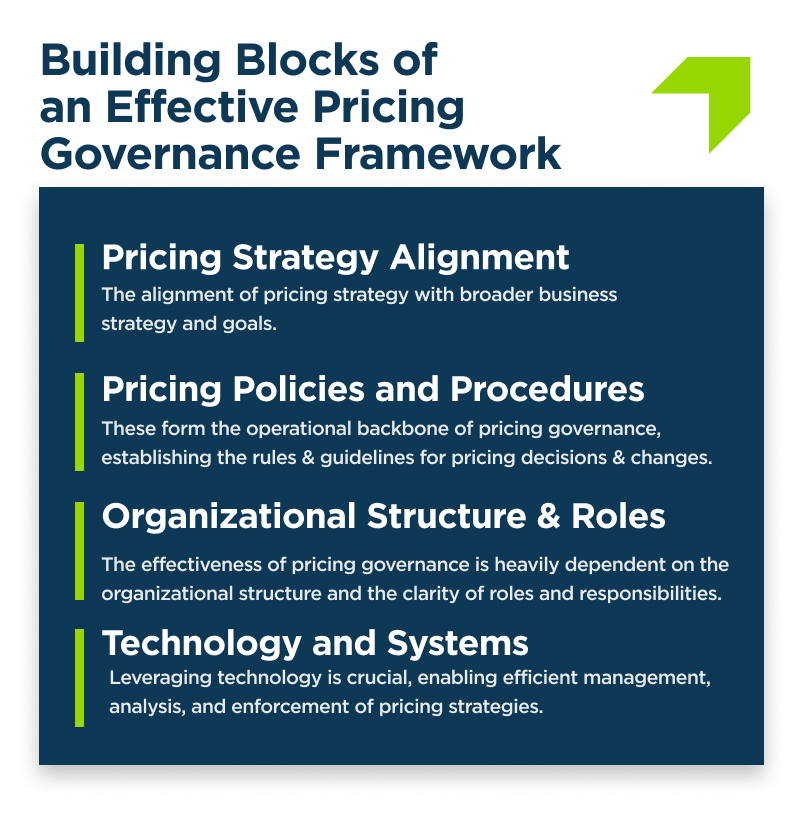
The Core Tension: Control Versus Velocity Is a False Binary

Every founder-led company in a competitive vertical eventually hits the same wall. Sales is closing deals, but the founder feels the discounts creeping — 20% here, 28% there, a 35% "strategic logo" exception that becomes the new floor. The instinct is to clamp down: route every discount over 10% through the founder, demand a written justification, sit in the deal review.
Within a quarter, three things happen. First, cycle time balloons — what was a 21-day sales cycle is now 30-plus because deals sit in an approval queue waiting for the founder to surface between board prep and a product review. Second, reps adapt by anchoring low — if they know the founder will haggle them down anyway, they open the customer conversation at the deepest number they think they can defend, which structurally *increases* average discount.
Third, the founder becomes the bottleneck for the single most important metric in the company: revenue velocity. The competitor down the street, who empowered their reps with a clean 15% instant-grant band, is sending contracts while your rep is still waiting on a Slack reply.
The error is treating pricing governance as a dial between "tight" and "loose." It is not a dial. It is an architecture. A well-built pricing-governance model is simultaneously *tighter* than the chaos founders fear (because the floors are hard-coded and unbreachable) and *faster* than the bottleneck founders create (because 80-90% of deals never touch a human approver).
The founder who understands this stops asking "how much discount authority do I give away?" and starts asking "where do I draw the bands, how fast does each band clear, and what do I review in aggregate?" That reframe is the entire game. In a competitive vertical — where a buyer has three credible alternatives and a procurement team trained to extract concessions — velocity is a feature of the product.
A governance model that adds days to the cycle is a competitive disadvantage you are inflicting on yourself.
What "Pricing Governance" Actually Means — A Working Definition
Pricing governance is the system of rules, roles, tools, and review cadences that determines who can offer what price, under what conditions, how fast, and with what visibility. It has four components, and founders who struggle usually have one or two and assume that is the whole system.
The first component is the price architecture: the list price, the published discount logic, the floor (the lowest price the company will ever accept), and the structural levers — term length, payment terms, volume tiers, ramp deals, multi-year. The second is authority and approval: who can sign off on what, expressed as bands or thresholds, and the SLA on each.
The third is enforcement tooling: the CPQ system, quote approval flows, and guardrails that make it *impossible* to send a quote below floor rather than merely *against policy*. The fourth is the review and feedback loop: the aggregate dashboards, the monthly or quarterly pricing council, and the mechanism by which what you learn from the field updates the architecture.
The reason founders fixate on component two — approval authority — is that it feels like control. But authority without architecture is just gatekeeping, and authority without tooling is just hope. The companies that get this right invest most heavily in components one, three, and four, and treat component two as a *thin* layer: a small number of clean bands with fast SLAs.
They govern by designing the system so that the easy path is also the disciplined path, rather than by inspecting every transaction. A useful test: if your pricing governance disappeared for a week — no founder approvals, no deal desk — how far below floor would deals actually go?
If the answer is "not far, because CPQ won't let them," you have real governance. If the answer is "anywhere, the floor is just a number in a deck," you have gatekeeping dressed up as governance, and the founder is the only thing standing between the company and margin collapse. That is fragile, and it does not scale past the founder's calendar.
Why Founder-Led Companies Specifically Get This Wrong
Founder-led companies have a distinctive failure pattern, and it is worth naming because the fix depends on the diagnosis. Founders are, almost by definition, the person with the best pricing instincts in the building in the early days — they set the original price, they closed the first 20 customers, they have the deepest feel for what the market will bear.
That competence is exactly what makes the trap so sticky. The founder is genuinely *better* at pricing decisions than a brand-new AE, so routing deals through the founder produces locally better outcomes on each individual deal. The problem is that it produces globally worse outcomes for the system: it caps deal throughput at the founder's available attention, it prevents the sales org from ever developing pricing judgment of its own, and it creates a brittle dependency that will break violently the moment the company tries to scale past it.
There is also an emotional layer. For a founder, price is identity. The price is a statement about how much the company believes it is worth, and every discount can feel like a small concession that the product is *not* worth what the founder claimed.
So founders over-index on protecting the headline number and under-index on the thing that actually compounds: a sales motion that closes fast, predictably, and with disciplined-but-not-rigid pricing. The reframe that unlocks the founder is this: **your job is not to win every pricing micro-negotiation.
Your job is to build a pricing system that wins without you.** The founder should own the price list, the floors, the structural levers, and the monthly aggregate review. The founder should *not* be in the per-deal approval path past, roughly, Series A. The companies that scale cleanly are the ones where the founder made this handoff deliberately and early — usually by hiring or designating a deal-desk owner, building the band architecture, and then *physically removing themselves* from the Yellow Band approval flow so the system is forced to function without them.
The Three-Band Architecture: The Default Model
The workhorse model for a founder-led company in a competitive vertical is a three-band discount architecture, and it works because it matches approval friction to actual risk. The Green Band covers roughly 0-15% off list. Any rep can grant it instantly, in the quote, with zero approval.
This band exists because in a competitive vertical, a 10-12% concession is table stakes — procurement expects it, and forcing a rep to get approval for a routine, low-risk discount is pure cycle-time tax with no margin benefit. The Green Band is where 60-75% of your deals should land.
The Yellow Band covers roughly 15-30%. This clears through a single approver — a sales manager, a deal-desk analyst, or an automated rules engine — with a hard SLA of 4 working hours or faster. Yellow Band deals need a second set of eyes because the discount is now material, but they do *not* need the founder, and they absolutely cannot sit for days.
The Red Band covers 30%+, plus any deal that breaches a non-discount term (non-standard payment terms, unusual liability language, a floor-pricing exception). Red Band requires founder/CRO sign-off, and critically, Red Band volume should be capped — target less than 8-12% of total deal volume landing here.
If 30% of your deals are Red, your list price is wrong, your bands are wrong, or your reps have learned that Red is where deals "really" get priced.
The bands are not arbitrary. The Green ceiling should be set at "the discount we are completely comfortable giving away to anyone who asks, because the deal is still healthily profitable and the speed is worth more than the points." The Red floor is set at "the point past which we are making a genuine strategic bet — a logo, a beachhead, a competitive displacement — and a senior person should consciously own that bet." The Yellow band in between is the negotiation zone, where most of the actual selling happens, governed but not bottlenecked.
The exact percentages flex by vertical: a high-gross-margin software product in a brutal competitive vertical might run Green to 20%; a lower-margin or more differentiated product might run Green to 10%. But the *structure* — three bands, friction matched to risk, a hard cap on the top band, fast SLAs on the middle band — is remarkably durable across companies.
Setting the Floor: The One Number the Founder Must Own Personally
If the founder delegates everything else in pricing governance, the floor is the one number that should stay founder-owned, reviewed personally, and changed deliberately. The floor is the absolute lowest price the company will accept for a given product or segment — the line below which a deal is destroying value rather than creating it.
It is not the same as the Red Band threshold; the Red Band is where *approval* gets serious, but the floor is where the *answer becomes no*. The floor should be derived from real economics: gross margin after cost-to-serve, blended CAC payback, the price point below which the deal sets a reference-price problem for the rest of the book.
In a competitive vertical, the temptation is to let the floor drift down deal by deal — "this one logo is worth it" — until the floor is fiction and every deal renegotiates it. The discipline is to make the floor a hard guardrail in CPQ: the system will not generate a quote below floor, full stop, regardless of who is asking.
Exceptions to the floor itself are a separate, rare, founder-only process — measured in single-digit deals per quarter, each individually justified, each logged.
Owning the floor personally does two things for the founder. First, it gives the founder the *one* meaningful control point in the system — the founder is not approving 200 deals a quarter, but the founder absolutely owns the line that protects unit economics. Second, it lets the founder delegate everything above the floor with confidence, because the worst-case outcome is bounded.
A rep with Green Band authority and a Yellow Band that clears in four hours cannot do catastrophic damage if the floor is hard-coded and unbreachable. The founder has effectively said: "I trust the system between list and floor; I personally own the floor itself." That is a clean, defensible division of labor, and it is the structural move that lets a founder stop being the bottleneck without feeling like they have lost control of the thing that matters most.
Discount Authority: How to Actually Set the Thresholds
Setting the band thresholds is part analysis, part judgment. Start with the data you have: pull the last 12 months of closed-won deals, plot the discount distribution, and find the natural break points. Most companies discover a cluster of deals at 0-12% (the "just asked and we said yes" deals), a fat middle from 12-28% (real negotiation), and a tail past 28-30% (the exceptions, the competitive knife-fights, the strategic logos).
Your bands should roughly trace those clusters, because the goal is for the *common* case to be the *frictionless* case. If 65% of your historical deals closed at 14% or less, set Green at 15% and you have just removed approval friction from two-thirds of your pipeline overnight. Then layer in the economics: where does gross margin get uncomfortable, where does CAC payback stretch past your tolerance, where does a deal start to poison reference pricing.
Those economic lines tell you where Yellow should end and Red should begin.
The judgment part is about your competitive context and your sales team's maturity. In a vertical with three aggressive competitors and procurement-led buying, you want a *wider* Green Band — speed is the weapon, and a rep who can say "yes, 15%, done, here's the contract" while the competitor's rep is waiting on approval wins deals on velocity alone.
With a junior, fast-growing sales team, you might want a *narrower* Green and a well-staffed Yellow, because the deal desk is also a coaching mechanism — every Yellow approval is a teachable moment. The thresholds are not permanent; they are a hypothesis you test. Review them quarterly against the aggregate data.
If Green Band deals are winning at a healthy clip and margin is holding, consider widening Green to take even more friction out. If Red Band volume is creeping past 12%, something upstream is broken and you tighten or re-architect. The thresholds should breathe with the business, but they should change *deliberately, in the pricing council, with data* — never deal by deal under pressure.
The Deal Desk: When to Build It, How to Staff It, What It Owns
The deal desk is the operational heart of pricing governance once a company is past the earliest stage, and founders consistently build it too late. The rough timing: by $3-5M ARR, you need at least a *part-time* deal-desk function — often a RevOps person or a sales-ops analyst who owns quote approvals, maintains the CPQ rules, and runs the discount dashboard as a slice of their role.
By $15-20M ARR, you need a *dedicated, full-time* deal desk, and frequently a small team — a deal-desk lead plus one or two analysts — especially if you sell into mid-market or enterprise where deals carry non-standard terms, custom contracts, and multi-product configurations.
The deal desk is not "the people who say no." A well-run deal desk is the velocity function: their job is to get good deals to "yes" *faster*, to be the single point of accountability for the Yellow Band SLA, and to be the institutional memory for "what have we done before, what is precedented, what is genuinely novel."
What the deal desk owns: the Yellow Band approval queue and its SLA; the CPQ rule set and guardrails; the discount and ASP dashboards; the precedent library (so the tenth "we need net-60 terms" request is handled in minutes, not escalated); and the structural-deal expertise — ramps, multi-year, usage commitments, the non-price levers that close deals without cutting price.
Critically, the deal desk also owns the escalation packaging: when a deal genuinely needs founder/CRO sign-off, the deal desk presents it cleanly — here is the ask, here is the economics, here is the precedent, here is the recommendation — so the founder can decide in five minutes instead of reconstructing the deal from a Slack thread.
A good deal desk *reduces* the founder's time in pricing, because it filters, packages, and resolves everything that does not truly need the founder. Founders who resist building the deal desk because it "feels like overhead" are misreading it: the deal desk is the mechanism that *buys back the founder's calendar* while making the governance tighter, not looser.
Tooling: CPQ, Guardrails, and Making the Right Path the Easy Path
Pricing governance that lives in a slide deck or a tribal-knowledge "ask before you discount" norm is not governance — it is a suggestion. Real governance is encoded in tooling, and the core tool is CPQ (Configure-Price-Quote). The CPQ system is where the bands become *real*: the price list is locked, the floor is a hard guardrail the system will not breach, the Green Band is grantable in-quote with no workflow, the Yellow Band auto-routes to the deal-desk queue with the SLA clock running, and the Red Band auto-escalates with the economics pre-packaged.
The options range from Salesforce CPQ (powerful, heavy, expensive to maintain — and Salesforce has signaled it is steering customers toward its newer Revenue Cloud), to modern alternatives like DealHub, Subskribe, Dealhub, Nue, and Salesbricks, to — for an early-stage company — a well-built native Salesforce flow with approval processes and validation rules.
The specific tool matters less than the principle: the system should make sending a below-floor quote impossible, and make sending a Green Band quote effortless.
The deepest tooling principle is *make the right path the easy path*. If granting a 12% Green discount requires three clicks and zero waiting, while a 25% Yellow discount requires a justification field and a four-hour wait, you have used friction as a design tool — the rep is gently steered toward discipline because discipline is also the path of least resistance.
If, instead, every discount feels equally hard, reps learn to "batch" their asks at the deepest number to minimize the friction tax, and your average discount goes *up*. Tooling also creates the data exhaust that powers the review loop: every quote, every discount, every approval, every cycle time, automatically captured.
You cannot run an aggregate pricing review if your discount data lives in PDFs and email. The CPQ system is simultaneously the enforcement layer and the instrumentation layer, which is why getting it stood up — even in a lightweight form — is one of the highest-leverage RevOps investments a founder-led company makes.
Underinvesting here means the founder is *back* in the per-deal path, because there is no system to delegate to.
The Approval SLA: Governing Speed as a First-Class Metric
Most pricing-governance conversations focus on *thresholds* and ignore *speed*, which is exactly backwards for a competitive vertical. The single most important governance metric for a founder-led company fighting for deals is the approval SLA: how long, from the moment a rep submits a discount request, until they get an answer.
This number should be *published, measured, and defended* with the same rigor as a support SLA. Concrete targets: median approval cycle time under 4-6 hours, 90th percentile under one business day, and an absolute ceiling — no discount request sits longer than 24 working hours without resolution.
If your approval SLA is "whenever the founder gets to it," you do not have a governance model, you have a lottery, and your reps are managing a customer relationship while genuinely not knowing if they can deliver the price they implied.
Treating speed as a first-class metric changes design decisions. It means the Yellow Band approver cannot be a single busy executive — it has to be a role (deal desk) or a rule (automated logic) with redundancy and a clear escalation path. It means the Red Band, where the founder genuinely is in the loop, needs a *standing slot* — a daily 15-minute deal-desk-to-founder sync, or a Slack channel the founder commits to clearing twice a day — so even the highest-touch band has a predictable rhythm.
It means you instrument approval cycle time and put it on the same dashboard as discount depth, because a model that holds discounts at 14% but takes three days to approve them is *losing deals* to a competitor running 18% discounts approved in an hour. In a competitive vertical, the buyer's perception of your company's *ease of doing business* is part of the product, and a slow, opaque approval process is a defect in that product.
Govern the speed, publish the SLA, and make missing it as visible as missing a revenue number.
Comp Design: Aligning the Field With the Pricing System
You cannot govern pricing through approval workflows alone if the compensation plan rewards the opposite behavior. If reps are paid purely on bookings — top-line ARR closed — then every discount is free to the rep and expensive to the company; the rep's rational move is to discount as deeply as the system allows to close faster and bigger.
The fix is to put a portion of comp on the *net* outcome. The two common mechanisms: a discount-adjusted commission rate (the commission percentage steps down as discount depth increases — a deal closed at list pays a richer rate than a deal closed at 30% off), or an ASP/net-price component in the quota or the accelerator structure.
Either way, the principle is that the rep must *internalize* some of the cost of discounting, so that price discipline becomes a self-interested behavior rather than a fight the rep has with the deal desk.
The calibration here is delicate, and founder-led companies often overcorrect. If you punish discounting too hard, reps will walk from winnable competitive deals or sandbag, and in a competitive vertical that is a real cost. The goal is not zero discounting — it is *thoughtful* discounting, where the rep weighs the give-up against their own comp and the deal's strategic value.
A practical structure: keep the base commission healthy on anything in the Green Band (you *want* fast Green deals), introduce a modest commission haircut in the Yellow Band that scales with depth, and for Red Band deals, often make the commission rate explicitly a case-by-case conversation tied to the strategic rationale.
Layer in *positive* incentives too: a multi-year deal, an annual-prepay deal, or a deal closed at or above target ASP can carry an *accelerator*, so the rep is pulled toward the structural levers (term, prepay, volume) that protect price instead of just pushed away from discounting.
Comp design is the part of pricing governance that operates *between* deal reviews — it shapes the thousand small decisions reps make before a quote ever hits the deal desk. Founders who ignore it find themselves fighting the comp plan in every approval.
The Aggregate Review: What the Founder Should Actually Inspect
Once the founder steps out of the per-deal approval path, the question becomes: what *does* the founder review, and how often? The answer is the aggregate, on a monthly cadence, in a standing pricing council. The core dashboard the founder should inspect: average selling price (ASP) and its trend — is price eroding, holding, or expanding; discount depth distribution — what percentage of deals and ARR landed in Green, Yellow, Red, and how is that mix moving; discount depth by segment — are SMB deals and enterprise deals discounting differently than they should, is one geography or one product line bleeding; win rate by band — does deeper discounting actually buy higher win rates, or are you giving away margin for deals you would have won anyway; approval cycle time — median and 90th percentile, with misses flagged; and discount leakage — the estimate of deals that landed in Yellow or Red that a tighter offer would have closed regardless.
The win-rate-by-band metric is the most underrated and the most clarifying. The whole emotional justification for deep discounting is "we had to, to win." The data frequently says otherwise: win rates often plateau — a 25% discount wins at roughly the same rate as a 15% discount, meaning the extra 10 points were pure margin given away for nothing.
When the founder can *see* that in the aggregate, the conversation shifts from "should reps be allowed to discount" to "where exactly is the discounting buying us nothing, and how do we tighten *there* specifically." That is governance by evidence rather than governance by anxiety.
The monthly review is also where the *architecture* gets updated: bands adjusted, floors revisited, comp accelerators retuned, CPQ rules amended. The founder's role in steady state is to chair this review, to own the floor, to make the deliberate architecture changes — and to stay completely out of the daily approval queue.
That is the whole job, and it is a far higher-leverage use of a founder's pricing instinct than haggling individual deals.
Stage-by-Stage Evolution: Pre-Seed Through Scale
Pricing governance is not a fixed system; it evolves with the company, and matching the model to the stage is half the battle. Pre-seed / Seed (under ~$1M ARR): there is no system, and that is correct — the founder *is* the pricing engine, closing deals personally, deliberately running pricing experiments, learning what the market bears.
The only governance artifact that matters here is a *written record* of what was sold at what price, because that data becomes the foundation for the band architecture. Do not over-build governance before you have product-market fit on price. Series A (~$1-5M ARR): the founder is hiring the first few reps and *must* now build the first real architecture — a published price list, a first cut at the three bands, a hard floor in whatever quoting tool exists, and a part-time deal-desk owner (usually the first RevOps hire or a sales-ops analyst).
This is the critical handoff stage; the founder who does not build the architecture here will be the bottleneck by Series B.
Series B (~$5-20M ARR): the deal desk goes full-time, CPQ gets stood up properly, the comp plan gets its net-price component, and the founder *physically exits* the Yellow Band approval path — staying only on Red and on the monthly aggregate review. The pricing council becomes a formal standing meeting.
Segmentation deepens: SMB, mid-market, and enterprise likely need different bands. Series C and beyond (~$20M+ ARR): governance gets sophisticated — multiple product lines, geography-specific pricing, partner and channel pricing, a dedicated pricing or monetization function that may be separate from the deal desk, and the founder/CRO involvement narrows to genuine strategic exceptions and the quarterly architecture review.
Across all stages the through-line is the same: the *floor* discipline tightens as the data matures, and the *approval friction* on routine deals gets *lighter*, not heavier, because the system can be trusted more. The common failure is a company whose governance model is two stages behind its revenue — a $30M company still routing deals through a founder, or a $2M company drowning in a five-tier approval matrix it copied from an enterprise playbook.
Match the model to the stage.
Scenario One: The Series A Founder Who Is the Bottleneck
Consider a Series A vertical-SaaS company at roughly $4M ARR, eight reps, selling into a vertical with three well-funded competitors and procurement-savvy buyers. The founder, who personally closed the first 30 customers, requires approval on every discount over 10%. The symptoms are textbook: the sales cycle has stretched from 24 to 34 days, and exit interviews from two departed reps both cite "couldn't get pricing answers fast enough to keep deals warm." The discount data, when finally pulled, shows the average discount is *21%* — *higher* than the competitor benchmark — because reps, knowing every meaningful discount goes through the founder anyway, have learned to open negotiations at 25% to leave room.
The founder's per-deal control has produced *deeper* discounts and *slower* deals: the worst of both worlds.
The fix is the three-band architecture, installed deliberately over one quarter. Green Band set at 15% based on the historical data (62% of deals had closed at 14% or under). A part-time deal desk stood up — the RevOps hire takes the Yellow Band (15-30%) with a four-hour SLA.
The founder keeps Red (30%+) but the deal desk packages every Red escalation cleanly. The CPQ floor is hard-coded. Within two quarters: the sales cycle drops back toward 26 days, the average discount falls to *15%* (because reps now anchor at the Green ceiling, not at a defensive 25%), and the founder's pricing time drops from roughly 8 hours a week to under 90 minutes — a daily 15-minute Red review plus the monthly council.
The lesson: the founder's control was *causing* the problems it was meant to prevent. Architecture beat gatekeeping.
Scenario Two: The Competitive Knife-Fight Vertical
A second company sells observability tooling — a vertical with at least five credible competitors, aggressive incumbent discounting, and buyers who routinely run formal bake-offs. Here the temptation is the opposite failure: governance so loose that "whatever it takes to win" becomes policy, and the average discount drifts toward 35% as reps treat the price list as fiction.
The founder, watching gross margin compress, is tempted to clamp down with a hard 15% cap requiring approval above. That would be a mistake in *this* vertical — a hard 15% cap in a knife-fight vertical means walking from winnable competitive deals, and the competitors know it.
The right model here is a *wider* Green Band — say 20% — combined with *ruthless instrumentation* and *structural lever discipline*. The deal desk's mandate is reframed: not "minimize discount" but "win the deal at the best achievable structure." Reps are trained and comped to reach for the non-price levers first — a longer term, an annual prepay, a usage commitment, a case-study clause — so a deal that *looks* like a 30% discount becomes a 20% discount plus a three-year term plus a prepay accelerator.
The Red Band (30%+) is genuinely founder-owned and *capped* at 10% of volume, and every Red deal must have an explicit strategic rationale logged — competitive displacement of a named incumbent, a marquee logo, a new-segment beachhead — not just "the customer pushed hard." Within a year the average discount lands around 19%, win rate is *flat* (proving the old deep discounts bought nothing), and multi-year mix has doubled.
The lesson: in the most competitive verticals, the answer is not tighter *or* looser — it is a wider fast band, harder floors, and a deal desk that competes on *structure*, not just price.
Scenario Three: The Post-Founder-CEO Transition
A third scenario: a company at roughly $40M ARR that has just hired a professional CRO, with the founder moving to a chairman-and-product role. The pricing-governance system was never properly built — the founder had been the approval path the entire way up, holding it together through sheer bandwidth and instinct.
Now the founder is stepping back, and the system has a founder-shaped hole in it. Deals start sitting. The new CRO inherits a sales org that has *never developed pricing judgment*, because every meaningful decision went through the founder for a decade.
The remediation is a six-month rebuild. First, extract the founder's tacit pricing logic into explicit rules — the bands, the floors, the precedents — through a series of working sessions before the founder fully disengages. Second, stand up a real deal desk and CPQ system, which the company had under-invested in because the founder was the system.
Third, deliberately *develop* pricing judgment in the sales managers — every Yellow approval becomes a coached decision, with the rationale documented, so the org builds the muscle it never had. Fourth, install the monthly pricing council with the CRO as chair and the founder as an advisory participant for the first two quarters, then fully handed off.
The lesson: a founder who *was* the governance system leaves a fragile company. The healthiest version of this story is the founder who saw it coming at Series B, built the architecture *while still in the seat*, and made the system robust to their own departure years before it happened.
Governance you can hand off is the only governance that survives a founder transition.
Scenario Four: The Over-Engineered Enterprise Matrix
A fourth pattern: a $6M ARR company whose VP of Sales arrived from a $2B enterprise org and imported that company's pricing-governance model wholesale — a five-tier approval matrix, discount approval requiring sign-off from sales management, finance, *and* a pricing committee, mandatory deal-review meetings for anything over 12%, and a CPQ configuration so baroque that reps need a 20-page guide.
The intent was control. The effect is paralysis: cycle time is the worst in the competitive set, reps spend more time in approval workflows than with customers, and the best two reps are interviewing elsewhere because "I can't actually sell here."
The fix is *subtraction*. Collapse five tiers to three bands. Remove finance and the pricing committee from the per-deal path entirely — they belong in the monthly aggregate review, not the daily queue.
Kill the mandatory deal-review meeting for routine discounts; replace it with the deal-desk Slack flow and the four-hour SLA. Simplify the CPQ configuration to the minimum that enforces the floor and routes the bands. The governance becomes *lighter on every individual deal* and *tighter on the system* — the floor is now hard-coded where before it was a committee norm.
Within a quarter cycle time drops by roughly a third and rep sentiment recovers. The lesson: governance borrowed from a much larger company is almost always too heavy. The right model for a $6M company in a competitive vertical is *lean* — a small number of bands, fast SLAs, hard tooling guardrails, and an aggregate review.
Complexity is not control; it is friction wearing control's clothing.
Scenario Five: The PLG Company Adding Sales-Led Motion
A fifth scenario: a product-led-growth company at $12M ARR, historically self-serve with transparent published pricing, now building a sales-led motion to chase larger accounts. PLG companies have a distinctive challenge — their *brand* is built on pricing transparency and fairness, and a sales-led discounting free-for-all can poison that.
But their larger prospects expect to negotiate, and a rigid "the price is the price" stance loses enterprise deals to competitors who will deal.
The governance answer here is a *segmented* model. The self-serve motion keeps its transparent, no-negotiation pricing — that is a brand asset, untouched. The new sales-led motion gets its own three-band architecture, but with a *narrow* Green Band (say 10%) because the published price is the public anchor and the company does not want a large delta between the self-serve price and the negotiated price becoming a trust problem.
The Yellow and Red Bands exist for genuine enterprise complexity — multi-year, large seat counts, custom terms — and the deal desk is explicitly chartered to protect the *coherence* between the public price and the negotiated price. The comp plan rewards reps for closing near the public price, treating list-price discipline as a brand-protection behavior.
The lesson: pricing governance must respect the company's *positioning*. A PLG company's transparency is a moat, and the governance model for its new sales motion has to be designed to *defend that moat*, not undermine it. There is no one-size model; the architecture is always shaped by the company's strategy.
The Non-Price Levers: Governing Structure, Not Just Discount
A pricing-governance conversation that is only about discount percentage is missing half the field. The most sophisticated governance systems give reps and the deal desk a rich set of non-price levers — and govern those too. Term length: a three-year commitment is worth a meaningful concession because it slashes churn risk and pulls revenue forward.
Payment terms: annual prepay versus quarterly versus monthly has real cash and risk implications and should be a *priced* lever, not a free giveaway. Volume and seat tiers: structured, published volume breaks let a rep deliver a "discount" that is actually just the customer qualifying for a tier — disciplined, predictable, and not a precedent problem.
Ramp deals: starting low and stepping up over the contract is a way to win a price-sensitive buyer without setting a permanent low reference price. Product scope: down-selling to a tighter package preserves the per-unit price. Case-study and reference clauses, co-marketing commitments, and logo rights all have real value and can be traded for price.
The governance principle is that these levers should be explicitly priced and explicitly tracked, not improvised. The deal desk should be able to tell a rep "a three-year term is worth 6 points, an annual prepay is worth 4 points, here is the menu" — so the rep negotiates *structure* instead of just caving on headline discount.
This matters enormously in a competitive vertical, because it lets a rep match a competitor's aggressive *number* with a *better deal* — same effective economics for the customer, but delivered through term and prepay rather than through a deep discount that erodes ASP and sets a bad precedent.
Governance that only watches the discount field while the reps freely give away net-60 terms and unlimited logo rights is governing the visible 50% and ignoring the rest. The full model governs the *entire deal structure*, and the comp plan and the deal desk are oriented to pull reps toward the structural levers that protect price and reduce risk.
Segmentation: One Model Does Not Fit All Deals
A single set of bands across every deal type is a beginner's model, and companies outgrow it fast. Real governance is segmented, because the right discount logic for a $15K SMB deal is not the right logic for a $400K enterprise deal. SMB deals should be *almost entirely Green Band* — high velocity, low touch, the cost of any approval friction exceeds the margin at stake; you want a wide instant-grant band and the deal desk barely involved.
Mid-market is the classic three-band zone. Enterprise deals are different animals: they carry non-standard terms, custom contract language, multi-product configurations, and procurement processes that take months — for these, the "discount percentage" is almost the least interesting variable, and the deal desk's job is structural and contractual, with the founder/CRO genuinely in the loop on the big ones because the strategic stakes are real.
Segmentation also runs along *product line*, *geography*, and *new-versus-renewal*. A new product still finding its price needs more discount latitude than a mature flagship with proven willingness-to-pay. A new geography may need promotional pricing latitude to establish a beachhead.
Renewals need their *own* governance — renewal discounting is where a shocking amount of margin quietly leaks, because a renewal "discount" often just means failing to capture the price increase the contract allowed, and that should be governed as deliberately as new-business discounting.
The instrumentation has to support this: the aggregate review should slice discount depth and win rate *by segment*, because a healthy blended average can hide a badly-bleeding segment. The founder's architecture work, in steady state, is substantially about *segmentation* — getting the bands, floors, and levers right for each meaningful slice of the business, rather than running one crude model across everything.
Common Failure Modes and How to Diagnose Them
Several failure modes recur across founder-led companies, and each has a diagnostic signature. The founder bottleneck: cycle time creeping, reps citing slow pricing answers, and — counterintuitively — *rising* average discount as reps anchor defensively. Diagnosis: pull approval cycle time and the discount distribution; if cycle time is bad and discounts are *higher* than the competitive benchmark, the founder's control is the cause.
The fictional floor: the floor exists in a deck but deals routinely close below it because there is no hard tooling guardrail. Diagnosis: count the deals below stated floor in the last two quarters; if it is more than a tiny handful, the floor is fiction. Red Band creep: the top band, meant for rare strategic bets, is catching 25-40% of volume.
Diagnosis: Red Band as a percentage of deal count and ARR; if it is well above 10-12%, either the list price is wrong, the bands are mis-set, or reps have learned that "real" pricing happens in Red.
Comp-plan conflict: the approval system says "discount discipline" but the comp plan pays pure bookings, so reps fight the deal desk on every deal. Diagnosis: ask whether a rep's take-home actually changes between a list-price deal and a 30%-off deal; if not, the comp plan is the problem.
The over-engineered matrix: five tiers, multiple committees, mandatory meetings — diagnosis is simply counting the approval steps and the median cycle time against the competitive set. The data vacuum: there is no aggregate review because the discount data lives in PDFs and email; diagnosis is asking for last month's ASP trend and discount-by-segment breakdown and watching the scramble.
Renewal leakage: new-business discounting is governed tightly but renewals are a free-for-all; diagnosis is comparing realized price increases at renewal against the contractual maximums. The meta-point: every one of these is *visible in the aggregate data* if you instrument the system.
A founder who has stood up CPQ and runs a monthly council will *see* the failure mode forming; a founder running governance by gut and Slack will only feel the symptoms.
Benchmarks and Real Numbers for a Competitive Vertical
Concrete targets give the architecture teeth. For a Series A-B SaaS company in a genuinely competitive vertical: median discount 12-18%; average discount 15-22% (the average runs above the median because of the Red tail); Green Band capturing 60-75% of deal count; Yellow Band 18-30%; Red Band under 10-12% of deal count and ideally under 15% of ARR.
Approval cycle time: median under 4-6 hours, 90th percentile under one business day, hard ceiling at 24 working hours. ASP erosion held under 3-4% per year — some erosion is normal as a company moves down-market or as the competitive set intensifies, but double-digit annual ASP erosion is a five-alarm fire.
Founder/CRO per-deal time under roughly 2-3 hours a week by Series B, ideally less. Deal desk staffing: part-time by $3-5M ARR, full-time by $15-20M ARR, a small team by $30-50M ARR. CPQ: stood up in lightweight form by Series A, properly configured by Series B.
A few more reference points. Win rate by band should *plateau* — if your win rate at 25% discount is not meaningfully higher than at 15%, the marginal 10 points are pure leakage, and that gap is often worth several points of blended margin. Multi-year and prepay mix is a health indicator — a company governing structure well should see a meaningful and growing share of deals carrying multi-year terms or annual prepay, because the deal desk and comp plan are pulling reps toward those levers.
Discount-by-segment spread: enterprise deals will and should discount deeper than SMB, but the spread should be *intentional* and stable, not chaotic. Renewal realized-increase capture: the percentage of contractual price-increase headroom you actually capture at renewal — many companies leave half of it on the table, and tightening that is often a faster margin win than anything on the new-business side.
These numbers are not universal laws — a 70%-gross-margin product in a less competitive niche will run tighter, a low-margin product in a brutal vertical will run looser — but they are a credible starting frame, and the *act of measuring against them* is more valuable than the specific figures.
The Five-Year and AI Outlook
Pricing governance is being reshaped by AI faster than almost any other RevOps domain, and a founder building a model in 2026 should build for where it is going. The near-term shift is AI-assisted deal desks: large-language-model tooling that reads a deal, checks it against the precedent library, the floor, and the band rules, and either auto-approves it or packages the escalation — collapsing the Yellow Band SLA from hours to minutes and handling the bulk of routine approvals without a human.
This does not eliminate the deal desk; it shifts the deal desk's work from *processing* to *judgment* — the analysts spend their time on the genuinely novel deals and on improving the rules, while the AI handles the precedented 80%. The instrumentation also gets sharper: AI can surface discount-leakage patterns, flag the segments where discounting is buying nothing, and even recommend band adjustments, turning the monthly review from a backward-looking report into a forward-looking optimization.
The further-out shift is toward dynamic and prescriptive pricing: models that recommend a specific price for a specific deal based on the prospect's firmographics, behavior, competitive context, and the company's win-rate data — a guided number rather than a list-price-minus-discount negotiation.
This is powerful and also dangerous: a founder must keep the *floor* and the *strategic exceptions* under human control, because an optimization model will happily chase short-term win rate into long-term margin destruction or into a reference-pricing problem it cannot see. The durable governance principles survive all of this.
You still need a floor. You still need bands, even if the AI sets the number within them. You still need an aggregate review, even if AI generates the dashboard.
You still need a human owning strategic exceptions. What changes is that the *friction* on routine deals approaches zero — which is exactly the direction a competitive-vertical founder wants — while the *human attention* concentrates entirely on the architecture, the floor, and the genuine strategic bets.
The founder who builds a clean, instrumented, band-based model now is building the foundation that AI will accelerate; the founder running governance by gut is building something AI cannot help and a competitor will out-execute.
The Discovery Diagnostic: Is It Your Governance or Your Strategy?
Before a founder redesigns their pricing-governance model, they should run a short diagnostic to confirm that *governance* is actually the broken thing — because the symptoms of bad governance and the symptoms of a bad *pricing strategy* look nearly identical from the outside, and the fixes are completely different.
Both produce creeping discounts, frustrated reps, and margin anxiety. But if the underlying issue is that the list price is simply wrong — set too high for the value the market perceives, or undifferentiated against the competitive set — then no amount of band architecture, CPQ guardrails, or deal-desk discipline will fix it.
The reps will keep discounting because the price is genuinely not winning at list, and a tighter governance model will just convert "deep discounts" into "lost deals." The diagnostic question is: *when reps sell at or near list, do they win at a healthy rate?* If yes, your strategy is sound and your governance is the problem — proceed with the band redesign.
If no — if even list-price-adjacent deals lose consistently — the problem is upstream, in positioning, packaging, or the list price itself, and that is a pricing-strategy project, not a governance project.
The second diagnostic axis is *variance*. Healthy discounting is *consistent* — similar deals get similar prices, and the distribution is tight around the bands. Pathological discounting is *high-variance* — two nearly identical deals close 18 points apart depending on which rep ran them and what mood the buyer's procurement team was in.
High variance is almost always a governance failure, because it means there is no real system — each deal is being priced from scratch by whoever happens to be in the room. Low variance with a high *mean* is a strategy problem (the price is wrong, but at least it is wrongly consistent).
The founder should pull the discount distribution and look at both the center and the spread. Wide spread says "build the architecture." High center with tight spread says "fix the price." This diagnostic takes an afternoon with the closed-won data, and it saves founders from the expensive mistake of pouring six months into a governance rebuild when the actual problem was a list price that needed a 15% haircut and a repositioning.
Geographic and Currency Governance: The Cross-Border Layer
Once a founder-led company starts selling across borders — which in a competitive vertical often happens earlier than planned, because competitors are global and deals come in from everywhere — pricing governance acquires a geographic dimension that catches many founders flat-footed.
The naive approach is to quote everyone in USD at the US price list and let the discount bands absorb the rest. This fails in two directions. First, in lower-purchasing-power markets, the US price at list is simply uncompetitive, so reps blow through the Green and Yellow bands just to reach a locally credible number — which means the band architecture is structurally mis-calibrated for an entire region, and the discount data is now polluted by deals that were never really "discounts" at all but currency-and-market adjustments.
Second, in markets where local competitors price in local currency, quoting in USD pushes FX risk onto the buyer and becomes a friction point procurement uses against you. The governance answer is *region-specific list prices and region-specific bands* — not a free-for-all, but a deliberate, published price book per major region, with the discount bands measured against the *local* list, so a 12% discount in the eurozone means the same governed thing as a 12% discount in North America.
The currency question is its own governed lever. Whether the company prices in USD, local currency, or offers a choice has real implications for revenue predictability, FX exposure, and competitive positioning, and it should be a *policy* decision owned in the pricing council — not something each rep improvises per deal.
Many founder-led companies land on: USD as the default, local-currency pricing for a small number of strategic markets where it is a genuine competitive necessity, and FX-adjustment clauses in multi-year contracts to manage the long-tail risk. The deeper point is that geographic governance is a place where the "govern the system, not the transaction" principle is especially important — the founder cannot and should not be approving the euro price on every European deal, but the founder absolutely should own the *decision* to have a European price book and the *logic* by which it is set.
Get the regional architecture right once, and the field can operate inside it at full velocity. Leave it ungoverned, and every cross-border deal becomes a one-off negotiation that pollutes the data and slows the cycle.
Channel and Partner Pricing: Governing the Indirect Motion
Most founder-led companies in competitive verticals eventually add some form of indirect motion — resellers, referral partners, system integrators, marketplaces, or an OEM/embed relationship — and the moment they do, pricing governance gets a whole new surface area that the three-band direct-sales model does not cover.
The core tension: a channel partner needs *margin* to be motivated to sell your product, and that margin has to come from somewhere — either a partner discount off list (which functions like a structural, pre-negotiated discount band) or a separate partner price book. If this is ungoverned, two failure modes appear fast.
Channel conflict: a partner and your direct rep both chase the same account and the customer plays them against each other, and suddenly your "governed" direct discount bands are competing against an unpoliced partner price. And margin stacking: a deal goes through a partner who discounts, and then the customer *still* negotiates with your direct team, and the total give-up is the partner margin plus a direct discount on top — a number no one ever consciously approved.
The governance answer is to treat channel pricing as a *deliberate, separate architecture* with its own rules, owned in the pricing council: a defined partner discount or partner price book, clear deal-registration rules that determine who "owns" a deal and prevent conflict, and a hard rule that channel deals do not *also* get direct discretionary discounts stacked on top.
The deal desk's mandate extends to policing the channel motion — verifying deal registration, checking that partner-sourced deals are priced against the partner architecture and not the direct bands, and flagging margin-stacking attempts. For a founder, the temptation is to treat channel as "free revenue" and not govern it because it feels incremental.
That is exactly how channel margin quietly becomes the worst-governed, deepest-discounted part of the entire book. The discipline is the same as everywhere else: the founder owns the *architecture* of the partner pricing — the discount level, the registration rules, the anti-stacking policy — and then the system runs without the founder in each partner deal.
A competitive vertical with an active channel needs this governance layer built deliberately, usually around the time the indirect motion crosses 15-20% of bookings.
The Engagement Letter and Contract Terms as Governed Levers
Pricing governance that stops at the discount percentage is leaving the riskiest part of the deal ungoverned. The contract itself — the terms beyond price — is where founder-led companies, in their hurry to close, accumulate liabilities that never showed up in any discount dashboard.
Non-standard payment terms (net-60, net-90, milestone billing) have real cash-flow and credit-risk consequences and should be a *priced and governed* lever, not a casual concession. Liability caps, indemnification language, and uncapped-liability carve-outs can expose the company to risk that dwarfs the entire deal value, and a rep under pressure to close will agree to redlines they do not understand.
Auto-renewal versus opt-in renewal, termination-for-convenience clauses, most-favored-nation pricing clauses, and price-protection guarantees all have long-tail consequences — an MFN clause signed to win one logo can cap your pricing power across the entire book for years. Service-level commitments and uptime penalties carry operational risk.
None of these is a "discount," and yet each is a real concession that should flow through governance.
The model is to make *term breaches* an automatic Red Band trigger, regardless of the discount percentage. A deal at 8% discount (deep Green Band) that also carries an uncapped-liability clause and a most-favored-nation provision is *not* a Green Band deal — it is a Red Band deal that happens to have a small discount, and the CPQ and approval logic should treat it that way.
This requires a *standard contract* with a clearly defined set of "standard terms," and a governance rule that any deviation from the standard set escalates. The deal desk maintains the precedent library for terms just as it does for pricing — the tenth net-60 request, the fifth liability-cap negotiation, should be handled from precedent in minutes, while a genuinely novel term escalates with the legal and financial exposure clearly packaged.
For the founder, the lesson is that "what can a rep give away" is a much bigger question than "how much discount can a rep grant." A complete pricing-governance model governs the *whole deal* — price, terms, and structure — because the buyer's procurement team certainly negotiates the whole deal, and the parts you leave ungoverned are exactly the parts they will exploit.
Building the Pricing Council: Membership, Cadence, and Authority
The monthly pricing council is the institutional home of pricing governance, and how it is constituted determines whether governance is a real operating function or a dashboard nobody acts on. Membership should be small and cross-functional: the founder/CEO (chair, at least through Series B), the CRO or VP of Sales, the head of RevOps or the deal-desk lead, the CFO or finance lead, and — as the company matures — a product or monetization leader.
That is it. A council of twelve is a committee that cannot decide; a council of five is a governing body that can. The cadence is monthly for the standing review, with the *authority* to make architecture changes — adjust the bands, move the floor, retune the comp accelerators, amend the CPQ rules — vested in that meeting.
Crucially, the council does *not* approve individual deals; it governs the system. The moment a pricing council starts adjudicating specific transactions, it has become a slow, expensive deal desk and the whole velocity argument collapses.
The council's standing agenda is disciplined: review the aggregate dashboard (ASP trend, discount distribution, discount-by-segment, win rate by band, approval cycle time, leakage estimate); review the Red Band deals from the prior month — not to re-litigate them, but to spot patterns ("we did four competitive-displacement Red deals against the same competitor — is that a list-price signal?"); review SLA performance and any misses; and decide on any architecture changes, with the changes documented and a clear owner for implementation.
A quarterly version of the council goes deeper — a full segmentation review, a competitive-pricing scan, a look at the comp plan's effects, and a deliberate revisit of the floor against current unit economics. The council is also where the founder *practices the handoff* — chairing it at Series A, co-chairing with the CRO at Series B, and stepping to an advisory seat by Series C.
A founder who builds a real pricing council builds the mechanism by which pricing governance outlives the founder's direct involvement. A founder who never builds one keeps governance as a personal, tacit, fragile thing — which is the original problem this entire entry exists to solve.
Handling the Strategic Logo Exception Without Poisoning the Book
Every founder in a competitive vertical faces the strategic-logo temptation: a marquee customer — a name that would transform the company's credibility — is in the pipeline, and they want a price far below the floor. The instinct is binary: either "yes, the logo is worth it" (and the founder breaks their own floor) or "no, we hold the line" (and a transformational logo walks to a competitor).
Both are wrong, and the governance model should give the founder a *third path*. The strategic-logo exception is real and legitimate — sometimes a logo genuinely is worth a below-floor price — but it must be handled in a way that does not poison the rest of the book, because the danger is not the one deal; it is the *reference price* that one deal creates.
The moment a competitor's procurement team, or your own next prospect, learns that Marquee Co. Got 55% off, that becomes the anchor for every subsequent negotiation.
The governed approach has several components. First, the strategic exception is *explicitly* a founder-only process, individually justified and logged — it is not a band, it is a documented one-off. Second, the deal is *structurally insulated*: the low price is delivered through mechanisms that do not set a clean reference — a ramp that starts low and steps up, a pilot-to-production structure, scope that is genuinely narrower, a co-marketing or case-study commitment that represents real value exchanged, or a time-boxed promotional rate with a contractual step-up.
The goal is that the headline number is defensible as a *different deal*, not the same product at a lower price. Third, the volume of strategic exceptions is *hard-capped* — single digits per year — because the entire logic breaks if "strategic logo" becomes a category rather than a rare event.
Fourth, the exception is reviewed in the pricing council *after the fact* — not for approval, but so the institution learns from it and watches for the reference-price contagion. The founder who handles strategic logos this way gets the credibility benefit without the margin contagion.
The founder who handles them as a simple floor-break teaches their entire sales org, and the entire market, that the floor is negotiable — which is the most expensive lesson a founder-led company can teach.
The Renewal Governance Track: Where Margin Quietly Dies
New-business discounting gets all the founder's attention because it is visible, emotional, and happens in real time. Renewal discounting gets almost none — and that is precisely why renewals are where a shocking amount of margin quietly leaks out of a founder-led company. The mechanics of renewal leakage are subtle.
A contract often allows a price increase at renewal — a built-in uplift, a CPI adjustment, a step from a promotional rate to standard. Renewal "discounting" frequently is not an explicit discount at all; it is the *failure to capture* that allowed increase. A renewal rep, not wanting to risk the relationship, simply renews at the prior price — and the company has just given away the entire contractual uplift without anyone approving a "discount," because it never showed up as one.
Multiply that across a renewal book and the cumulative margin given away can exceed the entire new-business discount line.
Renewal governance therefore needs its own architecture, separate from new business. The core artifacts: a *standard renewal uplift* policy (the default increase the company expects to take at renewal, governed and published), renewal *bands* that govern how far below that standard uplift a renewal can land without escalation, and a dashboard metric — *realized increase capture* — that measures what percentage of the contractual and standard uplift headroom the company actually captured.
That metric belongs on the monthly pricing-council dashboard alongside new-business discount depth. The deal desk's mandate extends to renewals: a renewal that fails to take the standard uplift should require a justification, exactly as a new-business Yellow Band discount does. Comp matters here too — renewal reps and customer-success owners whose comp is indifferent to whether the uplift is captured will, rationally, not fight for it; a comp structure that rewards realized-increase capture turns the renewal motion from a leak into a margin engine.
For a founder, the lesson is that the discount you cannot see is more dangerous than the discount you can. New-business discounting is loud and governed; renewal leakage is silent and, in most founder-led companies, entirely ungoverned. Closing that gap is often the single fastest margin improvement available.
Instrumenting Trust: How the System Earns the Right to Loosen
The whole arc of this entry is that governance should get *lighter on routine deals* as the company matures — wider Green Bands, faster SLAs, more delegation. But that loosening is not a leap of faith; it has to be *earned*, and the mechanism by which it is earned is instrumentation.
A founder cannot responsibly widen the Green Band from 15% to 20% on a hunch. They can responsibly widen it when the data shows that Green Band deals are winning at a healthy rate, that margin is holding, that reps are not reflexively maxing the band, and that the win-rate-by-band curve says the extra latitude will not just be given away.
Instrumentation is what converts "loosening governance" from a gamble into a measured decision. This is why the CPQ-as-instrumentation point matters so much: the data exhaust from every quote and every approval is not just a reporting nicety; it is the *evidence base* that lets the founder safely delegate more over time.
The practical pattern is a ratchet. The company starts, at Series A, with relatively conservative bands because it does not yet have the data to justify wider ones. As the months of clean CPQ data accumulate, the pricing council reviews the evidence and *deliberately* loosens — band by band, segment by segment — wherever the data supports it, while *tightening* the floor as the unit-economics picture sharpens.
Over two or three years the system converges on a model that is simultaneously much more delegated on routine deals and much more disciplined on the floor and the strategic tail than the founder's original gut-driven approach ever was. The founder's role in this is to be the person who insists the loosening be *earned* — who resists both the pressure to loosen prematurely (from a sales team that always wants more latitude) and the temptation to never loosen at all (from the founder's own control instinct).
Instrumented trust is the answer to the question "how do I know when I can let go of more?" — and a founder who builds the instrumentation early gives themselves the option to scale governance gracefully, while a founder who runs on gut never gets that option and stays the bottleneck by default.
When Competitors Force Your Hand: Reactive Versus Proactive Governance
In a highly competitive vertical, a founder's pricing governance does not operate in a vacuum — it operates against competitors who are running their own discounting playbooks, and who will deliberately probe and pressure your model. A common pattern: a well-funded competitor starts aggressively undercutting in head-to-head deals, and the founder's sales team comes back asking for deeper bands "because we're losing on price." This is the moment a founder's governance discipline is most tested, and the wrong move is to react deal-by-deal — quietly approving deeper and deeper exceptions until the de facto discount has moved 15 points and the band architecture is fiction.
Reactive, ungoverned response to competitive pressure is how a founder-led company gets dragged into a margin war it never consciously decided to fight.
The governed response separates the *signal* from the *noise*. A small number of competitive losses on price is noise — not every deal is winnable, and walking from a deal a competitor wants to buy at a loss is often correct. A *pattern* of competitive price losses, visible in the win-rate and competitive-tagging data, is a signal — and signals get addressed at the *architecture* level, in the pricing council, deliberately.
Maybe the response is a genuine list-price or packaging adjustment. Maybe it is a sharper competitive-displacement play within the existing Red Band, with the deal desk armed to compete on structure. Maybe it is a decision to *not* chase that competitor's price-sensitive segment at all and to focus where the company actually differentiates.
What it should never be is an undocumented, gradual, deal-by-deal slide. The discipline is: competitive pressure changes the *architecture*, through the council, with data — it does not erode the *bands*, deal by deal, in the field. A founder who holds that line keeps competitive pressure as an input to deliberate strategy.
A founder who does not holds nothing — the competitor is effectively setting the founder's price list, one exception at a time. Proactive, instrumented, council-driven response to competitive pressure is the difference between a governance model that survives a competitive vertical and one that gets dismantled by it.
The Final Framework: Govern the System, Not the Transaction
Pull it all together into a single operating principle: a founder in a competitive vertical should govern the boundaries of the system, not the transactions inside it. That principle decomposes into a concrete checklist. *Own the architecture:* the price list, the three-band thresholds, the structural-lever menu — the founder designs these, deliberately, with data, in the pricing council.
*Own the floor personally:* it is the one hard line, hard-coded in CPQ, and floor exceptions are a rare founder-only process. *Delegate the bands:* Green to every rep instantly, Yellow to a deal desk with a four-hour SLA, Red to founder/CRO but capped under 12% of volume. *Encode it in tooling:* CPQ that makes below-floor impossible and Green effortless, generating the data exhaust the review depends on.
*Align the comp plan:* reps must internalize a real share of discount cost, with accelerators pulling them toward term, prepay, and structure. *Govern speed as a metric:* publish the approval SLA, measure it, defend it like a revenue number. *Review the aggregate monthly:* ASP trend, discount distribution and depth by segment, win rate by band, cycle time, leakage — and update the architecture from what you learn.
*Match the model to the stage:* lighter and looser on routine deals as the company matures and the system earns trust, tighter on the floor as the data deepens. *Get out of the per-deal path by Series B:* the founder's pricing instinct is too valuable to spend on haggling and too dangerous to keep as a bottleneck.
The deepest reframe for the founder is this: rigid discount authority does not protect the company — it protects the founder's *feeling* of control while quietly damaging the two things that actually matter, velocity and the development of pricing judgment across the org. A founder-led company in a competitive vertical wins on speed, on being easy to do business with, and on a sales org that can price intelligently without the founder in the room.
The governance model that delivers all three is tiered, fast, instrumented, and reviewed in aggregate — tighter than chaos because the floors are real, faster than a bottleneck because most deals never touch a human, and durable because it survives the founder stepping back. Build that, and pricing governance stops being the thing that slows you down and becomes a genuine competitive weapon.
Decision Flow: Routing a Deal Through the Three-Band Model
Comparison Matrix: Rigid Authority vs Tiered Governance vs Loose Free-For-All
FAQ
What is the three-band discount architecture for a competitive vertical? A Green Band (0-15% off list) any rep grants instantly with zero approval, a Yellow Band (15-30%) that clears through a single manager or a deal-desk Slack bot inside 4 working hours, and a Red Band (30%+) requiring founder/CRO sign-off but capped at roughly 8-12% of total deal volume.
You govern the boundaries of the bands, not each deal inside them. In a competitive vertical, velocity is a feature of the product.
Why is routing most deals through the founder a mistake? Routing 60-80% of deals through the founder "to keep control" adds 3-9 days of cycle time, trains reps to anchor low by starting negotiations at the deepest number, and makes the founder the single biggest bottleneck in the revenue engine.
Within a quarter a 21-day cycle becomes 30-plus while a competitor with a clean 15% instant-grant band is already sending contracts. The founder should be out of the per-deal approval path entirely by Series B.
What aggregate metrics should be reviewed monthly instead of individual deals? Average selling price, discount depth by segment, win rate by band, and discount leakage, meaning deals that landed in Red that a tighter Green offer would have closed anyway. Set the floors with hard CPQ guardrails and publish a discount-approval SLA with median approval under 4 hours and 90th percentile under 1 business day.
Govern aggregates, not each transaction.
What discount and cycle-time targets should a Series A-B company hit? Median discount 12-18%, approval cycle time under 6 hours, less than 10% of ARR through founder-level approval, and ASP erosion held under 3-4% per year. Staff a part-time deal desk by roughly $3-5M ARR and a full-time one by roughly $15-20M ARR.
Tie a portion of rep comp to net ASP, not just bookings, so the field internalizes price discipline.
What are the four components of pricing governance? The price architecture (list price, discount logic, floor, and structural levers like term and ramp), authority and approval (who signs off on what, with SLAs), enforcement tooling (CPQ guardrails that make below-floor quotes impossible, not just against policy), and the review and feedback loop.
Founders fixate on approval authority because it feels like control, but authority without architecture is just gatekeeping and authority without tooling is just hope. Invest most in architecture, tooling, and the feedback loop.
Sources
- OpenView / Insight Partners SaaS Benchmarks Reports — Discount depth, ASP, and sales-cycle benchmarks for venture-stage SaaS companies across competitive verticals.
- KeyBanc Capital Markets (KBCM) SaaS Survey — Annual private-SaaS operating benchmarks including discounting, ACV, and go-to-market efficiency metrics.
- Salesforce CPQ / Revenue Cloud product documentation — Configure-Price-Quote architecture, approval flows, validation rules, and discount guardrails.
- DealHub.io — Deal desk and CPQ best-practice library — Reference material on discount banding, approval SLAs, and deal-desk operating models.
- Subskribe and Nue.io product documentation — Modern CPQ and quoting alternatives for agile / usage-based pricing models.
- Gartner — Pricing and Revenue Operations research — Frameworks for discount governance, pricing councils, and the deal-desk function in B2B technology companies.
- Forrester — B2B Revenue Operations and Deal Desk research — Deal-desk staffing benchmarks, escalation design, and the velocity-versus-control tradeoff.
- SaaStr — Pricing, discounting, and deal-desk content (Jason Lemkin and contributors) — Operator-grade guidance on founder discounting behavior and when to build a deal desk.
- Winning by Design — Revenue Architecture frameworks — Sales-process and pricing-governance design for scaling SaaS organizations.
- Pacific Crest / KBCM historical SaaS surveys — Longitudinal data on ASP trends and discount behavior across funding stages.
- The Bridge Group — SaaS AE and Sales Development metrics reports — Sales-cycle-time and quota benchmarks relevant to velocity analysis.
- RevOps Co-op community resources — Practitioner discussions on CPQ implementation, discount banding, and deal-desk operating models.
- Pavilion (formerly Revenue Collective) operator content — CRO and RevOps leadership material on pricing governance and founder handoff.
- a16z and First Round Review go-to-market essays — Founder-stage guidance on pricing experimentation and the transition out of founder-led sales.
- ProfitWell / Paddle pricing and monetization research — Willingness-to-pay analysis, ASP erosion data, and pricing-strategy benchmarks.
- Simon-Kucher & Partners — B2B pricing strategy research — Discount governance, price-floor discipline, and the economics of structural levers.
- McKinsey — B2B pricing and commercial excellence research — Discount-leakage analysis and the win-rate-versus-discount-depth relationship.
- CFO and finance-leadership benchmarking (e.g., Bessemer Venture Partners State of the Cloud) — Gross-margin and unit-economics context for floor-setting.
- Clari and Gong revenue-intelligence research — Deal-progression and cycle-time data, and how pricing friction shows up in pipeline analytics.
- DealHub / Subskribe / Salesbricks customer case studies — Real-world before-and-after on approval cycle time after CPQ and deal-desk implementation.
- Maxio (formerly SaaSOptics / Chargify) billing and revenue research — Renewal pricing, realized-increase capture, and renewal-discount leakage data.
- Corporate Visions and Force Management — sales negotiation methodology — Anchoring behavior, concession strategy, and how reps respond to approval friction.
- Vendr and Tropic (SaaS buyer-side / procurement platforms) — The buyer/procurement perspective on negotiation, useful for calibrating competitive-vertical discount expectations.
- Benchmarkit / SaaS Capital benchmark reports — Private-SaaS metrics including discounting and net revenue retention by stage.
- HBR and MIT Sloan articles on pricing governance and discount discipline — Academic and practitioner framing of the control-versus-velocity tradeoff.
- Iconiq Growth — Topline Growth and Operational Efficiency reports — Stage-by-stage benchmarks for high-growth B2B software, including go-to-market design.
Numbers
Discount Depth Benchmarks (Series A-B, Competitive Vertical)
- Median discount: 12-18%
- Average discount: 15-22% (runs above median due to Red Band tail)
- Healthy Green Band share: 60-75% of deal count
- Healthy Yellow Band share: 18-30% of deal count
- Red Band cap: under 10-12% of deal count, under ~15% of ARR
- Rigid-model failure signature: average discount drifts to 20-25%+ (reps anchor low)
- Loose-model failure signature: average discount drifts to 30-40%+
The Three-Band Architecture
- Green Band: 0-15% off list (10-20% depending on margin and vertical) — instant grant, zero approval
- Yellow Band: 15-30% — single approver / deal desk, 4-hour SLA
- Red Band: 30%+ or any non-standard term breach — founder/CRO sign-off, volume-capped
- Floor: hard-coded CPQ guardrail, never breachable, founder-owned exception process
Approval Cycle Time (SLA Targets)
- Median approval cycle time: under 4-6 working hours
- 90th percentile: under 1 business day
- Absolute ceiling: no request unresolved past 24 working hours
- Rigid-model penalty: +3-9 days of sales-cycle time
- Founder bottleneck symptom: 24-day cycle stretches to 30-34+ days
Founder / CRO Time in Pricing
- Founder pricing time under rigid model: ~6-10 hours/week
- Founder pricing time under tiered model (Series B): under 2-3 hours/week
- Steady-state: daily 15-min Red review + monthly pricing council
Deal Desk Staffing Timeline
- Part-time deal desk: by $3-5M ARR (RevOps / sales-ops analyst, slice of role)
- Full-time dedicated deal desk: by $15-20M ARR
- Small deal-desk team (lead + 1-2 analysts): by $30-50M ARR
- CPQ stood up lightweight: by Series A
- CPQ properly configured: by Series B
ASP and Margin Targets
- ASP erosion held under: 3-4% per year
- Double-digit annual ASP erosion: five-alarm fire
- Win-rate-by-band: should plateau — 25% discount win rate ~= 15% discount win rate means 10 points of pure leakage
- Discount leakage from win-rate plateau: often worth several points of blended margin
Stage-by-Stage Model Evolution
- Pre-seed/Seed (under ~$1M ARR): founder is the pricing engine; only artifact is a written price record
- Series A (~$1-5M ARR): build first architecture — price list, three bands, hard floor, part-time deal-desk owner
- Series B (~$5-20M ARR): full-time deal desk, CPQ properly stood up, net-price comp component, founder exits Yellow Band path
- Series C+ (~$20M+ ARR): segmented pricing, dedicated pricing/monetization function, founder on strategic exceptions + quarterly architecture review only
Comp Design Levers
- Green Band: full/healthy commission rate (you want fast Green deals)
- Yellow Band: modest commission haircut scaling with discount depth
- Red Band: commission often case-by-case, tied to strategic rationale
- Positive accelerators: multi-year, annual prepay, at/above-target ASP
Non-Price Lever Reference Values (Illustrative)
- 3-year term commitment: worth ~5-7 points of concession
- Annual prepay vs quarterly: worth ~3-5 points
- Volume/seat tier: structured published breaks, not a precedent problem
- Ramp deal: wins price-sensitive buyer without permanent low reference price
Segmentation Guidance
- SMB deals: should be ~entirely Green Band — friction cost exceeds margin at stake
- Mid-market: classic three-band zone
- Enterprise: structural/contractual focus, founder/CRO on the largest deals
- Renewals: own governance track — renewal leakage often = failing to capture contractual price increases
- Renewal realized-increase capture: many companies leave ~half the contractual headroom on the table
Aggregate Review Dashboard (Monthly)
- ASP and ASP trend
- Discount depth distribution across Green/Yellow/Red
- Discount depth by segment (SMB / mid-market / enterprise / geo / product line)
- Win rate by band
- Approval cycle time (median + 90th percentile, misses flagged)
- Discount leakage estimate
Scenario Outcomes (Illustrative)
- Scenario 1 (Series A bottleneck): cycle time 34 to ~26 days, avg discount 21% to 15%, founder time ~8 hrs/wk to under 90 min/wk
- Scenario 2 (knife-fight vertical): avg discount ~35% to ~19%, win rate flat (proving old discounts bought nothing), multi-year mix doubled
- Scenario 4 (over-engineered matrix): cycle time drops ~one-third after collapsing 5 tiers to 3 bands
Counter-Case: When Tiered, Velocity-First Governance Is the Wrong Answer
The three-band, velocity-first model is the right default for most founder-led companies in competitive verticals — but a serious operator should know the conditions under which it is wrong or needs heavy modification.
Counter 1 — Ultra-low-margin or capital-intensive businesses cannot afford a wide Green Band. The model assumes healthy gross margins where a 15% instant-grant discount still leaves a profitable deal. If the business runs on thin margins — hardware, services-heavy, infrastructure with real COGS — a 15% no-approval band can put deals underwater.
In that case the Green Band might be 5% or even zero, and more deals legitimately need a margin check before they go out. Velocity still matters, but the floors sit much closer to list, and the deal desk's economic review is non-negotiable on a far larger share of deals.
Counter 2 — Regulated or contract-heavy verticals make "speed" subordinate to compliance. In government, healthcare, financial services, or any vertical where every deal carries legal, security, and compliance review, the discount approval is the *least* of the cycle-time problem.
Optimizing the discount SLA to four hours is irrelevant when the legal redline cycle is six weeks. Here governance should focus less on discount-approval speed and more on contract-term standardization and parallel-tracking the legal/security review. A founder who pours energy into a fast discount band while ignoring the real bottleneck is solving the wrong problem.
**Counter 3 — A genuinely differentiated product with a strong moat should govern *tighter*, not faster.** The whole velocity-first argument assumes a competitive knife-fight where the buyer has three credible alternatives. If the company actually has a defensible moat — unique data, real switching costs, a category-defining product — then discounting is often *destroying* value the company does not need to give away.
In that situation the right move is a *narrow* Green Band, a disciplined "we don't really discount" posture, and a comp plan that heavily rewards list-price selling. Reflexively widening the Green Band because "competitive vertical" is the headline can train a sales org to discount a product that did not need it.
Counter 4 — Very early-stage companies should NOT build this architecture yet. Before product-market fit on price — under ~$1M ARR, founder still closing every deal — building a three-band model with CPQ and a deal desk is premature optimization. The founder *should* be in every deal, because every deal is a pricing experiment and the data does not exist yet to set bands intelligently.
Installing heavy governance too early ossifies a price structure the company has not earned the right to commit to. The counter-case here is timing: right model, wrong stage.
Counter 5 — A sales team too junior to hold Green Band authority responsibly. The model delegates 0-15% instant-grant authority to every rep. If the sales org is brand-new, under-trained, or churning fast, that delegation can mean every rep maxes the Green Band on every deal reflexively — turning a 15% "available if needed" band into a 15% "automatic" floor.
In that case the Green Band may need to start narrower with the deal desk doing more coaching-through-approval, widening only as the team's pricing judgment matures. Delegation assumes a baseline of judgment that not every team has yet.
**Counter 6 — Founder-as-bottleneck can occasionally be a *feature* in a tiny, high-ACV business.** If a company sells a small number of very large deals — six or seven figures each, a handful per quarter — then the founder being in every deal is not a scaling bottleneck; it is appropriate executive involvement, and the "throughput" argument barely applies.
The three-band model is built for *volume*. A business doing 12 enormous deals a year does not have a volume problem, and a heavy governance architecture would be bureaucracy for its own sake. Match the model to the deal-count reality.
Counter 7 — Aggregate review can mask a catastrophic single deal. Governing the system rather than the transaction is the right principle for the common case, but a blended monthly dashboard can hide a single deal that sets a disastrous precedent — a marquee logo signed at a price that every future prospect's procurement team will reference, or a contract with liability terms that become a template problem.
The mitigation is that the Red Band and floor-exception process must stay genuinely founder-owned and individually scrutinized; "govern the aggregate" applies to Green and Yellow, not to the strategic tail. A founder who delegates the aggregate but also stops scrutinizing the big individual exceptions has over-corrected.
Counter 8 — In a true commodity price war, governance is not the lever — the business model is. If the vertical has genuinely commoditized and the only thing buyers respond to is price, no discount-governance architecture saves the margin; the company is in a structural race to the bottom.
The honest answer in that scenario is not "tune the bands" — it is product differentiation, repositioning, moving up-market, changing the packaging, or rethinking the business model. Pricing governance is a tool for *executing* a viable pricing strategy. It cannot rescue a company that does not have one.
The honest verdict. The tiered, velocity-first model is the correct default for a venture-stage, healthy-margin, volume-driven, genuinely competitive software business — which describes most founders asking this question. But it is wrong for ultra-low-margin or capital-intensive businesses, subordinate to compliance in regulated verticals, overkill for tiny high-ACV businesses, premature pre-PMF, and risky with an untrained team — and it is no substitute for a viable strategy in a true commodity war.
The skill is diagnosing which world you are in before importing the playbook.
Related Pulse Library Entries
- q9501 — How do you build a RevOps function from scratch? (The org that owns pricing governance, CPQ, and the deal desk.)
- q9502 — How do you design a sales compensation plan? (The comp-alignment layer referenced throughout this entry.)
- q9551 — When should a founder hire a CRO? (The handoff that pricing governance must survive.)
- q9552 — How do you build a deal desk? (Deep dive on the operational function central to this model.)
- q9553 — What CPQ system should a Series A company use? (Tooling deep dive — Salesforce CPQ vs DealHub vs Subskribe vs native flows.)
- q9554 — How do you set SaaS list pricing? (The price-architecture layer the founder must own.)
- q9555 — How do you price multi-year and ramp deals? (Non-price structural levers deep dive.)
- q9556 — How do you govern renewal pricing and reduce renewal leakage? (The renewal-governance track flagged as a separate discipline here.)
- q9557 — How do you transition out of founder-led sales? (The broader context for getting the founder out of the per-deal path.)
- q9558 — How do you run a pricing council? (The monthly aggregate-review meeting structure.)
- q9559 — What metrics should a RevOps dashboard track? (ASP, discount depth, win rate by band, cycle time.)
- q9560 — How do you set a price floor and protect unit economics? (The one number the founder owns personally.)
- q9561 — How do you segment pricing by SMB / mid-market / enterprise? (The segmentation layer of mature governance.)
- q9562 — How do you forecast revenue in a competitive vertical? (Discount and ASP assumptions feed the forecast.)
- q9563 — How do you reduce sales-cycle time? (Approval SLA as a cycle-time lever.)
- q9564 — How do you compete against aggressively discounting competitors? (The knife-fight-vertical scenario in depth.)
- q9565 — How do you build a sales precedent / playbook library? (The deal-desk institutional-memory asset.)
- q9566 — What is the right approval matrix for enterprise deals? (Non-standard terms and contractual governance.)
- q9567 — How do AI agents change the deal desk? (The five-year AI outlook in depth.)
- q9568 — How do you set willingness-to-pay through pricing research? (Floor and list-price derivation.)
- q9569 — How do you design a PLG-to-sales-led pricing transition? (Scenario five in depth.)
- q9570 — How do you measure and reduce discount leakage? (The win-rate-by-band analysis as its own discipline.)
- q9571 — How do you structure RevOps tooling at Series A vs Series B? (CPQ, CRM, and the governance stack by stage.)
- q9572 — How do you onboard a new CRO into an existing pricing system? (Scenario three — the post-founder transition — in depth.)
- q9573 — How do you train reps to negotiate on structure instead of price? (Non-price-lever selling as a coaching discipline.)
- q9574 — How do you set quota and capacity in a competitive vertical? (Capacity planning interacts with discount-driven ASP.)
- q9575 — How do you build a monthly revenue review cadence? (The broader operating rhythm the pricing council sits inside.)
Recently Added — Related
- When should a founder-led company formalize sales comp and quotas, and does the timing change if you're doc...
- For a founder-led $5M-$30M company, is it better to hire a first AE who mirrors the founder's selling style...
- How should a founder-led or early-stage sales org set up initial discount governance bands before they have...