


Revenue Architecture for Vertical SaaS for Pest Control in 2027 (PE Roll-up Channel, Payments, NRR)
Quality
Certified
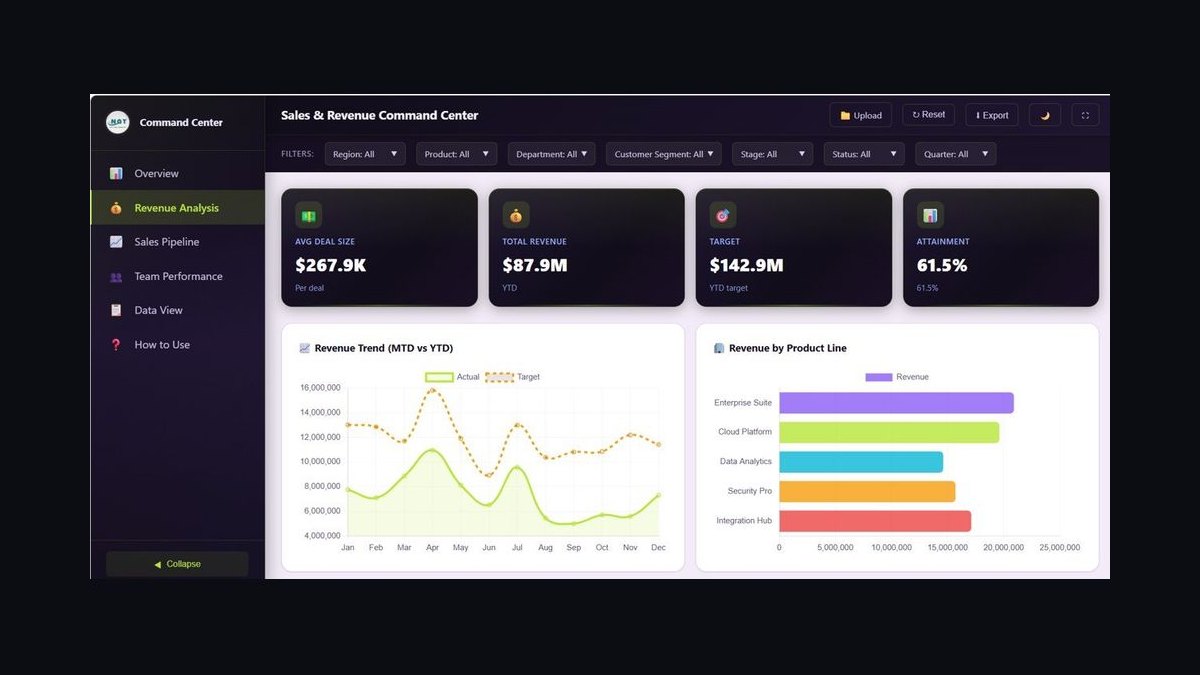
Revenue architecture for pest control vertical SaaS in 2027 runs three segments — Solo-Operator ($1,800–$7,800 ACV), Independent Branch ($22,000–$140,000), and Multi-Branch ($320,000–$8M+) — on separate comp plans, because roughly 65% of new Multi-Branch logos arrive through PE roll-up acquisitions, payments attach drives LTV, and NRR sits at 108–128%.
The scenario that breaks a flat comp plan
Picture a vertical SaaS vendor at $28M ARR selling into pest control. It has one AE team, one comp plan, and a forecast that treats a five-route owner-operator the same as a 900-branch national account. Two things go wrong at once. First, the Solo-Operator deals — a GorillaDesk-style or Housecall Pro-style buyer who signs in 9 to 32 days for $1,800 to $7,800 — get starved of attention because reps chase the six-figure logos. Second, and more damaging, the vendor keeps losing Multi-Branch expansion it never sees coming: an Independent Branch customer it happily served for three years gets acquired by a PE-backed roll-up (Aptive, Moxie, Hawx, or an Anticimex-style consolidator), and within a 90-day integration window the parent migrates that branch onto its *own* standardized platform. The vendor's cohort analysis shows flat unit growth six months later and nobody can explain it. The revenue architecture failed not because the product lost, but because the org had no structure to track the roll-up pipeline, no acquisition-onboarding overlay to capture the migration, and no separate motion for the segment where 65% of new Multi-Branch ARR now originates. This page lays out the architecture that fixes all three failures.
How the roll-up mechanism actually moves revenue
The defining feature of pest control as a vertical is that it is the most aggressively consolidated field-service category since 2020. Rollins (Orkin), Rentokil (Terminix), Anticimex, Arrow Exterminators, Aptive, Moxie, and Hawx all run continuous acquisition pipelines — publicly reported ranges land around 40 to 180 independent companies acquired per year across the top consolidators, with Anticimex alone having absorbed 480+ companies over roughly a decade and Rollins adding 65+ since 2020. For a SaaS vendor, this changes the unit of sale. You do not win a branch; you win a *parent* and then inherit its acquisition pipeline automatically. Every company the parent buys becomes a migration onto whatever platform the parent standardized on — FieldRoutes, PestPac, or another — inside a 90-day window after close.

That means the highest-leverage RevOps forum is not the weekly pipeline council; it is the roll-up acquisition pipeline review, where operations tracks which PE sponsor bought which Independent Branch operator this month and routes it to an acquisition-onboarding overlay. Miss that instrumentation and a single Multi-Branch contract silently leaks 40 to 80 acquired-company migrations a year.
The architectural takeaway: the roll-up channel is a distinct go-to-market motion with its own pipeline, its own owner, and its own comp — not a side effect of the direct sales team hitting quota.
Segment design, ACV bands, and the numbers that anchor the model
Every downstream decision — coverage ratios, ramp, draw, forecast weighting — descends from getting the three segments right. The bands and benchmarks below reflect 2027 vertical SaaS pricing for the category.

Solo-Operator (1–5 routes). ACV $1,800–$7,800. Module mix is scheduling, billing, embedded payments, basic CRM, and EPA-required pesticide tracking. Sales cycle 9–32 days, owner-operator is the sole decision-maker, win rate 22–32%, inside-AE motion. Coverage target 3.2x, roughly 24% Stage-2-to-close.
Independent Branch (6–40 routes). ACV $22,000–$140,000. Enterprise FSM plus route optimization, recurring-billing automation, customer portal, technician mobile, EPA reporting, and chemical inventory. Sales cycle 2–6 months across a buying group of Owner/President, Operations Manager, and Office Manager. Win rate 18–25%, field-AE plus solutions consultant, coverage 4.2x and about 18% Stage-2-to-close.
Multi-Branch / National Operator (41–2,500+ routes). ACV $320,000–$8M+. Full enterprise FSM with multi-state consolidation, national reporting, a custom data warehouse, integrated finance, corporate EPA compliance, and acquisition-onboarding workflows. Sales cycle 6–18 months across CEO, CFO, CIO, COO, and regional VPs. Win rate 13–19%, dedicated national-account team, coverage 4.6x and roughly 13% Stage-2-to-close.

Pricing and packaging (2027). Core PM runs $28–$95 per route per month. Payment processing prices at 45–75 bps plus $0.10–$0.18 per transaction. AI route optimization is a $320–$880 per branch per month tier. Customer portal with automated recurring billing runs $180–$520 per branch per month, and agentic AI CSR/chat commands $320–$1,400 per branch per month. Implementation fees span $4,000–$48,000. The single biggest ARPU lever in 2027 is the AI stack — route optimization, AI quoting, and chat-based customer service — which carries 22–38% incremental ARPU where attached.
Comp structure. Solo AE: OTE $115k–$155k at 50/50, quota $620k–$920k new ARR plus $7M–$11M annualized payment volume. Independent Branch AE: OTE $185k–$255k at 50/50, quota $1.6M–$2.4M new ARR plus $18M–$28M payment volume, with a trailing 10–15 bps payment-processing residual for 24 months post-go-live. Multi-Branch AE: OTE $310k–$465k at 45/55, quota $3.2M–$5.4M new ARR, multi-year vesting (55/30/15) and a $60k–$100k draw. PE Roll-up Channel Account Manager: OTE $220k–$320k at 55/45, mandatory at $30M+ ARR, variable on roll-up pipeline ARR plus per-acquired-company migration revenue plus co-marketing with the PE sponsor. Acquisition-onboarding overlay: OTE $135k–$180k at 75/25, paying $8k–$22k per company migrated on time within 90 days of a roll-up closing. CSM: OTE $98k–$132k at 70/30, quota $320k–$460k expansion ARR against 96% logo retention, 92% gross retention, and 88% payment-volume retention.

NRR by segment. Solo 102–108%, Independent Branch 108–114%, Multi-Branch 118–128%, with best-in-class composite around 118% and mid-pack around 108%. Above roughly 3,000 customer firms the forecast weights 65% expansion / 35% new logo, because at that install-base scale route growth, technician adds, payments, and AI upgrades outrun net-new logo capacity.
Trade-offs: build a PE channel, or route everything through direct sales
The central architectural decision is whether the roll-up motion gets its own org branch reporting to the CRO, or whether Multi-Branch AEs absorb it. The dedicated-channel path costs a VP, overlay account managers, and an onboarding team — real fixed cost you cannot justify below about $30M ARR. But it captures the acquisition pipeline systematically, gives the PE sponsor a single co-marketing counterpart (EQT, Audax, Genstar, Thomas H. Lee), and turns each roll-up parent into a compounding annuity. The direct-sales-only path is cheaper and simpler, but it treats every acquired-company migration as an unplanned fire drill, under-attaches payments on the inherited base, and leaves the sponsor relationship unowned.

The second trade-off is payments. Attach can live inside the SaaS quota or carry a separate quota line. Fold it in and attach reliably lags 22–34 points behind vendors who quota it separately — and in a category where quarterly residential contracts at $98–$220 per visit make ACH/card the operational default, an attach rate below ~65% forfeits a large slice of available LTV gross profit.
The recommended architecture keeps RevOps reporting to the CRO and makes three dashboards non-negotiable: roll-up acquisition pipeline, payment-attach and residual reconciliation, and AI module attach. Those three are the operational heartbeat of the model.
Common pitfalls and how to avoid them
No roll-up pipeline tracking. The signature failure. If RevOps cannot name which sponsor acquired which Independent operator this month, the vendor cannot mobilize the onboarding overlay inside the 90-day window, and 40–80 migrations per Multi-Branch contract per year evaporate. Fix: a weekly roll-up pipeline review sourced from public M&A trackers and sponsor relationships, feeding named migration workflows.
Payments not separately quota'd. Attach lags 22–34 points when it rides inside SaaS quota. Fix: carry payment volume as its own quota line at Solo and Independent Branch, pay the 10–15 bps trailing residual for 24 months, and target 70–80% attach within 60 days of go-live.

Solo and Multi-Branch on one comp plan. A 9-to-32-day cycle and a 180-to-540-day cycle cannot share ramp, draw, or accelerators. Reps arbitrage toward the deal that pays fastest and the other segment starves. Fix: separate plans, separate ramp curves, separate draws, and a $60k–$100k draw only on Multi-Branch.
Orphaned AI attach. AI route optimization delivers a 15–25% labor-efficiency lift and pays back its $320–$880 per branch per month subscription in 2–4 months at 15–30 route scale — but with no CSM attach comp, activation slips 9–14 months. Fix: give CSMs explicit AI-tier expansion credit (100% expansion credit plus a 1.4x accelerator on tier upgrades) and instrument the attribution so the payback is visible to the buyer.
Confusing a live write for a landed migration. An acquisition-onboarding overlay should be paid on *confirmed* on-time migration, not on a scheduled kickoff. Fix: tie the $8k–$22k per-company payout to verified go-live within 90 days of roll-up close.
Related questions
How is pest control vertical SaaS different from HVAC or lawn-care SaaS?

The mechanics rhyme, but pest control is more roll-up-driven at the top: PE consolidators dominate Multi-Branch net-new, and quarterly recurring residential contracts make payments attach an operational default rather than an upsell.
At what ARR do I need a dedicated PE Roll-up Channel team?
Around $30M+ ARR. Below that, Multi-Branch AEs can absorb the motion; above it, the missed migrations and unowned sponsor relationships cost more than the VP, overlay AMs, and onboarding team you would hire.
What payment-attach rate signals a healthy model?
70–80% within 60 days of go-live. The recurring-billing residential base makes ACH/card the default, so anything below ~65% leaves a meaningful share of LTV gross profit unmonetized.
How should I weight expansion versus new logo in the forecast?
Above roughly 3,000 customer firms, weight 65% expansion / 35% new logo. Route growth, technician adds, payments, and AI upgrades compound faster than net-new logo capacity at that scale.
What is the fastest-growing ARPU lever in 2027?

The AI stack — route optimization, AI quoting, and agentic chat CSR — carrying 22–38% incremental ARPU and paying back a branch subscription in 2–4 months at typical Independent Branch route counts.
FAQ
What is the right NRR target for pest control vertical SaaS by segment? Solo 102–108%, Independent Branch 108–114%, and Multi-Branch 118–128%, with a healthy composite around 118%. Expansion comes from route and technician growth, payments, AI modules, and portal/recurring-billing activation rather than seat expansion.
What share of Multi-Branch new logos come from PE roll-ups? Roughly 65% in recent cohorts. Consolidators such as Rollins, Rentokil (Terminix), Anticimex, Aptive, Moxie, and Hawx run continuous acquisition pipelines, so winning the parent contract inherits its acquisition pipeline automatically.
How should comp work for the PE Roll-up Channel team?

A VP PE Roll-up Channel reports to the CRO, with overlay account managers (OTE $220k–$320k, 55/45) variable on roll-up pipeline ARR and per-company migration revenue, plus an acquisition-onboarding overlay (OTE $135k–$180k, 75/25) paying $8k–$22k per company migrated on time.
What payment-attach rate should I target, and why does it matter? 70–80% within 60 days. Quarterly residential service contracts at $98–$220 per visit make ACH/card attach the operational default; below ~65% the vendor forfeits a large slice of available LTV gross profit that competitors capture.
When does an AI route-optimization module pay for itself? At 15–30 routes, the 15–25% labor-efficiency lift pays back the $320–$880 per branch per month subscription in 2–4 months. CSMs must instrument that attribution so the buyer sees the payback and activates faster.
What pipeline coverage should each segment carry? About 3.2x for Solo, 4.2x for Independent Branch, and 4.6x for Multi-Branch top-of-funnel (near 3.0x at Stage 2). Multi-Branch coverage runs slightly below comparable enterprise verticals because deal volume is lower at similar win rates.
Sources
- https://www.pctonline.com/
- https://investor.rollins.com/
- https://www.rentokil-initial.com/investors
- https://www.npmapestworld.org/
- https://www.bvp.com/atlas/state-of-the-cloud
- https://www.forrester.com/
- https://www.ibisworld.com/united-states/industry/pest-control/
- https://www.servicetitan.com/
- https://www.workwave.com/pestpac/
Related on PULSE
- Revenue Architecture for Pest Control Field Service Software in 2027 (PE Roll-Up Wave, Termite Bond Recurring, Commercial Account Lock-In)
- Sales Manager Span of Control Benchmarks in 2027
- Revenue Architecture for Vertical SaaS for HVAC + Plumbing in 2027 (Financing Attach, PE Roll-up)
- Revenue Architecture for Vertical SaaS for Lawn Care + Grounds Maintenance in 2027 (Recurring Contracts, PE Roll-up)
- Revenue Architecture for Vertical SaaS for Property Management in 2027 (Payments, RM AI, NMHC Top 50)
- Revenue Architecture for Vertical SaaS for Dental Practices in 2027 (DSO, Distributor Channel, NRR)
This page will be disappearing soon. Save it to your device for $1 — or read it free while it is here.
@Kory-White- · if Venmo asks, the last 4 of my number are 2012
This page is gone.
This one is off the shelf now. $1 keeps it on your phone for good — the whole page, pictures and diagrams included.
 pulse-revenue-architectureRevenue Architecture for Compliance Training Software — The Complete Operator Guide in 2027
 pulse-revenue-architectureHow do you architect revenue operations for a fleet management company in 2027?
 pulse-revenue-architectureRevenue Architecture for EHS Software — The Complete Operator Guide in 2027
 pulse-revenue-architectureHow to roll out a new sales methodology across 100+ reps in 2027
 pulse-revenue-architectureHow to structure a partnerships team for global channel expansion in 2027
 pulse-revenue-architectureInbound Lead Routing Architecture for SaaS in 2027
 pulse-revenue-architectureRevenue Architecture for K-12 School Nutrition + Foodservice Software in 2027 (Universal Free Meals Expansion, CEP 25% ISP Threshold, Sysco + US Foods Distributor Co-Sell)
 pulse-revenue-architectureHow do you architect revenue operations for a construction tech company in 2027?
 pulse-revenue-architectureSDR/BDR Comp Plan for SaaS in 2027
 pulse-revenue-architectureHow do you architect revenue operations for Mining & Natural Resources in 2027?