 Pulse Reviews and Analysis
Top 10 Homebuilding Revenue KPIs
 Curated by Kory White · Fractional CRO, CRO Syndicate
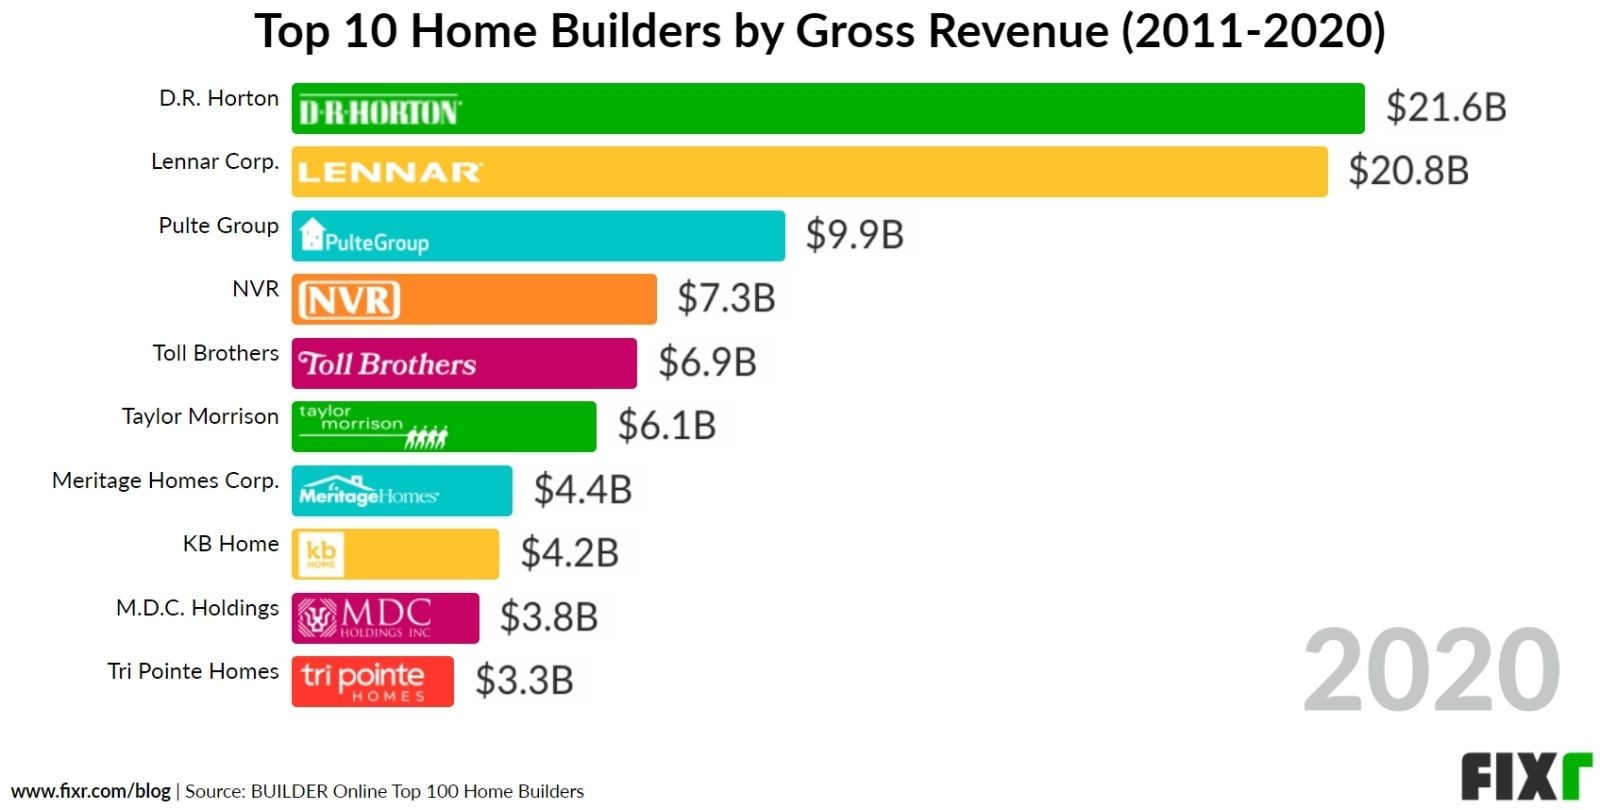
Direct Answer
Why Homebuilding Measures Differently
Homebuilding is not a subscription or transactional business. Revenue is recognized at a single point—the closing—after a 6- to 18-month cycle from lot acquisition to construction completion. This creates a unique set of measurement challenges:
- Project-based revenue recognition: Unlike SaaS with MRR, homebuilders recognize revenue at closing. Revenue is lumpy and tied to specific communities.
- Capital intensity: Land and construction costs consume the majority of revenue. Gross margins for public builders typically run in the low-to-mid 20s percent and move with the housing cycle.
- Long sales cycles: From deposit to closing, the timeline runs months. You cannot "churn" a homebuyer; they either close or cancel.
- Localized markets: A KPI like "Orders per Community" is meaningless without adjusting for location, price point, and competition.
- Regulatory and supply chain risk: Permitting delays, lumber prices, and labor shortages directly impact revenue timing and cost.
Because of these factors, standard SaaS KPIs (LTV/CAC, NRR, churn rate) are largely irrelevant. Homebuilding KPIs must account for land inventory turns, backlog health, and community-level absorption.
The Most Important KPIs to Track
1. Absorption Rate (Sales per Community per Month)
Definition: The number of net new home orders divided by the number of active selling communities, averaged over a month or quarter.
Why it matters: This is the homebuilding equivalent of "new bookings." Absorption rate tells you how fast you are selling homes in each community. A low rate suggests weak demand or overpricing; a very high rate may indicate you are underpricing and could raise prices.
Benchmark: Entry-level communities generally absorb faster than luxury communities; track your own trend by price tier.
Real vendor: Clari can track absorption trends across regions by pulling data from your CRM (Salesforce) and a homebuilder ERP.
2. Revenue per Closing (Average Selling Price)
Definition: Total revenue from closed homes divided by the number of closings in a period.
Why it matters: This is your ASP. It directly drives top-line revenue. A rising ASP signals pricing power or a shift to higher-margin product; a falling ASP may indicate discounting or a mix shift to lower-priced homes.
Benchmark: ASP varies widely by builder and market; public builders disclose it each quarter. Track yours against your own history and local comps.
Real vendor: Salesforce can automate ASP calculations per community and flag declines.
3. Backlog Margin (Gross Margin on Unsold Backlog)
Definition: (Total backlog revenue – total backlog cost) / total backlog revenue. Backlog = homes under contract but not yet closed.
Why it matters: This is your future profit visibility. A declining backlog margin signals that you are selling homes at thinner margins (e.g., using incentives, rising costs). Public builders report backlog metrics quarterly.
Benchmark: Track the trend; a backlog margin sliding well below your historical range is a warning sign.
Real vendor: Gong can analyze sales call transcripts to detect early margin erosion (e.g., reps offering discounts).
4. Customer Acquisition Cost by Community (CAC)
Definition: Total marketing + sales cost (commissions, model home expenses, advertising) divided by the number of new orders in a community.
Why it matters: Homebuilding CAC is meaningful—often thousands of dollars per home. If CAC grows as a percentage of ASP, you are overspending. Track by community to optimize media mix.
Benchmark: Keep CAC to a low single-digit percentage of ASP for entry-level homes; luxury can run higher.
Real vendor: HubSpot Marketing Hub can track CAC by campaign and community.
5. Cancellation Rate (Net to Gross Orders)
Definition: Number of canceled contracts divided by total gross orders in a period.
Why it matters: Cancellations destroy backlog and revenue predictability. A rising rate indicates buyer remorse, financing issues, or weak underwriting—and it is sensitive to mortgage rates.
Benchmark: Best-in-class builders keep cancellation rates low; the figure rises across the industry when rates spike.
Real vendor: Outreach can automate follow-ups to at-risk buyers and flag cancellation trends.
6. Construction Cycle Time (Days from Permit to Completion)
Definition: Average days from permit issuance to certificate of occupancy.
Why it matters: Longer cycles increase carrying costs (interest, labor) and delay revenue recognition. Shortening cycle time is a major margin lever and a focus of public builders' operating updates.
Benchmark: Cycle time varies by product type; custom and luxury homes take longer than production single-family.
Real vendor: Procore (construction management software) tracks cycle time per job.
7. Net Promoter Score at Closing (NPS)
Definition: "How likely are you to recommend this builder to a friend?" measured at closing.
Why it matters: NPS correlates with referrals and future orders. A low score indicates systemic issues (quality, communication, delays).
Benchmark: Aim for a strongly positive score; homebuyer referrals are a meaningful low-cost demand source.
Real vendor: SurveyMonkey (via Salesforce integration) can automate NPS surveys at closing.
8. Land Inventory Turns
Definition: Number of homes closed in a period divided by average number of owned lots (or homesites) in inventory.
Why it matters: Low turns mean you are sitting on expensive land that is not generating revenue. Very high turns may mean you are selling out too fast and missing upside. Many builders favor land-light (option) strategies to raise turns.
Benchmark: Track turns against your own capital strategy and disclosures.
Real vendor: A homebuilder ERP tracks lot inventory and turns.
9. Revenue per Employee
Definition: Total revenue divided by total headcount (including construction, sales, corporate).
Why it matters: Measures operational leverage. Large public builders run high revenue per employee partly because they outsource construction to trade subcontractors.
Benchmark: Compare against your own history; outsourcing mix heavily affects the number.
Real vendor: Tableau can visualize revenue per employee across regions.
10. Incentive Spend per Home
Definition: Total incentives (price discounts, closing cost credits, upgrades, mortgage-rate buydowns) divided by number of closings.
Why it matters: Incentives erode margin. Tracking this KPI by community and month helps you spot when you are buying demand—rate buydowns in particular have been a major incentive lever.
Benchmark: Incentive spend rises in slow markets and when mortgage rates are elevated.
Real vendor: Salesloft can automate incentive approval workflows and flag excessive discounts.

Reach Kory White, Fractional CRO: 📅 Book a Quick Call · 💼 Kory on LinkedIn · 🏢 CRO Syndicate
Real Operators
The public homebuilders illustrate how these KPIs map to strategy:
- Lennar (NYSE: LEN) emphasizes an "even-flow" production and land-light model, disclosing absorption pace, ASP, gross margin, and cycle time each quarter. Disciplined land acquisition and inventory turns are central to its strategy.
- D.R. Horton (NYSE: DHI), the largest U.S. Builder by volume, focuses on affordability, high absorption pace, and construction cycle-time reduction, reporting ASP and margin alongside volume.
- Taylor Morrison (NYSE: TMHC) spans entry-level to luxury and tracks cancellation rate and customer experience (NPS) closely, given its move-up and active-adult mix.
Operationally, builders pair a CRM (Salesforce) with construction management (Procore), forecasting (Clari), and BI (Tableau or Power BI). Verify any specific ASP, margin, or cycle-time figure against the builder's latest 10-K or quarterly release before citing it, since these move with the housing cycle.
Failure Modes
Three common mistakes when tracking homebuilding KPIs:
- Ignoring community-level granularity: Aggregating absorption rate across all communities hides a struggling subdivision. Always break KPIs down by community, price point, and region.
- Confusing backlog with revenue: Backlog is not guaranteed revenue. A high backlog margin is meaningless if cancellation rates spike. Track backlog margin *and* cancellation rate together.
- Over-indexing on ASP: Raising prices to boost ASP can crush absorption. Use buyer price-sensitivity analysis to understand the trade-off before pushing price.
Reporting Cadence
- Daily: New orders, cancellations, and deposits. Use Salesforce dashboards for real-time visibility.
- Weekly: Absorption rate, incentive spend per home, and construction cycle time. Review in Monday stand-ups.
- Monthly: Revenue per closing, backlog margin, CAC by community, and NPS. Share with regional VPs.
- Quarterly: Land inventory turns, revenue per employee, and year-over-year trends. Present to the board.
- Annual: Full P&L, balance sheet, and strategic review. Use Clari for revenue forecasting.
30-60-90
First 30 days: Audit your current KPI stack. Pull 12 months of data for absorption rate, backlog margin, and cancellation rate. Set up a Salesforce dashboard with these three KPIs. Flag any community with weak absorption or elevated cancellation.
Days 31–60: Implement weekly reporting for incentive spend and construction cycle time. Train sales and operations teams on the definitions. Use Gong to analyze a sample of sales calls for discount patterns. Run a structured review on your top at-risk backlog deals.
Days 61–90: Roll out community-level CAC tracking. Set quarterly targets for land inventory turns aligned to your capital strategy. Present findings to leadership with a 90-day action plan. If backlog margin is sliding, recommend price or cost adjustments.
FAQ
What is the difference between absorption rate and orders per community? Absorption rate is orders per community *per month*, while orders per community is a raw count without time normalization. Always use absorption for trend analysis.
How do I calculate backlog margin? Use the contract price minus estimated total cost (land + construction + overhead) for each home in backlog. Divide by contract price.
What is a healthy cancellation rate for entry-level homes? Lower is better, and first-time buyers are more sensitive to interest-rate changes and inspection issues, so the rate moves with mortgage rates.
Should I track CAC per lead or per closing? Per closing. Lead-level CAC is misleading because many leads never convert. Use HubSpot to attribute marketing spend to closed homes.
How often should I update land inventory turns? Quarterly. Land acquisition and development cycles are long; monthly updates add noise.