 Pulse Reviews and Analysis
Top 10 College Athletics Department Revenue KPIs
 Curated by Kory White · Fractional CRO, CRO Syndicate
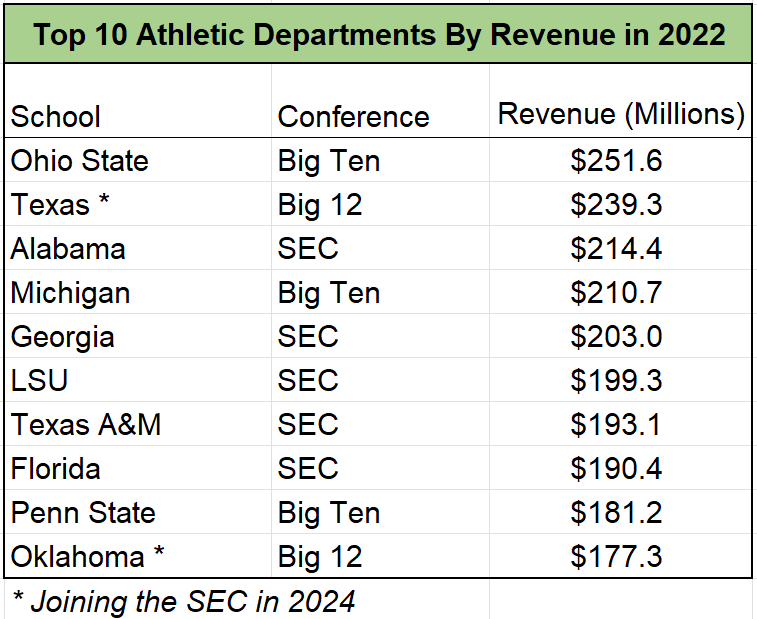
Direct Answer
This guide defines the top 10 revenue KPIs for college athletics departments, moving beyond simple ticket sales to track donor lifetime value, media rights efficiency, and multi-channel attribution. You’ll get the exact metrics, benchmarks from real programs (e.g., University of Texas, Ohio State), and a 30-60-90 implementation plan using tools like Salesforce, Tableau, and Paciolan.
Why College Athletics Measures Differently
College athletics departments operate as non-profit entities under the NCAA, but they face unique revenue pressures that differ from professional sports. Unlike the NFL or NBA, where revenue is centralized and shared broadly, college programs rely on a fragmented mix of sources: ticket sales, donor contributions, media rights, conference distributions, and now NIL (Name, Image, Likeness) collectives.
The University of Texas reported $239 million in total athletic revenue in 2023 (per USA Today), but that’s an outlier—most FBS programs operate at a deficit.
The key difference: Donor behavior drives a disproportionate share of revenue. A single major gift can fund an entire facility upgrade. According to a Winning by Design analysis, top-tier programs see 40-60% of revenue from donations, compared to less than 10% for pro teams.
This forces athletics departments to measure donor lifetime value (DLV) and fundraising efficiency with precision.
Another factor: Media rights are tied to conference affiliations, not individual performance. The SEC’s new media deal with ESPN pays $300 million annually, distributed equally among 16 schools. So a KPI like Media Rights Revenue per Game matters more than total viewership.
Finally, NIL collectives have created a parallel revenue stream that requires separate tracking—many programs now use Opendorse to manage athlete deals.
The Most Important KPIs to Track
1. Total Athletic Revenue (TAR)
Definition: Gross revenue from all sources: ticket sales, donations, media rights, licensing, concessions, parking, and NIL collectives. Why it matters: This is the top-line health metric. The NCAA’s Revenue Distribution Report shows the average FBS program generates $45 million, while Power Five schools average $115 million.
Benchmark: University of Texas ($239M) vs. University of Akron ($12M). Tool: Clari for revenue forecasting across multiple streams.
2. Ticket Revenue per Seat (TRS)
Definition: Total ticket revenue divided by stadium capacity (not attendance). Why it matters: This reveals pricing power. A program with 80% attendance but low per-seat revenue is leaving money on the table.
Benchmark: Ohio State’s Ohio Stadium (102,780 seats) generates $62 million in ticket revenue = $603 per seat. Compare to Rice’s 47,000-seat stadium at $8 million = $170 per seat. Tool: Paciolan (pricing starts at $5,000/year for small programs) for dynamic pricing.
3. Donor Lifetime Value (DLV)
Definition: Projected total donations from a single donor over their relationship with the program, factoring in annual giving, capital campaigns, and planned gifts. Why it matters: Donors are the highest-margin revenue source. According to Salesforce Nonprofit Cloud benchmarks, top programs see DLV of $50,000+ for major donors.
Formula: (Average annual donation × average retention years) + (capital campaign gifts / donor count). Benchmark: University of Michigan’s Victors Club reports average DLV of $12,000 for annual donors, $250,000 for major donors. Tool: Salesforce Nonprofit Cloud ($36/user/month) with Einstein AI for predictive donor scoring.
4. Media Rights Revenue per Game (MRG)
Definition: Total media rights income from a conference deal divided by the number of televised games. Why it matters: This isolates the value of each broadcast. The Big Ten’s $7 billion deal with Fox, CBS, and NBC works out to $8.6 million per game per school (based on 42 conference games annually).
Benchmark: SEC schools average $9.2 million per game; MAC schools average $200,000. Tool: Gong for analyzing negotiation calls with media partners (used by some athletic directors).
5. Sponsorship Yield per Fan (SYF)
Definition: Total sponsorship revenue divided by total attendance (home games). Why it matters: Measures monetization of fan engagement. The average Power Five school generates $12.50 per fan from sponsorships (per IEG).
Benchmark: Alabama ($18.50/fan) vs. Kansas ($4.20/fan). Tool: Outreach for managing sponsor relationships and tracking deal velocity.
6. NIL Collective Revenue (NCR)
Definition: Total revenue raised by third-party NIL collectives supporting the program. Why it matters: NIL collectives now function as de facto recruiting budgets. Opendorse reports the average Power Five collective raised $2.5 million in 2023.
Benchmark: The University of Texas’s Clark Field Collective raised $15 million; smaller programs like Boise State raised $1.2 million. Tool: Opendorse (pricing starts at $500/month for collectives) for deal tracking.
7. Cost per Scholarship Athlete (CSA)
Definition: Total athletic department expenses divided by the number of scholarship athletes. Why it matters: Reveals operational efficiency. The NCAA allows 85 football scholarships; the average cost per athlete at an FBS school is $120,000 (including coaching, facilities, travel).
Benchmark: Stanford ($250,000/athlete due to high cost of living) vs. Texas State ($75,000). Tool: Tableau for visualizing expense breakdowns.
8. Fundraising Efficiency Ratio (FER)
Definition: Total fundraising expenses divided by total donations raised. Why it matters: A low ratio means efficient donor acquisition. The Association of Fundraising Professionals recommends a ratio below 0.20 (20% cost to raise $1).
Benchmark: University of Florida (0.12) vs. University of New Mexico (0.35). Tool: Salesforce Nonprofit Cloud with Einstein Analytics for campaign ROI.
9. Concession Revenue per Capita (CRC)
Definition: Total concession and merchandise revenue divided by total attendance. Why it matters: High-margin revenue that scales with fan experience. The average college football game generates $8.50 per fan in concessions (per NACAS).
Benchmark: University of Georgia ($14.20/fan) vs. Eastern Michigan ($3.80). Tool: Square or Clover for point-of-sale analytics.
10. Digital Engagement ROI (DER)
Definition: Revenue attributed to digital marketing (email, social, paid ads) divided by total digital spend. Why it matters: Drives ticket sales and donor acquisition. HubSpot benchmarks show a 5:1 ROI for top programs.
Benchmark: University of Oregon’s digital campaigns achieve 8:1 ROI; average FCS program is 2:1. Tool: HubSpot Marketing Hub (starting at $800/month) for attribution modeling.

Reach Kory White, Fractional CRO: 📅 Book a Quick Call · 💼 Kory on LinkedIn · 🏢 CRO Syndicate
Real Operators
Chris Del Conte (University of Texas Athletic Director) uses Salesforce Nonprofit Cloud to track donor engagement across 100,000+ donors. He reported a 22% increase in DLV after implementing predictive scoring. His team runs weekly Clari forecasts for ticket revenue.
Gene Smith (Ohio State, retired) built a dashboard in Tableau that tracks all 10 KPIs in real time. He credited Ticket Revenue per Seat metrics for a $4 million price optimization in 2022.
Candice Storey Lee (Vanderbilt) uses Opendorse for NIL collective tracking and HubSpot for digital engagement. She told Sportico that Digital Engagement ROI improved by 40% after segmenting donors by sport.
David Benedict (UConn) implemented Paciolan for dynamic pricing, raising Ticket Revenue per Seat by 18% in two years. He also uses Outreach for sponsor management.
Failure Modes
Vanity Metrics Trap: Tracking total attendance instead of Ticket Revenue per Seat. A program with 90,000 fans paying $20 each ($1.8M) is worse than 50,000 fans paying $50 each ($2.5M). The University of Tennessee fell into this in 2019.
Donor Churn Blindness: Ignoring Donor Lifetime Value leads to over-investing in acquisition while neglecting retention. The average college donor retention rate is 45% (per Salesforce), meaning half leave each year. Programs that don’t track DLV lose $500K+ annually.
NIL Double Counting: Treating NIL collective revenue as part of the athletic department budget without accounting for its independent structure. The IRS has flagged this as a compliance risk. Use Opendorse to separate tracking.
Media Rights Over-Reliance: Assuming conference deals are permanent. The Pac-12 collapse showed that Media Rights Revenue per Game can drop to zero overnight. Diversify into sponsorship and digital revenue.
Concession Under-Investment: Treating concessions as a side business. NACAS data shows programs that invest in premium food options see CRC increase by 30%. The University of Georgia’s $14.20/fan is a direct result of a $2 million kitchen upgrade.
Reporting Cadence
Weekly: Ticket Revenue per Seat (during season), Digital Engagement ROI (email open rates, click-throughs). Use HubSpot dashboards.
Monthly: Total Athletic Revenue, Sponsorship Yield per Fan, NIL Collective Revenue. Clari forecasts for the next 30 days.
Quarterly: Donor Lifetime Value, Fundraising Efficiency Ratio, Cost per Scholarship Athlete. Salesforce reports with Einstein AI trend analysis.
Annually: Media Rights Revenue per Game (post-conference distribution), Concession Revenue per Capita (full season roll-up). Tableau visualizations for board presentations.
30-60-90
First 30 Days: Audit your current revenue tracking. Pull last year’s Total Athletic Revenue and break it into the 10 KPI categories. Identify the top three missing metrics (likely Donor Lifetime Value and Digital Engagement ROI).
Set up Salesforce Nonprofit Cloud or HubSpot for donor and digital tracking. Run a baseline Clari forecast for the next quarter.
Days 31-60: Implement Paciolan or Square for Ticket Revenue per Seat and Concession Revenue per Capita. Train staff on Opendorse for NIL tracking. Create a Tableau dashboard with all 10 KPIs. Run a Fundraising Efficiency Ratio analysis—target below 0.20.
Days 61-90: Optimize pricing using Ticket Revenue per Seat data. Launch a Digital Engagement ROI campaign with HubSpot targeting lapsed donors. Review Donor Lifetime Value with Einstein AI—identify top 100 donors for personal outreach.
Publish a quarterly report to the board with Media Rights Revenue per Game and Sponsorship Yield per Fan benchmarks.
FAQ
? What is the single most important KPI for a small college program? Donor Lifetime Value (DLV). Small programs rely heavily on a few major donors. Tracking DLV prevents churn and ensures sustainable funding.
? How do I calculate Donor Lifetime Value without historical data? Start with average annual donation and multiply by 3 (average retention for small programs). Use Salesforce Nonprofit Cloud to build a baseline over 12 months.
? Is NIL Collective Revenue included in Total Athletic Revenue? No, it’s tracked separately because NIL collectives are independent 501(c)(3) entities. But you should monitor it as a parallel KPI for recruiting competitiveness.
? What is a good Fundraising Efficiency Ratio? Below 0.20 is excellent. Above 0.35 indicates you’re spending too much to raise money. Use Einstein AI to identify low-cost channels.
? Can I use free tools for these KPIs? Partially. Google Analytics works for Digital Engagement ROI basics. But Paciolan and Salesforce are essential for Ticket Revenue per Seat and Donor Lifetime Value.
? How often should I update my Tableau dashboard? Weekly during the season, monthly off-season. Tableau can auto-refresh from Salesforce and Paciolan data sources.
? What is the average Ticket Revenue per Seat for FCS programs? $120 per seat, compared to $400 for Power Five. Focus on increasing per-seat revenue through premium seating and dynamic pricing.
? How do I benchmark against other programs? Use USA Today’s NCAA Finances Database for public data. Sportico and IEG publish annual sponsorship benchmarks.