
Quarterly Goal Cascading: From Quota to Daily Activity Breakdown
 Curated byKory White · Fractional CRO · Maryland
 PULSEKNOWLEDGE LIBRARY
Quality
Certified
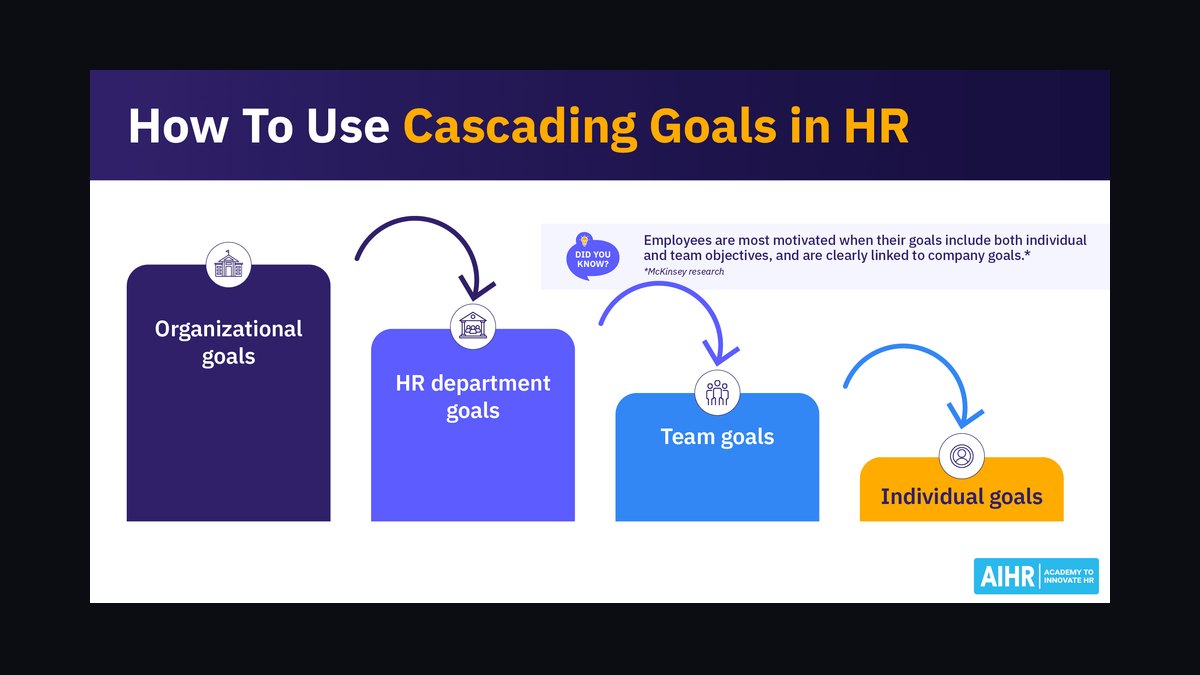
Quarterly goal cascading converts a rep's quota into a daily activity breakdown by working backward through the sales funnel: quota divided by average deal size gives wins, wins divided by win rate gives opportunities, opportunities divided by conversion rates gives leads and touches, then that total divides across the quarter's working days.
What quarterly goal cascading actually is and why it beats a dashboard
A quota is a lagging number. It tells a rep where they must land in ninety days and says nothing about what to do at 9:15 on a Tuesday. Cascading closes that gap by turning one revenue figure into a chain of intermediate commitments — pipeline created, opportunities qualified, meetings held, conversations started — and then dividing the last link by the number of selling days in the quarter. The output is a per-rep daily activity breakdown that a manager can inspect on any given morning without waiting for a deal to close.
The distinction that matters here is between a metric you *observe* and a metric you *control*. Closed-won revenue is observed. Number of new opportunities sourced this week is closer to controlled. Number of qualified conversations attempted today is almost entirely controlled. Cascading walks down that ladder until it reaches a rung the rep can actually stand on. The further down you go, the noisier each individual unit becomes and the more reliable the aggregate becomes — one dial predicts nothing, four hundred dials predict a fairly narrow band of meetings.
Why it beats simply staring at a pipeline dashboard: a dashboard is diagnostic after the fact, and by the time coverage looks thin in week seven of a thirteen-week quarter, the sales cycle has already eaten the recovery window. If the average cycle is sixty days and the quarter is ninety, then anything not in pipeline by roughly day thirty cannot close in-quarter. That single arithmetic fact is the strongest argument for cascading: the deadline for *activity* is far earlier than the deadline for *revenue*, and only a cascade makes that early deadline visible.
There is a second, quieter benefit — fairness in coaching conversations. When a rep misses, the conversation without a cascade is "you missed your number," which is unfalsifiable and demoralizing. With a cascade, the conversation becomes "you committed to twelve new qualified opportunities a month and created five; let's look at where the funnel broke." That is a diagnosable problem. It might be that the top of funnel was thin. It might be that conversion from meeting to opportunity collapsed because targeting drifted into the wrong segment. Both are fixable; "you missed" is not.
Cascading also travels well outside pure quota-carrying roles. Customer success teams cascade net revenue retention targets into a required number of executive business reviews and expansion conversations per account tier. Partner managers cascade sourced-pipeline goals into co-selling sessions and joint account-planning calls. Marketing cascades a pipeline contribution target into required MQL volume per channel, which is the same arithmetic run through different conversion assumptions. The mechanics do not change; only the vocabulary of the intermediate steps does.
The one thing cascading is not: a productivity surveillance program. A cascade that ends at "make 100 dials" and stops there produces reps who make 100 low-quality dials. The cascade has to carry quality constraints down with the volume — which accounts, which segment, which qualification depth — or the arithmetic optimizes for the wrong thing. More on that failure mode below.
The step-by-step process, from quota to a daily Activity number
The cascade is a chain of divisions. Each step needs one input from your CRM and one honest conversion rate. Work through it in this order.
Step one — establish the true gap, not the headline quota. Start with the quarterly number, subtract what is already closed-won, and subtract only the portion of committed pipeline you would genuinely bet on. If quota is $250,000, closed-won is $40,000, and there is $60,000 in late-stage deals you'd stake your own money on, the working gap is roughly $150,000. Reps who cascade from the headline quota rather than the gap end up with activity targets that ignore work already banked.

Step two — convert gap to wins needed. Divide the gap by average deal size, using the *median* of the last four quarters rather than the mean where a single outlier deal skews things. A $150,000 gap against a $50,000 median deal is three wins.
Step three — convert wins to qualified opportunities. Divide by the rep's own historical win rate from qualified-stage forward, not the team average. A rep at 25% needs twelve qualified opportunities to produce three wins. A rep at 15% needs twenty. This is where cascades stop being one-size-fits-all: two reps on the same quota can owe wildly different pipeline.
Step four — apply the cycle-length filter. Any opportunity created after (quarter length minus average cycle length) cannot close in-quarter. With a 60-day cycle in a 90-day quarter, opportunities created after roughly day 30 are next quarter's revenue. So those twelve opportunities are not spread over thirteen weeks — they are compressed into the first four to five. This step is the one most teams skip, and skipping it is why the math looks achievable in January and impossible in March.
Step five — convert opportunities to earlier-funnel units. Walk back through each stage transition you actually track: opportunity ← discovery meeting ← positive reply ← contacted account. If half of discovery meetings become qualified opportunities, twelve opportunities need twenty-four meetings. If one in five sequenced accounts yields a meeting, that's 120 accounts worked.
Step six — divide by real selling days. A quarter is roughly 65 working days, but subtract holidays, company meetings, training, PTO, and the quarter-end scramble where nobody prospects. Sixty is generous; fifty to fifty-five is honest. Divide the top-of-funnel requirement by that figure and you have the daily Activity number.

Step seven — sanity-check against a time budget. Multiply each daily unit by how long it genuinely takes. If the cascade demands thirty conversations, four discovery calls, and two proposals a day, add up the hours. If the total exceeds a realistic selling day, the cascade is telling you something true: the quota is not reachable through activity alone, and the fix is a different mix — larger deals, better targeting, more inbound, or a renegotiated number.
Step eight — write it down where both parties can see it. A cascade that lives in a rep's head is a wish. Put the chain in a shared document or CRM report with every assumption visible: the deal size used, the win rate used, the conversion rates used. When reality diverges, you want to know which assumption broke, and you can only know that if you wrote it down before the quarter started.
Costs, timelines, and the ranges you should actually expect
The out-of-pocket cost of cascading is close to zero — it is arithmetic over data most teams already own. The real costs are time and data quality, and both are routinely underestimated.
Setup time. For a single rep with clean CRM history, building a first cascade takes about an hour: pulling win rate, deal size, and cycle length, then walking the divisions. For a team of ten, budget a half-day workshop plus a few hours of RevOps prep to pull per-rep historicals. For an organization standing this up across multiple segments and motions for the first time, two to four weeks is realistic — most of that spent discovering that stage definitions are inconsistent between reps, which makes conversion rates meaningless until fixed.

Ongoing time. Fifteen to twenty minutes per rep per week for the check-in, plus an hour of manager prep for a team review. Quarterly, budget a half-day to rebuild cascades with fresh conversion data. If your weekly cadence is costing more than that, the tracking is too manual and should move into a saved CRM report.
Data-quality cost, the one that bites. Cascades are only as good as stage hygiene. If reps mark opportunities "qualified" inconsistently, your conversion rate is noise and every downstream number inherits the error. Expect to spend real effort on stage exit criteria — written definitions of what must be true to advance — before the arithmetic is trustworthy. Teams that skip this get cascades that look precise and are not.
Sample-size ranges. A rep who closes four deals a quarter has sixteen data points a year; their personal win rate has enormous error bars. Rule of thumb: below roughly twenty to thirty closed opportunities, blend the rep's rate with the segment average rather than treating their personal number as gospel. High-velocity SMB reps closing dozens of deals a quarter can use their own rates confidently. Enterprise reps closing three or four a year usually cannot, and their cascades should lean on team or segment benchmarks with wider tolerance bands.
Typical shape by motion. Rather than quoting invented benchmarks, measure your own — but the structural pattern is consistent. High-velocity transactional motions produce short cycles, small deals, many opportunities, and daily activity numbers in the dozens; the cascade there is dominated by volume and the daily breakdown is genuinely daily. Enterprise motions produce long cycles, large deals, few opportunities, and daily numbers that round to fractions; those cascades should be expressed weekly or monthly, because "0.3 discovery calls per day" is not an instruction. Mid-market sits between and usually cascades cleanly to a weekly rhythm with daily prospecting blocks.

Timeline to see signal. Activity changes show up in top-of-funnel metrics within one to two weeks, in opportunity creation within three to four, and in revenue only after a full sales cycle. Judging a cascade by revenue after three weeks is judging it before the evidence exists. Set the review expectation accordingly: leading indicators weekly, pipeline monthly, revenue at cycle length.
Tooling cost. Everything described here runs on a CRM you already pay for plus a spreadsheet. Forecasting and revenue-intelligence platforms — Clari, Gong, and comparable tools — automate the tracking and surface conversion rates without manual pulls, and sales engagement platforms such as Outreach and Salesloft make the top-of-funnel activity counts self-reporting rather than self-declared. They speed the loop; none of them are prerequisites. Buy them because reporting is eating your week, not because you think a tool will produce the discipline.
Where teams get the Cascading wrong
Cascading from the headline quota instead of the live gap. Rebuilding the cascade mid-quarter from the original number ignores everything already banked or already committed and inflates the activity ask to the point where reps stop believing it. Recalculate from the current gap every time.
Using team-average conversion rates for individual reps. Averages hide the very variance the cascade exists to expose. The rep with a 35% win rate and the rep with 12% need different plans, and handing both the same daily number guarantees one is overworked and the other underprepared.

Ignoring cycle length entirely. This is the most expensive error. Teams build a beautiful cascade, spread it evenly across the quarter, and discover in week nine that the pipeline they are still creating cannot possibly close in time. The creation deadline is a hard date and it belongs on the calendar in week one.
Cascading volume without carrying quality down with it. Once "sixty touches a day" becomes the scoreboard, reps will hit sixty touches a day — against whatever accounts are cheapest to touch. The cascade must specify segment, persona, and qualification depth alongside the count. A useful guardrail: pair every volume target with a qualification standard, and review a sample of the work, not just the tally.
Treating the cascade as a contract instead of a hypothesis. The numbers are estimates built on historical rates that will drift. When actuals diverge, the correct response is to ask which assumption broke, not to accuse the rep of missing a commitment. A cascade that cannot be revised is a cascade that gets quietly ignored by week five.
Cascading only the new-business motion. Renewals, expansion, and partner-sourced pipeline all contribute to the number, and a cascade that only counts cold outbound pushes reps away from the cheapest revenue in the building. Cascade each source separately with its own conversion assumptions, then sum.

No mid-quarter trigger thresholds. "Check in weekly" without a defined action threshold produces weekly meetings where everyone agrees things look fine. Define in advance what number triggers what response — for example, if opportunity creation is more than 20% behind the pace line at the end of any week, the following week's plan shifts a fixed block of hours from deal work to prospecting. Pre-committed triggers survive optimism; judgment calls in the moment do not.
Letting the daily number become the whole job. Reps also need pipeline hygiene, internal coordination, proposal work, and thinking time. A cascade that consumes every hour leaves nothing for the work that actually advances late-stage deals, and the result is a full top of funnel with a stalled bottom.
Forgetting to close the loop at quarter end. The most valuable output of a cascade is the retrospective: which conversion rates held, which drifted, and what the next quarter's assumptions should be. Teams that rebuild from the same stale rates every quarter never improve their forecasting; teams that update produce cascades that get measurably more accurate over a year.
A decision framework for choosing the right cascade granularity
Not every team should cascade to a daily number. The right granularity is a function of cycle length, deal count, and how much of the pipeline the rep personally sources. Use these questions in order.

How many opportunities does the rep create per quarter? If it's twenty or more, daily granularity works — the law of large numbers makes the daily number meaningful. If it's five to twenty, cascade weekly with daily prospecting time blocks rather than daily counts. Below five, cascade monthly and manage by named-account plans instead of activity volume; the arithmetic on four opportunities a quarter produces false precision.
How long is the cycle relative to the quarter? If the cycle is under a third of the quarter, in-quarter activity drives in-quarter revenue and the cascade is self-contained. If the cycle exceeds half the quarter, the cascade is fundamentally about *next* quarter's revenue, and it should be framed that way or reps will correctly point out that nothing they do in March affects March.
Where does pipeline come from? If reps source most of their own, cascade all the way to outbound touches. If inbound or partners supply the majority, cascading to a dial count is theater — cascade instead to speed-to-lead, follow-up completeness, and meeting-held rates, which are the levers the rep actually controls.
Is the constraint volume or conversion? Run the cascade twice: once with current conversion rates, once with rates improved by a realistic margin. If the improved version reduces the required activity to something achievable, the bottleneck is skill and the intervention is coaching, not more dials. If even optimistic conversion leaves an impossible activity requirement, the bottleneck is capacity or targeting, and no amount of daily discipline fixes it.
A note on the honest outcome. Sometimes the cascade proves the quota is unreachable. That is not a failure of the exercise — it is the most valuable thing a cascade produces, and it surfaces in week one rather than week twelve. The right response is a documented conversation about deal size, segment, headcount, or the number itself, held while there is still time to act on it.

Adjacent workflows the cascade should connect to
Cascading does not sit alone. It is the middle of a chain that starts with capacity planning and ends with compensation, and it works far better when those neighbors are wired in.
Upstream: capacity and coverage planning. Before any rep gets a cascade, someone decided how many reps carry how much quota against what market. If total team quota divided by realistic per-rep capacity exceeds headcount, every individual cascade will come out impossible, and no amount of daily discipline fixes an arithmetic problem set two levels up. Run the cascade math at the team level during planning season and you catch the shortfall before it becomes ten individual failures.
Upstream: territory and account assignment. A cascade that demands 120 worked accounts per quarter is meaningless if the rep's territory contains eighty viable ones. Cross-check every top-of-funnel requirement against addressable account count. When the requirement exceeds supply, the answer is territory expansion or a different motion, not more touches per account.
Downstream: forecasting. A cascade and a forecast are the same model run in opposite directions. The cascade says "given the target, here is the required activity"; the forecast says "given the activity so far, here is the likely outcome." Teams that build both from one shared set of conversion rates get forecasts that reconcile with plans. Teams that build them separately get a forecast call every week where nobody can explain the discrepancy.

Downstream: enablement priorities. The cascade tells you exactly which conversion rate is costing the most. If meeting-to-opportunity is the weakest link, the training investment belongs in discovery skills, not prospecting scripts. This turns enablement from a calendar of generic sessions into a targeted response to the specific stage that is leaking.
Sideways: onboarding ramp. New reps cannot use historical personal rates because they have none. Build their cascade from segment averages, then adjust at thirty, sixty, and ninety days as their own data accumulates. The ramp cascade should also front-load top-of-funnel activity heavily, since a new rep's first quarter is almost entirely about creating the pipeline that pays off in their second.
Sideways: customer success and expansion. The same arithmetic cascades a net-revenue-retention target into required expansion conversations per account tier and required health-check coverage. Renewal-heavy teams often discover the cascade is more useful there than in new business, because the account universe is fixed and known — you can literally count the conversations required rather than estimate them.
Sideways: marketing pipeline contribution. When marketing carries a sourced-pipeline number, cascading it through channel conversion rates produces required volume per channel, which makes budget allocation a math problem instead of an argument. It also creates a shared vocabulary: when sales says pipeline is thin and marketing says lead volume is up, the cascade shows exactly which conversion step disagrees.
Sources
- Salesforce: Sales Pipeline Management Guide
- HubSpot: Sales Metrics and KPIs
- Gong Labs: Sales Research and Data
- Harvard Business Review: Sales Management Insights
- McKinsey: Growth, Marketing and Sales Insights
- Gartner: Sales Practice Insights
- Clari: Revenue Operations Resources
- Outreach: Sales Execution Resources
Related questions
How do I cascade a quota when a rep only closes three deals a year?
Skip daily activity counts entirely. With that few outcomes, personal conversion rates are statistical noise. Cascade to named-account coverage instead: which accounts, which stakeholders reached, which stages advanced by when. Manage the plan, not the volume.
Should the cascade change if the rep is ahead of pace?
Yes, but downward carefully. Recalculate from the current gap, which lowers the requirement. Keep top-of-funnel activity closer to the original level, though — cutting prospecting the moment you're ahead is how a strong Q2 turns into an empty Q3.
How often should conversion rates in the cascade be refreshed?
Quarterly for the rebuild, with a mid-quarter glance if something looks structurally off. Refreshing weekly overfits to noise; refreshing annually means you're planning with rates that no longer describe your market or your product.
Does cascading work for teams without a mature CRM?
Partially. You can cascade from deal size and win rate estimated off a spreadsheet of closed deals, but you cannot cascade past the stages you don't track. Start with the two or three transitions you can measure honestly and extend as hygiene improves.
What's the difference between a cascade and an activity quota?
A cascade derives the number from the rep's own target and conversion math and changes when those change. An activity quota is a fixed floor handed down uniformly. Cascades explain themselves; activity quotas rely on compliance.
FAQ
What exactly is quarterly goal cascading?
It is the practice of translating a quarterly revenue target into the intermediate pipeline and activity commitments required to reach it, then dividing those commitments across the quarter's selling days. The result is a per-rep breakdown that makes the quarter's demands visible on day one instead of week ten.
Which numbers do I need before I can build one?
Four: median deal size, win rate from qualified stage forward, average sales cycle length, and the conversion rate between at least one earlier stage and qualified opportunity. Everything else in the cascade is derived from those. If any of the four is unreliable, note it explicitly and widen your tolerance bands rather than pretending to precision.
How do I handle a rep whose historical data is too thin to use?
Blend their numbers with segment or team averages, weighting toward the team figure until they accumulate roughly twenty to thirty closed opportunities. Revisit the blend each quarter. This applies to every new hire and to any rep who has recently changed segment, since a territory change invalidates their prior conversion history.
What should trigger a mid-quarter revision?
Define the thresholds before the quarter starts. A common structure: if opportunity creation falls more than 20% behind pace at any week's end, the next week reallocates a fixed block of hours to prospecting. Pre-committing to the trigger matters more than the exact percentage, because in-the-moment judgment always leans optimistic.
Can cascading make quota attainment worse?
It can, if it optimizes for the wrong unit. A cascade that counts touches without specifying account quality produces high volume against low-value targets. Always pair a volume figure with a segment, persona, and qualification standard, and review a sample of actual work rather than trusting the tally alone.
Who owns the cascade — the rep, the manager, or RevOps?
RevOps supplies the conversion data and the template, the manager facilitates the build and the weekly review, and the rep owns the resulting plan. Cascades imposed entirely top-down get ignored; cascades built entirely bottom-up tend to use flattering assumptions. The shared build is what makes the number credible to both sides.
Related on PULSE
- [Top 10 team-meeting templates for quarterly sales goal alignment](/knowledge/st0758)
- [Top 10 Templates for Daily Stand-Up Sales Huddles](/knowledge/st0687)
- [The Sales Activity Metrics Reboot — 60-Min Training](/knowledge/st199)
- [The Quota and Comp Plan Communication Reboot — 60-Min Training](/knowledge/st191)
- [The SDR Daily Structure Reboot — 60-Min Training](/knowledge/st182)
- [Leveraging Social Selling: Hands-On Activity Template for a Remote Team Session](/knowledge/st0787)
This page will be disappearing soon. Save it to your device for $1 — or read it free while it is here.
@Kory-White- · if Venmo asks, the last 4 of my number are 2012
 pulse-sales-trainingsTop 10 NEAT Selling training exercises for sales managers in 2027
 pulse-sales-trainingsTop 10 new hire facilitator guides for 2027
 pulse-sales-trainingsSales Negotiation Tactics: Step-by-Step Meeting Script for Trainers
 pulse-sales-trainingsTop 10 sales enablement drills for mid-market reps in 2027
 pulse-sales-trainingsAccount Planning Sprint: 90-Minute Deep Dive into Top 5 Accounts in 2027
 pulse-sales-trainingsCold Calling Script Practice Session Guide
 pulse-sales-trainingsThe Concession-Trading Workshop: Never Give Without Getting (60-Min Training)
 stWhat is a typical sales compensation structure as a percentage of gross profit to the rep?
 pulse-sales-trainingsBuilding a Sales Mentorship Program: Template for a Department-Wide Kickoff
 pulse-sales-trainingsTop 10 Target Account Selling sales training drills for AEs in 2027