
What are the best analytics tools for SaaS revenue operations?
 Curated byKory White · Fractional CRO · Maryland
 PULSEKNOWLEDGE LIBRARY
Quality
Certified
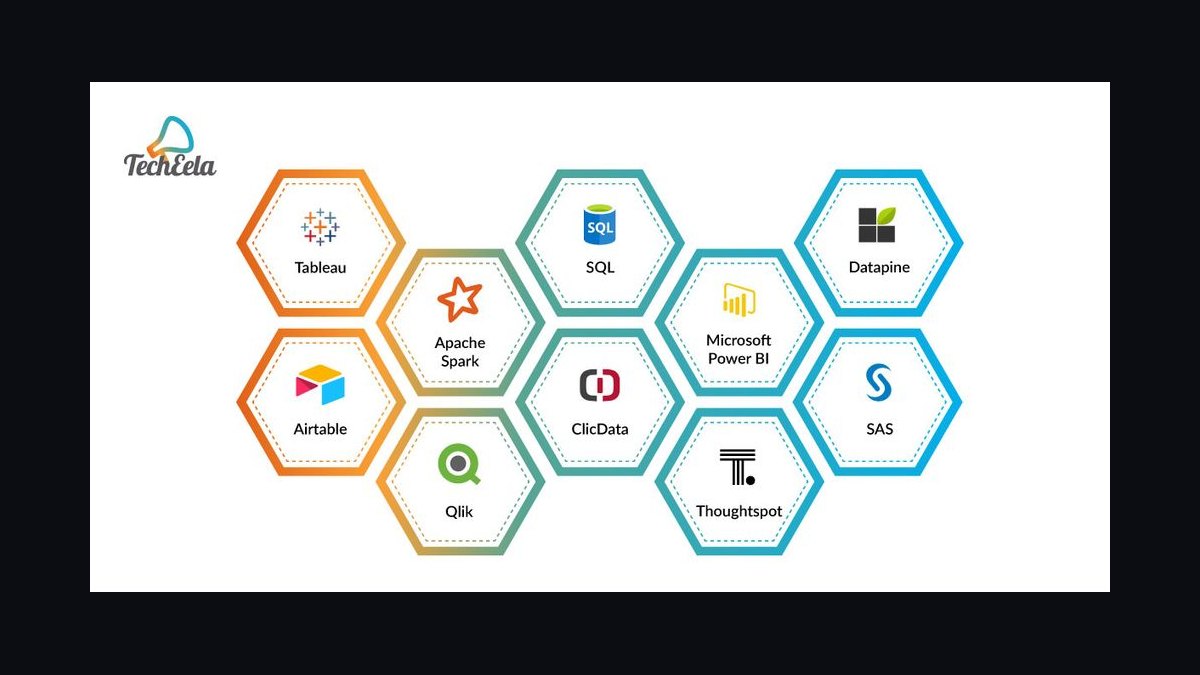
The best analytics tools for SaaS revenue operations combine three layers: product analytics (Amplitude, Mixpanel), subscription-revenue platforms (ChartMogul, Baremetrics, ProfitWell), and a business-intelligence layer (Looker, Tableau) fed by a warehouse. The right mix depends on your ARR stage, data hygiene, and whether you need forecasting, churn detection, or multi-touch attribution.
The scenario every RevOps lead walks into
Picture a Series B SaaS at $18M ARR. Sales pulls pipeline from Salesforce, finance reconciles MRR in a spreadsheet, and the CS team tracks churn in a separate health-score tool. Every Monday, three teams show up to the revenue review with three different numbers for the same quarter — and nobody can say which is right. This is the exact moment most companies go shopping for analytics tools, and it's also the moment they make the most expensive mistakes.
The problem is never a shortage of software. It's that the numbers don't agree because the definitions don't agree, the integrations are shallow, and no single system holds the source of truth. A revenue operations analytics stack has to solve that reconciliation problem first — before anyone worries about pretty dashboards. When you evaluate tools through this lens, the shortlist narrows fast: you want depth of CRM and billing integration, consistent metric calculation, and the ability to surface the same MRR figure to the CFO, the CRO, and the CS lead without three manual exports. Get that foundation wrong and the most advanced forecasting engine on the market just produces confident, well-designed, wrong answers. The tool is downstream of the data contract; treat it that way and the selection becomes far more obvious.

How the analytics stack actually works end to end
A working SaaS revenue operations stack is a pipeline, not a pile of dashboards. Raw events and records originate in three source systems: the CRM (Salesforce or HubSpot) holds deals and pipeline, the billing platform (Stripe, Chargebee, Recurly) holds subscriptions and invoices, and the product analytics layer (Amplitude, Mixpanel, Heap) holds usage and engagement. Those feeds land in a warehouse — Snowflake, BigQuery, Redshift, or Databricks — usually moved by a pipeline tool like Fivetran or Airbyte on a schedule between every few minutes and hourly.
From the warehouse, two things happen. Revenue-specific software (ChartMogul, Baremetrics, ProfitWell) computes the subscription metrics — MRR, expansion, contraction, logo and dollar churn, net revenue retention — while a BI layer (Looker, Tableau) builds custom cross-functional reports on the same clean dataset. Because both read from one warehouse, the MRR the CFO sees and the MRR the board deck shows come from an identical definition. That single-source-of-truth architecture is what kills the Monday-morning three-numbers problem.

The final leg matters as much as the ingest. Insights only create value when they close the loop back into the CRM: a churn-risk flag becomes a CS task, a stalled-deal alert becomes a manager check-in, an expansion signal becomes a sales play. If a number doesn't drive a specific action within a day, you're paying for reporting, not for revenue operations. The strongest stacks push alerts into Slack or email and write flags back to the system where reps actually work, so the analytics layer never becomes a place people have to remember to visit.
Real numbers, ranges, and what tools cost
Pricing for revenue analytics software clusters by data volume, seats, or both. Serious subscription-analytics tools generally start around $500–$1,500 per month for small teams, scale to roughly $5,000–$15,000 per month at mid-market, and run $20,000+ per month at enterprise with dedicated support. Baremetrics and ChartMogul sit at the accessible end and can connect to Stripe in an afternoon; ProfitWell offers a free core metrics tier that many early-stage teams start on. BI platforms like Looker and Tableau price separately and typically assume you already have a warehouse and someone who can model data.

Budget for the invisible line items. Onboarding and custom dashboard setup commonly run $5,000–$25,000 one-time with enterprise vendors. Then there's the infrastructure underneath: a warehouse costs roughly $500–$3,000 per month for mid-market volumes, and a pipeline/ETL tool such as Fivetran or Airbyte adds another $1,000–$5,000 per month depending on connectors and row counts. Watch for overage traps — data-storage overages, premium integration fees, and API-access charges beyond basic limits routinely add 15–30% to the sticker.
Match the spend to ARR stage. Under $5M ARR, a free-or-cheap revenue tool plus your CRM's native analytics is usually enough; focus on new MRR, churn rate, and CAC, and skip heavy BI. Between $5–50M ARR, layer in cohort retention, expansion MRR, and sales-cycle length, and a warehouse starts paying for itself. Above $50M ARR, net revenue retention, LTV by segment, and sales-efficiency ratios justify a full best-of-breed stack with a dedicated data engineer. A practical benchmark: expect 40–80 hours of data auditing before go-live, 20–40 hours of integration setup for a composable stack, and 2–5 days of initial configuration for mid-range tools versus several weeks for enterprise BI with custom pipelines.

Trade-offs: monolith versus composable, build versus buy
The central architectural decision is whether to buy one all-in-one revenue platform or assemble a best-of-breed stack. A monolith is faster to stand up and gives you one vendor to call, but you inherit whatever that vendor is weakest at — often product analytics or flexible attribution. A composable stack lets you pick the best product-analytics tool, the best subscription-metrics tool, and the best BI layer, and swap any one out later without rebuilding everything. The cost is integration complexity and ongoing maintenance you own.
Beyond architecture, weigh integration depth over integration count. A tool advertising 200 connectors is worthless if the Stripe connector can't reconcile a "closed won" CRM deal that shows no matching subscription start. Test that exact mismatch in a sandbox trial with real anonymized data before signing. Weigh metric consistency too: ask each vendor precisely how they compute MRR expansion versus contraction, logo versus dollar churn, and net revenue retention, and whether metrics are defined once and propagated everywhere. Finally, weigh who consumes the output — CFOs need board-ready views, CROs need pipeline velocity, CS leaders need health scores — so role-based dashboards and granular view/edit permissions matter more than raw feature count. Embedded analytics that surface revenue numbers inside Salesforce or Slack often beat a standalone tool nobody logs into.

Common pitfalls and how to avoid them
Over-customizing before you understand core needs. Building 50 dashboards on day one produces analysis paralysis, not clarity. Start with 5–10 metrics tied to your current stage and add complexity only after the team consistently acts on the basics. Early stage: new MRR, churn, CAC. Growth stage: cohort retention, expansion MRR, sales-cycle length. Scale-up: net revenue retention, LTV by segment, sales efficiency.
Ignoring data quality at the source. Garbage in, garbage out is brutal here. Reps log opportunities with wrong close dates, billing systems carry orphaned subscriptions from failed migrations, and product SKUs are named inconsistently across tools. Invest 40–80 hours in auditing and cleanup before full deployment, and write a data-governance doc naming who owns each field, what validation rules apply, and how often systems reconcile. Prioritize analytics software that offers built-in data-quality scoring if your hygiene is shaky.

Building dashboards without clear ownership. A KPI with no owner is a passive report. Assign a metric owner for every dashboard number — head of sales owns pipeline velocity, CFO owns cash-flow forecasts, CS lead owns net revenue retention — and run a 30-minute weekly revenue review where owners present actions, not just numbers.
Skipping a shared metric dictionary. The biggest friction in revenue operations is teams using different definitions for the same word. "Churn" might mean voluntary cancellation to CS but include failed-payment involuntary churn to finance; "customer" might mean any paying account to sales but only active subscribers to product. Before implementing any tool, convene sales, marketing, finance, and CS to document definitions, calculation methods, and data sources for at least 20 core metrics. That 10–20 hours upfront saves months of conflicting reports later, and it's the single highest-leverage thing you can do before a single dashboard is built.

Related questions
What is the difference between revenue analytics and product analytics?
Revenue analytics tracks financial metrics — MRR, churn, LTV, net revenue retention — to measure business performance. Product analytics tracks user behavior, feature adoption, and engagement. SaaS revenue operations usually needs both: a revenue tool like ChartMogul for financials and a product tool like Amplitude for usage.
Do I need a warehouse if I only have one analytics tool?
Not immediately, but building one early pays off. A warehouse becomes your single source of truth, lets you join data across CRM, billing, and product systems, and powers multiple downstream tools from one clean dataset. Many revenue platforms connect directly to Snowflake or BigQuery for near-real-time reporting.
Can free analytics tools work for an early-stage SaaS?
Yes. Free tiers like ProfitWell's core metrics or Baremetrics' entry plan cover basic MRR and churn tracking for startups under a few hundred customers. You typically outgrow them when you need longer data history, more seats, custom segmentation, or precise multi-touch revenue attribution.
How long does implementation usually take?
Simple subscription tools like Baremetrics can connect to Stripe in a few hours. Mid-range platforms need 2–5 days of configuration plus about a week of team training. Enterprise BI like Looker or Tableau with custom warehouse pipelines can take several weeks before the first reliable dashboard.
FAQ
What's the difference between revenue analytics and product analytics tools? Revenue analytics software focuses on financial metrics like MRR, churn, and LTV; product analytics examines user behavior and feature adoption. For SaaS revenue operations you generally need both — a revenue tool like ProfitWell or ChartMogul for financial data, and a product tool like Amplitude or Mixpanel for usage insight.
Do I need a separate tool for subscription billing analytics? Not always. Billing platforms like Stripe and Recurly include basic dashboards. But dedicated revenue analytics tools add deeper cohort analysis, retention curves, and forecasting that billing-native reports lack. Choose based on whether you need granular revenue modeling or just simple transaction tracking.
How do I choose between free and paid analytics tools? Free tiers work for early-stage startups with basic needs but limit data history, seats, and integrations. Paid software adds advanced segmentation, custom metrics, and API access — worth it once you pass a few hundred customers or need precise revenue attribution across channels.
Can these tools integrate with my CRM and billing system? Most modern revenue analytics tools offer native connectors for Salesforce, HubSpot, Stripe, and Chargebee, plus API and webhook support. Integration depth varies, so verify that key fields like subscription status and deal stage map correctly before committing — test the exact reconciliation cases in a trial.
What's the typical learning curve for these tools? Setup ranges from a few hours for simpler software like Baremetrics to several weeks for enterprise platforms with custom data pipelines. Most mid-range tools need 2–5 days for configuration and about a week of training, with ongoing adjustments as you refine metrics and dashboards.
How often should I review revenue analytics reports? Daily checks on core metrics like MRR, churn, and cash flow suit growth-stage SaaS, while weekly deep dives into cohort retention and expansion revenue fit most teams. Reserve LTV/CAC trend and annual-planning reviews for monthly cadences. Avoid over-reporting — focus on insights tied to specific decisions.
Sources
- https://www.g2.com/categories/subscription-analytics
- https://www.gartner.com/reviews/market/analytics-business-intelligence-platforms
- https://www.capterra.com/subscription-management-software/
- https://blog.hubspot.com/service/saas-metrics
- https://www.forrester.com/research/
- https://stripe.com/docs/billing/subscriptions/analytics
- https://www.snowflake.com/guides/what-data-warehouse
- https://www.klipfolio.com/resources/kpi-examples/saas
Related on PULSE
- [Top 10 analytics platforms for revenue operations in 2027](/knowledge/sw0032)
- [Top 10 marketing automation tools for B2B SaaS in 2027](/knowledge/sw0026)
- [Does Google Analytics 4 integrate directly with HubSpot to track form submissions and ad conversions?](/knowledge/sw0113)
- [How to set up multi-touch attribution in Google Analytics 4?](/knowledge/sw0094)
- [What are the top security tools for protecting SaaS data?](/knowledge/sw0093)
This page will be disappearing soon. Save it to your device for $1 — or read it free while it is here.
@Kory-White- · if Venmo asks, the last 4 of my number are 2012
This page is gone.
This one is off the shelf now. $1 keeps it on your phone for good — the whole page, pictures and diagrams included.
 softwareTop 10 e-signature software for business in 2027
 softwareTop 10 podcasts to listen to before choosing productivity software in 2027
 softwareCan I use HubSpot CRM for free with more than 1,000 contacts?
 softwareTop 10 YouTube channels to watch before choosing productivity software in 2027
 softwareHow do I migrate my existing customer data into HubSpot CRM without losing deal history in 2027?
 softwareTop 10 HubSpot CRM onboarding services for new teams in 2027
 softwareShould I pick HubSpot CRM over a spreadsheet once I'm tracking more than 50 leads a month in 2027?
 softwareShould I consolidate my CRM and project management tools into one platform once my team is juggling more than 20 active client projects in 2027?
 softwareTop 10 HubSpot CRM data hygiene tools in 2027
 softwareTop 10 CRM Platforms for Scaling Enterprises in 2027