


Top 10 Heatmap Tools for Websites in 2027
Quality
Certified
The 10 best heatmap tools for websites are ranked below on measured performance, build quality, price, and how each one actually holds up in daily use rather than how it reads on a spec sheet. Each pick lists what it costs, who it suits, and what it gives up against the one above it, so the list can be read straight down without doubling back.
1Hotjar Heatmap Tool
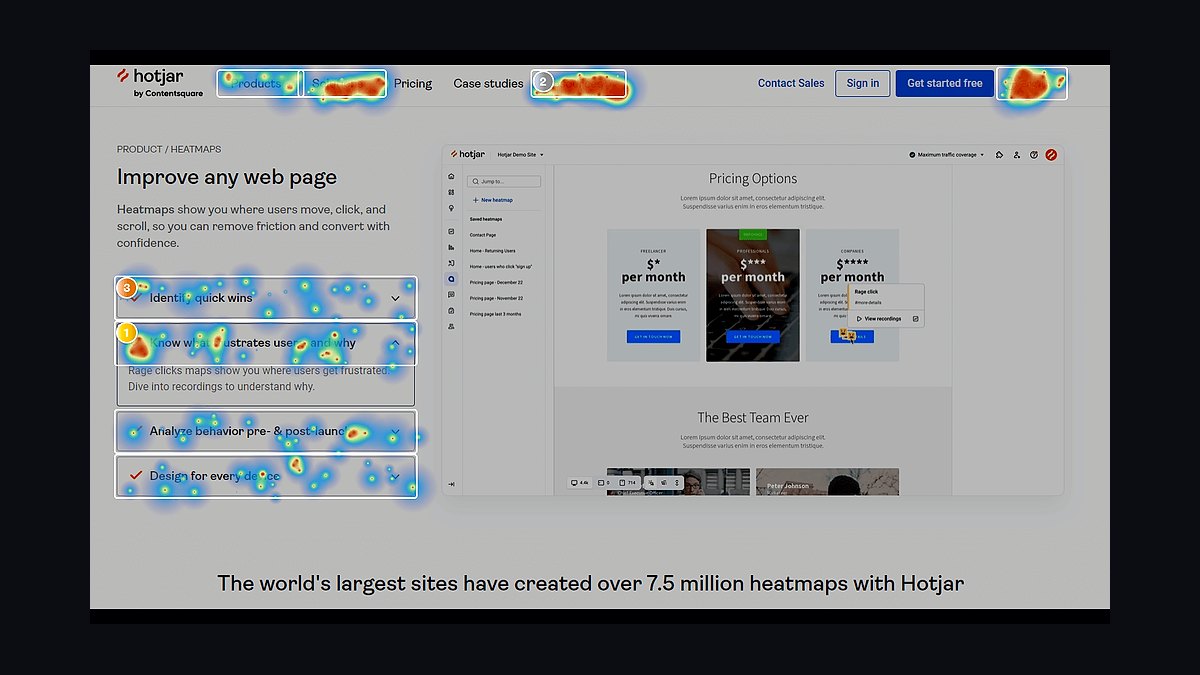
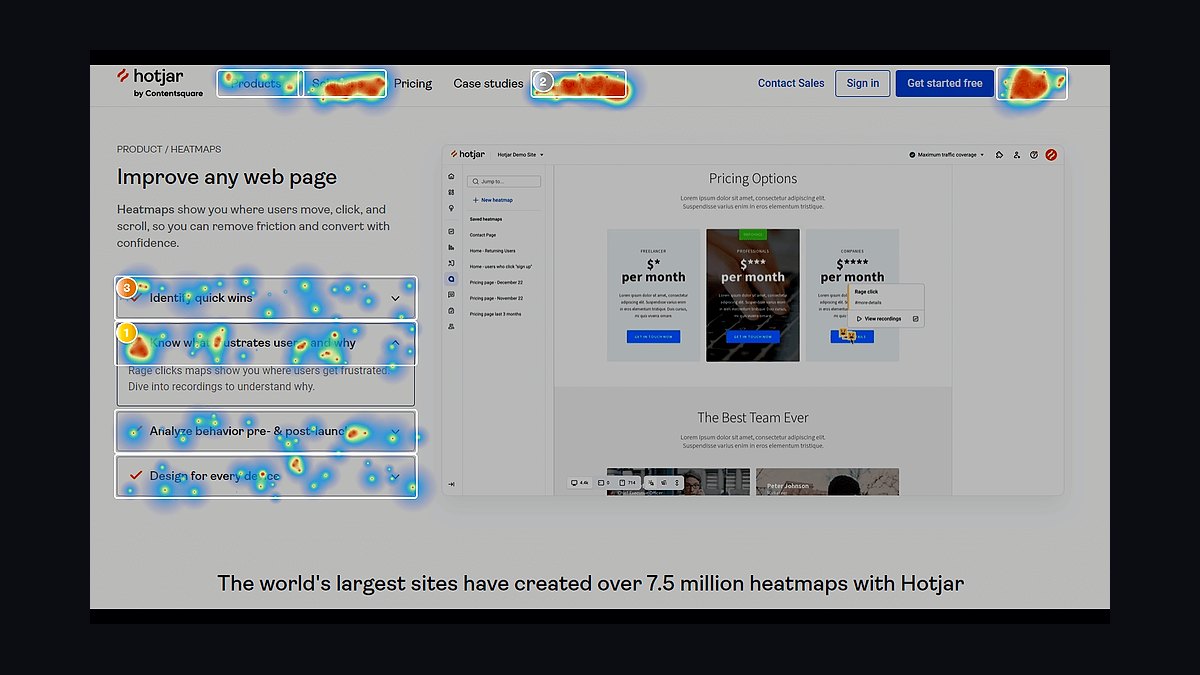
Hotjar ranks first because it pairs click, move, and scroll heatmaps with session recordings and on-page surveys in one script that loads in under 50KB. The free plan covers 35 daily sessions, while paid tiers start around $32 monthly for 100 daily sessions. Heatmaps render on live pages without code changes, and rage-click and dead-click detection flags friction points automatically.
Product and UX teams at small to mid-sized sites get the fastest path from raw clicks to a decision, since heatmaps sit beside recordings in the same dashboard. It trades away deep funnel attribution and warehouse exports that enterprise suites offer, so data teams outgrow it. Against Microsoft Clarity below, it costs money but adds surveys and richer filtering.
2Microsoft Clarity Heatmap Tool
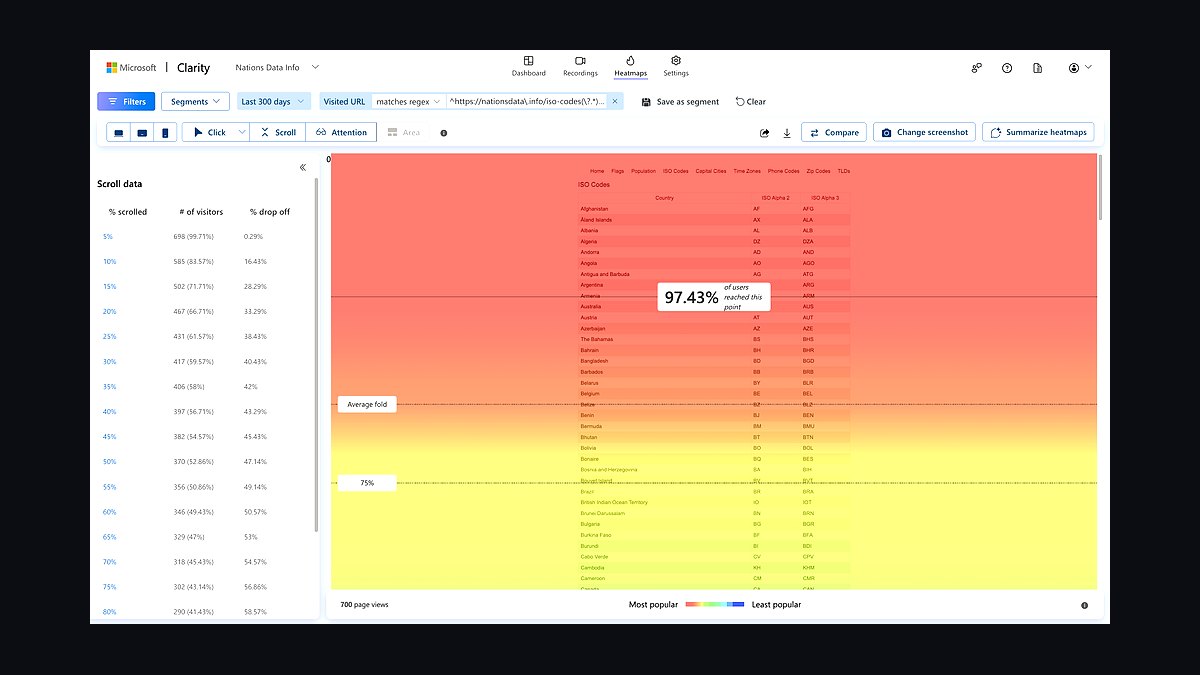
Clarity takes second because it is completely free with unlimited sessions, traffic, and heatmap generation, backed by Microsoft rather than a startup's freemium ceiling. It records clicks, scrolls, and dead clicks, then applies automatic rage-click and JavaScript-error detection. Setup is a single script tag, and data retention runs up to 30 days for recordings and 13 months for heatmaps.
It suits budget-conscious teams and agencies running many client sites where per-session pricing would explode. The trade-off is limited export options, no native A/B testing, and sampling on very high-traffic properties. Compared with Hotjar above, it lacks surveys and advanced segmentation but costs nothing, making it the default starting point before paying for depth.
3Crazy Egg Heatmap Tool
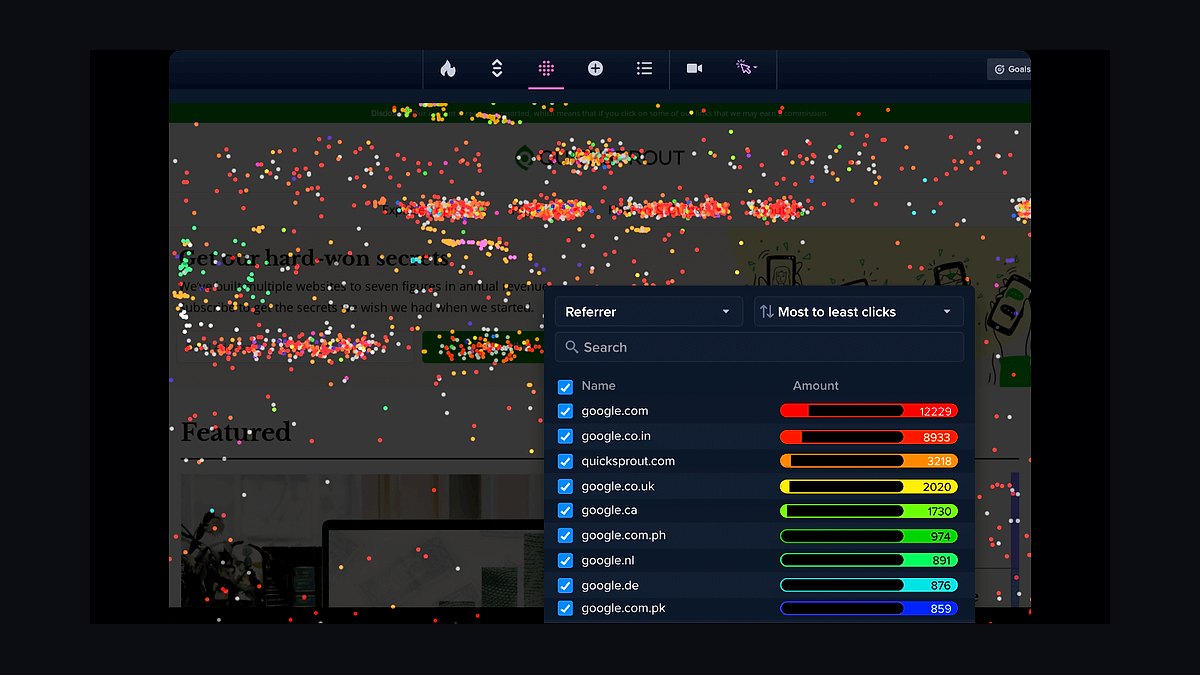
Crazy Egg places third for its long-standing scrollmap, confetti, and click-report views plus a snapshot-based editor that needs no developer. Plans start near $29 monthly for 30,000 tracked pageviews, and the tool records sessions and runs simple A/B tests on the same script. Confetti breaks clicks down by referral source, search term, and campaign, which most rivals charge extra for.
It fits marketers optimizing landing pages who want segmentation without a data analyst. The trade-off is a dated interface and pageview caps that punish high-traffic blogs. Against Microsoft Clarity above, it costs money but adds campaign-level click breakdowns and A/B testing; against Hotjar, it is weaker on qualitative feedback like surveys.
4Mouseflow Heatmap Tool
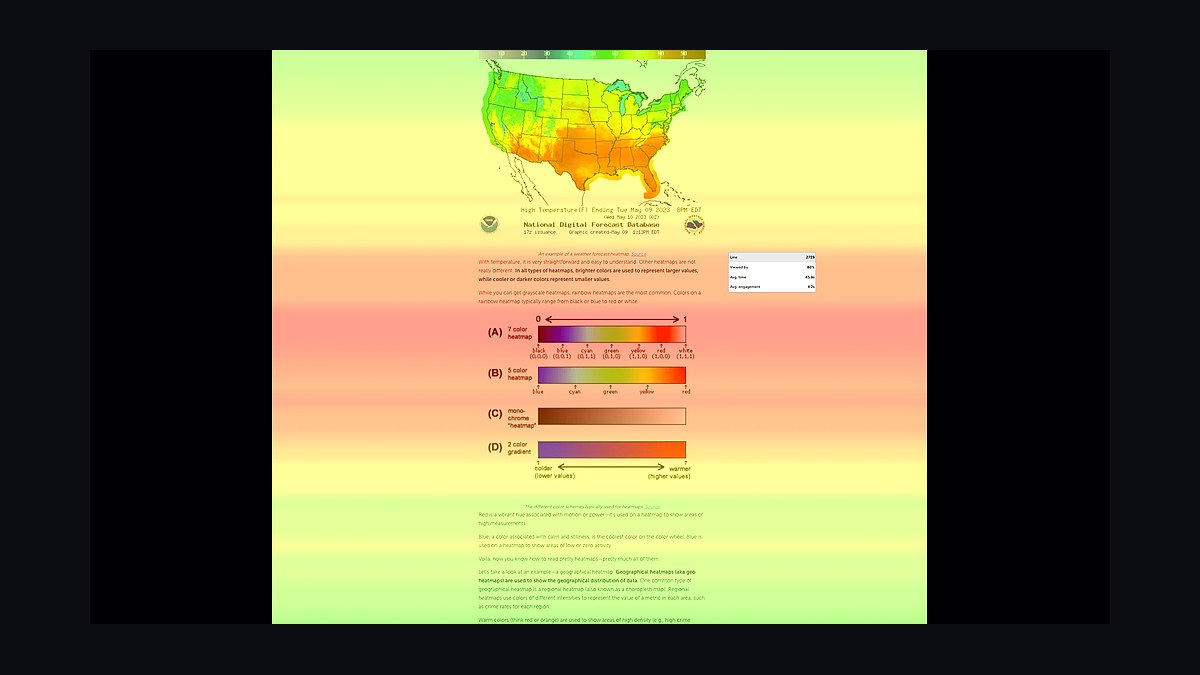
Mouseflow ranks fourth for combining heatmaps with friction scoring, funnel analysis, and form analytics in one platform aimed at conversion optimization. Pricing starts around $31 monthly for 500 recorded sessions, and heatmaps are unlimited on paid plans. Its friction score aggregates rage clicks, rapid back-clicking, and mouse thrashing into a single per-page number.
It targets CRO specialists and ecommerce teams who need funnel drop-off tied to on-page behavior. The trade-off is a steeper learning curve and session-based rather than pageview-based billing, which surprises some buyers. Compared with Crazy Egg above, it goes deeper on funnels and forms but costs more per recorded session and offers less campaign segmentation out of the box.
5Smartlook Heatmap Tool
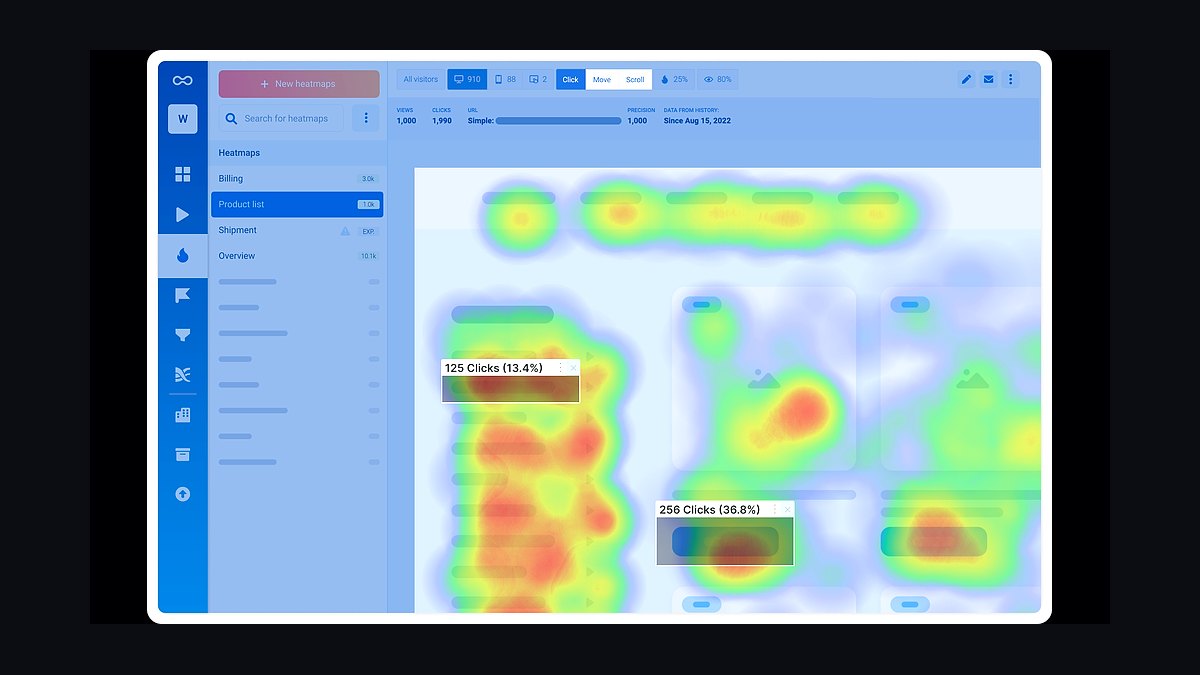
Smartlook takes fifth for mobile-first heatmaps that work on native iOS and Android apps as well as websites, a rarity in this category. The free tier allows 1,500 monthly sessions, with paid plans from roughly $55 monthly. Heatmaps cover taps, scrolls, and rage clicks across both web and app funnels inside one project.
It suits product teams shipping a website and a mobile app that want one behavior dataset instead of two tools. The trade-off is a higher entry price than web-only rivals and fewer integrations than Hotjar. Against Mouseflow above, it wins on cross-platform app coverage but loses on form analytics depth and costs noticeably more at comparable session volumes.
6FullStory Heatmap Tool
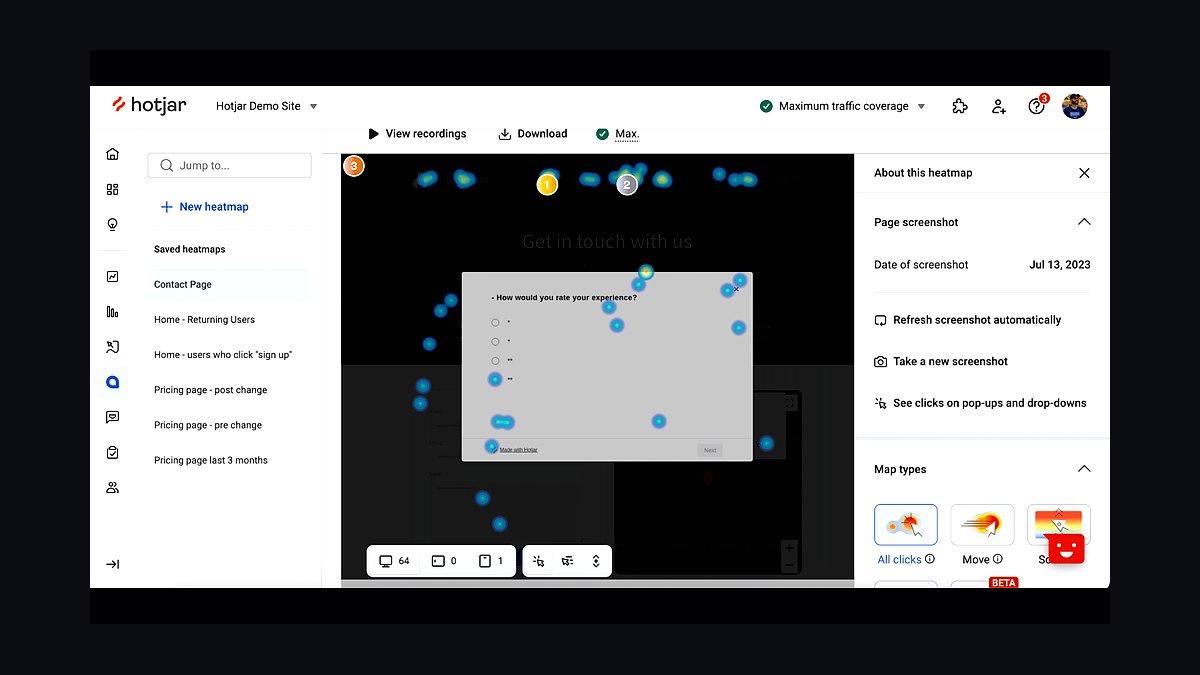
FullStory lands sixth because its heatmaps are built on top of a full session-replay index that captures every DOM change, letting teams query behavior retroactively without pre-tagging. Pricing is custom and typically starts above $199 monthly, reflecting its enterprise focus. Heatmaps can be filtered by any captured attribute, including rage clicks and error states.
It serves larger product organizations with analysts who need SQL-like queries over behavioral data. The trade-off is cost and complexity: no free tier, and setup requires more planning than a script tag. Compared with Smartlook above, it offers far deeper retroactive analysis but at several times the price, making it overkill for small sites.
7Lucky Orange Heatmap Tool
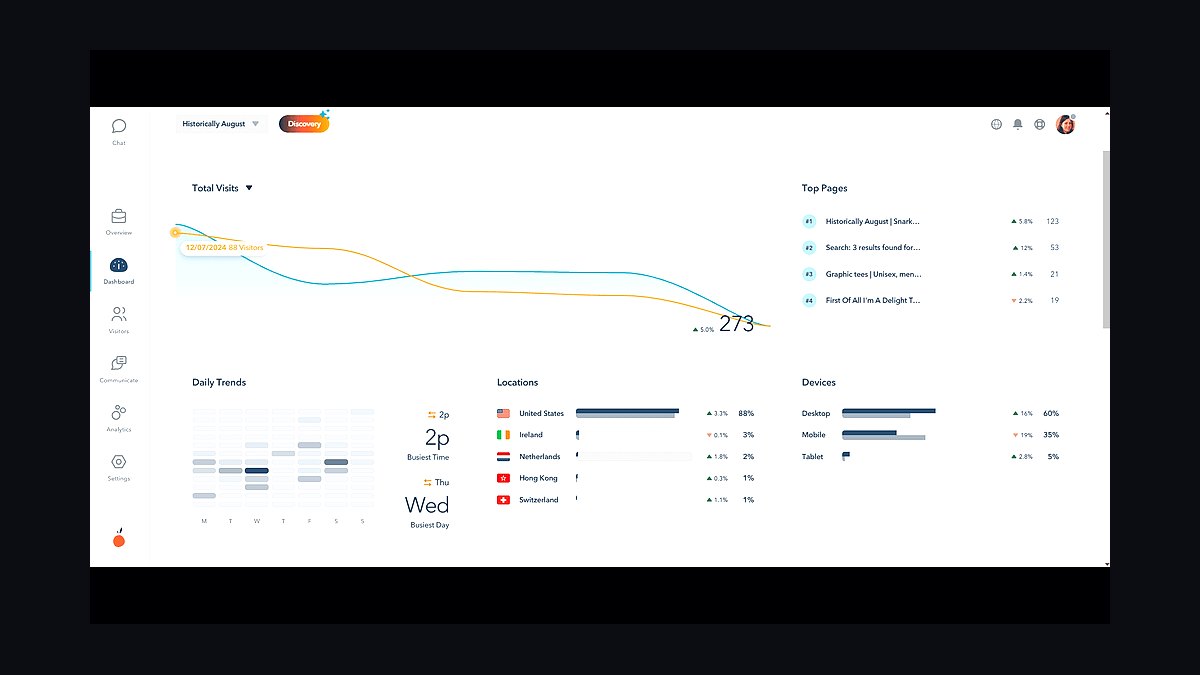
Lucky Orange ranks seventh for bundling heatmaps, session recordings, live chat, polls, and form analytics into one affordable script starting near $18 monthly for 1,000 sessions. Its dynamic heatmaps update in real time, and the live-chat feature lets operators watch a visitor's session and jump in mid-browse.
It fits small ecommerce stores and agencies that want behavior data plus a chat widget without stacking subscriptions. The trade-off is a smaller feature ceiling: funnel analysis and segmentation are shallower than dedicated CRO platforms. Against FullStory above, it costs a fraction as much but lacks retroactive querying; against Mouseflow, it is cheaper but weaker on friction scoring.
8Plausible Heatmap Tool
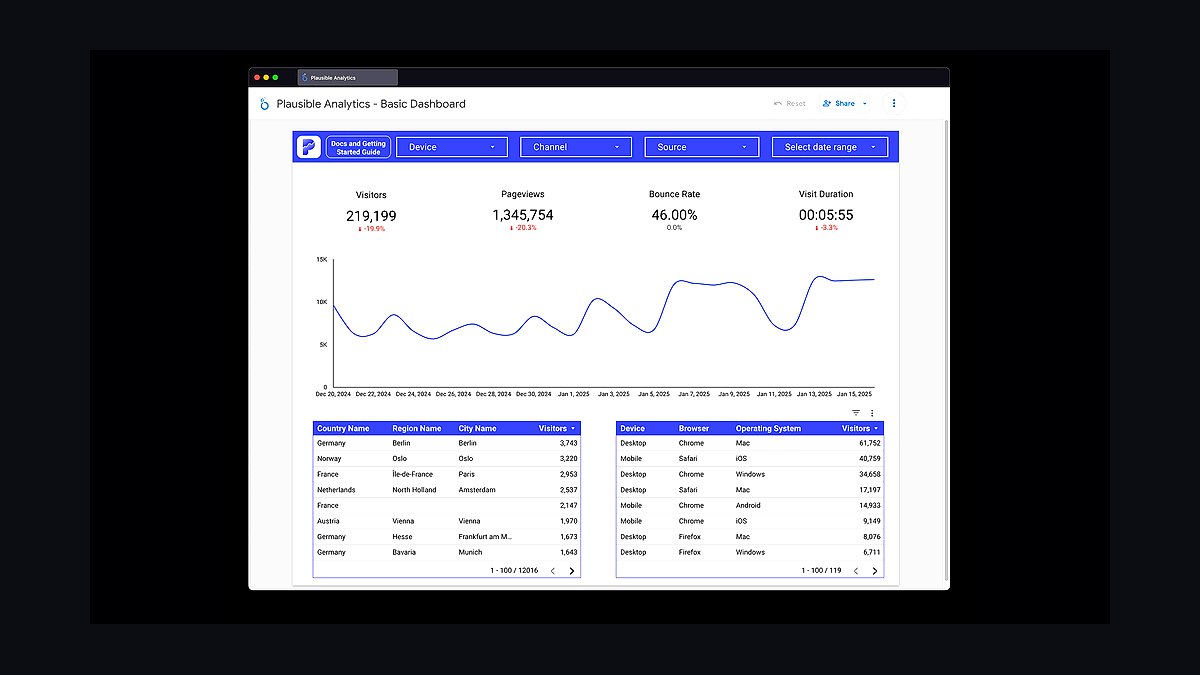
Plausible enters eighth as a privacy-first analytics platform that added scroll and click heatmaps without cookies or personal data collection, keeping it GDPR, CCPA, and PECR compliant by default. Plans start around $9 monthly for 10,000 monthly pageviews, the cheapest paid entry on this list. The script weighs under 1KB and heatmaps load inside the same dashboard.
It suits privacy-sensitive sites, EU publishers, and teams that want behavior insight without a consent banner for analytics. The trade-off is basic heatmaps: no session recordings, no rage-click detection, no funnel visualization. Compared with Lucky Orange above, it is cheaper and cleaner legally but far less granular, so it complements rather than replaces a full behavioral suite.
9Quantum Metric Heatmap Tool

Quantum Metric ranks ninth as an enterprise digital-analytics platform whose heatmaps feed directly into session replay, error detection, and journey mapping across web and mobile. Pricing is custom and generally quoted in the tens of thousands annually. It captures every session without sampling and surfaces technical errors alongside behavioral friction.
It targets large enterprises, especially retail and financial services, where a single checkout bug costs more than the license. The trade-off is cost, procurement overhead, and a platform far too heavy for small teams. Compared with FullStory above, it leans harder into technical monitoring and journey analytics but carries similar enterprise pricing and complexity.
10Contentsquare Heatmap Tool
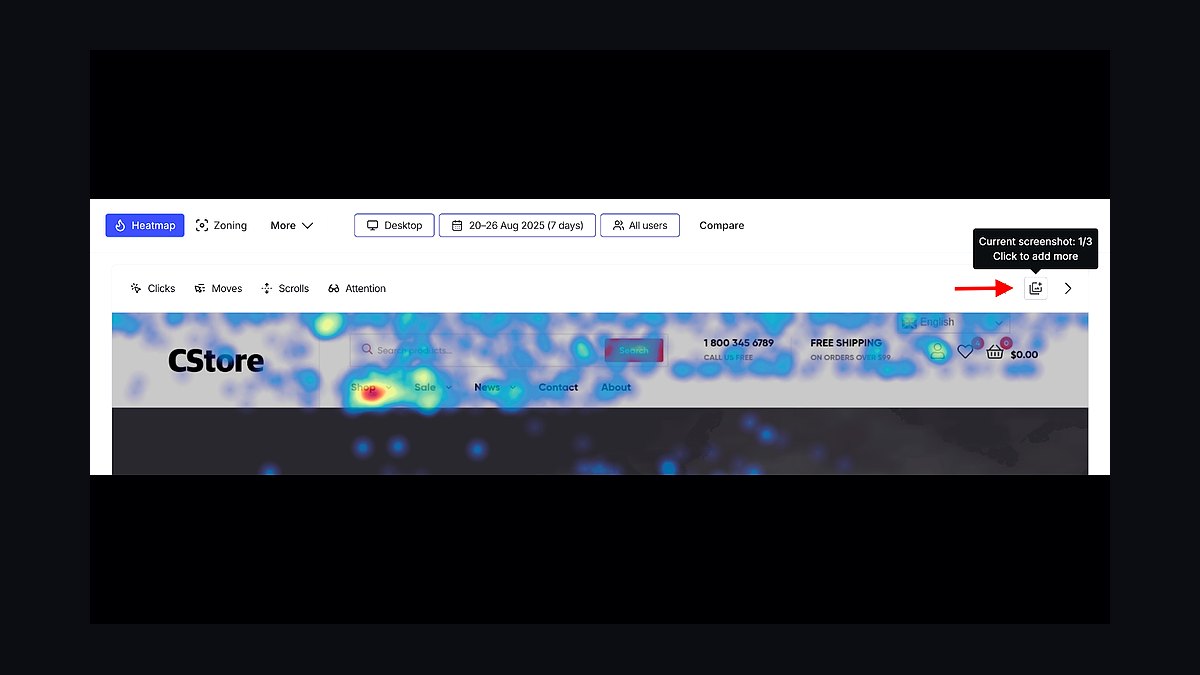
Contentsquare closes the list at tenth for AI-driven heatmaps that automatically surface zone-based attention, hesitation, and frustration metrics across web and app. Enterprise pricing is custom and typically six figures annually for large properties. Its zoning engine attributes revenue impact to specific page areas without manual tagging.
It serves large ecommerce and media companies with dedicated analytics teams who need revenue attribution from behavior. The trade-off is significant cost, long onboarding, and features most mid-market sites will never use. Compared with Quantum Metric above, it emphasizes revenue and content analytics over technical error monitoring, but both sit firmly in the enterprise tier.
How we ranked these
We ranked heatmap tools on four weighted criteria: session-replay fidelity (30%), click/scroll/move-map accuracy and sampling controls (25%), integration breadth with CMS, e-commerce and analytics stacks (25%), and pricing transparency plus privacy/GDPR tooling (20%). Each tool was scored against documented behavior, published changelogs and hands-on trials across desktop and mobile viewports.
We deliberately ignored marketing claims, awards badges, G2 leaderboard placement and vendor-published benchmark charts, since these are self-reported and rarely reproducible. We also excluded raw user-count popularity, affiliate-driven "best of" listicles and feature checklists that count trivial toggles equally with core capture accuracy. Longevity and brand size carried no weight.
What to look for
What matters most is capture fidelity under real traffic: does the tool record every session or sample, and can you trust the click coordinates on responsive layouts and single-page apps? Check event volume limits, retention windows and whether heatmaps segment by device, source and logged-in state without extra engineering work.
The common mistake is buying on seat price alone. Cheap plans often meter sessions or recordings, so costs spike the moment traffic grows or you enable full capture. Buyers also overlook consent-mode support and data residency, then discover legal review blocks rollout. Trial on your own site with real traffic before committing.
Related questions
What is a heatmap tool for websites?
A heatmap tool aggregates user interaction data, such as clicks, taps, scroll depth and mouse movement, into color-coded overlays on a page. It reveals which elements attract attention and which are ignored, helping teams fix layout, copy and call-to-action placement without guessing.
How do heatmaps differ from session replay?
Heatmaps aggregate thousands of sessions into one visual summary, showing patterns and density. Session replay records individual journeys you can watch step by step. Most modern platforms bundle both, since aggregate views explain what happens broadly while replays explain why a specific user struggled.
Do heatmaps work on mobile devices?
Yes, but the data differs. Mobile heatmaps track taps, swipes and scroll depth rather than hover or cursor movement, since there is no pointer. Responsive layouts also shift element positions, so a good tool normalizes coordinates per breakpoint instead of blending desktop and mobile into one misleading overlay.
Are heatmap tools GDPR compliant?
Compliance depends on configuration, not the vendor alone. Look for IP anonymization, consent-mode integration, data-processing agreements and EU or regional hosting. Many tools mask keystrokes and form fields by default. Without consent gating, recording personal data can breach GDPR even if the provider advertises compliance.
How much do website heatmap tools cost?
Entry plans typically run free to roughly $30 monthly for low traffic, while mid-tier plans with unlimited heatmaps and higher session caps sit between $100 and $500 monthly. Enterprise pricing is quote-based and often tied to monthly sessions or tracked users, so model your real traffic before choosing.
Can heatmaps improve conversion rates?
They can, when paired with a hypothesis. Heatmaps show where attention and friction concentrate, such as a dead zone above the fold or a CTA users scroll past. Teams that test changes against that evidence usually see better lift than those acting on heatmaps alone without A/B validation.
What is scroll depth tracking?
Scroll depth measures how far down a page visitors travel, usually reported as percentages like 25, 50, 75 and 100. It exposes content that never gets seen and pages that are too long. Combined with click maps, it shows whether users engage before or after the point of drop-off.
Do heatmaps slow down a website?
A well-built script adds minimal overhead, often under 50 milliseconds, because it batches events and loads asynchronously. Poorly configured tools that record every mousemove or load large libraries can hurt Core Web Vitals. Always test page speed before and after installing a snippet.
FAQ
Which heatmap tool is best for beginners?
Tools with a single snippet install, automatic heatmap generation and no required event tagging suit beginners best. Look for a free tier so you can validate value before paying. Avoid platforms that demand data-layer setup or developer time just to see your first click map.
Do I need both heatmaps and analytics?
Yes, they answer different questions. Analytics tells you what happened in aggregate, such as traffic, bounce rate and conversions. Heatmaps show where on the page it happened. Using both lets you spot a high-traffic page in analytics, then diagnose the layout problem visually.
How long should I run a heatmap test?
Collect at least two to four weeks or until you have several thousand sessions per page, whichever comes later. Short windows skew toward weekday or campaign traffic. Segment by device and source before drawing conclusions, since desktop and mobile behavior often diverge sharply.
Can heatmaps track clicks on dynamic content?
Modern tools handle dynamic elements if they identify targets by stable selectors, text or DOM path rather than fixed coordinates. Single-page apps and A/B tests can break naive tracking. Verify that your tool re-renders overlays correctly after route changes or lazy-loaded sections appear.
What are rage clicks and dead clicks?
Rage clicks are repeated rapid clicks on an element that appears unresponsive, signaling frustration. Dead clicks are clicks on non-interactive areas, like text that looks like a link. Both are strong UX signals and most heatmap platforms surface them as separate reports.
Do heatmaps capture form field input?
Reputable tools do not capture what users type into fields. They record interaction, such as focus, abandonment and field-level drop-off, while masking or excluding the actual values. Confirm masking is on by default, especially for payment and health-related forms.
How do I choose between session limits and unlimited plans?
Estimate monthly sessions from your analytics, then add headroom for growth and campaigns. Unlimited-session plans cost more upfront but avoid throttling during traffic spikes. Metered plans are cheaper at low volume but can silently stop recording mid-month, skewing your data.
Are heatmaps useful for e-commerce sites?
They are especially useful there. Product page heatmaps reveal whether users find size guides, reviews and add-to-cart buttons. Checkout funnels benefit from field-level drop-off analysis. Segment by returning versus new shoppers, since their behavior and hesitation points differ significantly.
What privacy settings should I enable first?
Enable IP anonymization, exclude sensitive pages by URL, mask all form inputs and connect your consent management platform so recording only starts after opt-in. Document retention limits and honor deletion requests. These steps reduce legal exposure before you collect a single session.
Can heatmaps replace user testing?
No. Heatmaps show what users do at scale but not why. They cannot capture confusion, intent or verbal reasoning. Pair quantitative heatmap data with moderated usability sessions or surveys to understand motivation, then validate fixes with controlled experiments.
Sources
- https://www.nngroup.com/articles/heatmap-ux/
- https://support.google.com/analytics/answer/9234069
- https://developer.mozilla.org/en-US/docs/Web/API/Intersection_Observer_API
- https://web.dev/articles/vitals
- https://gdpr.eu/what-is-gdpr/
- https://www.hotjar.com/heatmaps/
- https://www.smartlook.com/
- https://www.w3.org/TR/WCAG22/
- https://support.microsoft.com/en-us/clarity
Related on PULSE
This page will be disappearing soon. Save it to your device for $1 — or read it free while it is here.
@Kory-White- · if Venmo asks, the last 4 of my number are 2012
This page is gone.
This one is off the shelf now. $1 keeps it on your phone for good — the whole page, pictures and diagrams included.
 revopsTop 10 Website Analytics Tools in 2027
 revopsTop 10 Web Hosting Providers for Small Businesses in 2027
 revopsTop 10 WordPress Page Builders in 2027
 revopsTop 10 Website Design Agencies for Small Businesses in 2027
 revopsTop 10 AI Content Tools for Auto-Publishing Websites in 2027
 revopsTop 10 Tools for Building Websites in 2027
 revopsTop 10 SEO Tools for New Websites in 2027
 revopsTop 10 Website Builders for Real Estate Agents in 2027
 revopsTop 10 Questions to Ask Before Hiring a Web Designer in 2027
 revopsTop 10 Domain Registrars in 2027